1681
Cerebrospinal fluid flow measurement using alternate ascending/descending directional navigation (ALADDIN)1Department of Bio and Brain Engineering, Korea Advanced Institute of Science and Technology, Daejeon, Korea, Republic of, 2Department of Radiology, Seoul National University Hospital, Seoul National University College of Medicine, Seoul, Korea, Republic of
Synopsis
Imaging in-vivo movement of cerebrospinal fluid can be applied not only to diagnose the CSF disorders like hydrocephalus, but also to visualize and evaluate the CSF circulation for the clearance. In this study, we used single phase and multiphase alternate ascending/descending directional navigation (ALADDIN) to image the overall, dynamic CSF flow pattern. Single phase ALADDIN showed overall bulk flow of CSF, and multiphase ALADDIN showed dynamically‑tracked signals of labeled CSF. We expect that ALADDIN can be applied to study CSF circulation and clearance disorders.
Introduction
Recently, cerebrospinal fluid(CSF) flow is one of the key point to reveal clearance of brain waste [1] and to diagnose or to distinguish various hydrocephalus cases [2]. In MRI, T2 weighted imaging and cine-gated phase contrast MRI have been widely used for imaging CSF. However, these methods cannot track the CSF circulation. Information on the CSF source and flow direction is important for planning the surgery for some CSF diseases such as obstructive hydrocephalus based on the knowledge on the cite of CSF blockage.In this research, we propose imaging CSF movement by using one of the spin labeling techniques, alternate ascending/descending directional navigation(ALADDIN) with single and multiple phases [3,4]. Because of sensitivity to slowly-moving fluid such as CSF and availability of flow directional information, single‑phase ALADDIN may be able to show the overall CSF movement as well as blood perfusion in brain tissue. Multi-phase ALADDIN may be used for analysis of dynamic bulk and pulsatile CSF flow by tracking the labeled CSF signals. Compared with the conventional phase contrast imaging, ALADDIN may provide additional information of the CSF signal source location because ALADDIN is based on spin labeling.
Methods
All experiments were performed on a 3T MRI scanner(Siemens Medical Solutions). Total 3 normal volunteers were scanned in this study approved by the Institutional Review Board. To get perfusion and CSF images, 2D bSSFP imaging technique (ALADDIN) was used. The ALADDIN imaging were performed in the ascending and descending orders with positive/negative slice-selection gradients and positive/negative readout gradients in an alternating manner, yielding total 8 different measurements that composed one set. To get dynamic multi-phase CSF image, multi-phase ALADDIN images were acquired. 768 phase encoding steps per measurement were used to fill sixteen segmented K-spaces. Therefore each K-space was filled with 48 phase-encoding steps per measurement and four measurements were necessary to completely fill all the 192 phase encoding steps (Fig.1), therefore total 32 measurements were performed for each scan. Through the multiphase strategy, dynamic data were obtained in time phases from 108ms to 3687ms. The center imaging slice position was set to perpendicular to the aqueduct (Fig.2).Imaging parameters were TR/TE = 4.07/2 ms, flip angle = 60°, matrix size = 128×128, field of view = 220×220 mm2, thickness = 5 mm, gap = 5 mm, scan direction = coronal, PE order = linear, and PE direction = left–right. Two full sets (total 16 measurements) were acquired with number of slices =19 and then another two full sets were acquired with number of slices =18. The former and the latter covered the whole brain with no gap and with total scan time = 3min 33sec. For multiphase ALADDIN, imaging parameters to get a set of 2D bSSFP images were:TR/TE = 4.66/2.08 ms, matrix size = 256x192, FOV = 220x220 mm2, number of slices=3, phase encoding order =linear, delay time between each measurement =2 sec, slice thickness =8 mm, gap=8mm, and total scan time =6min 40s. Four ascending acquisitions and four descending acquisitions were averaged separately and then subtraction was performed between the two averaged acquisitions to maximize the flow signals which have directionality. To visualize the CSF better, the images were displayed in two different manners: baseline-weighted images (Asc-Dsc)*S/max(S), percent signal changes (Asc-Dsc)/S*100, where Asc and Dsc represent the averaged ascending and descending images and S represents average of Asc and Dsc.
For the reference of CSF movements, the in-plane velocity encoding cine-gated phase contrast(PC) imaging was performed to acquire the pattern of CSF flow in sagittal view with velocity encoding(VENC) of 10cm/s. A region of interest(ROI) was manually defined in the aqueduct for quantitative analysis of ALADDIN and PC MRI.
Results
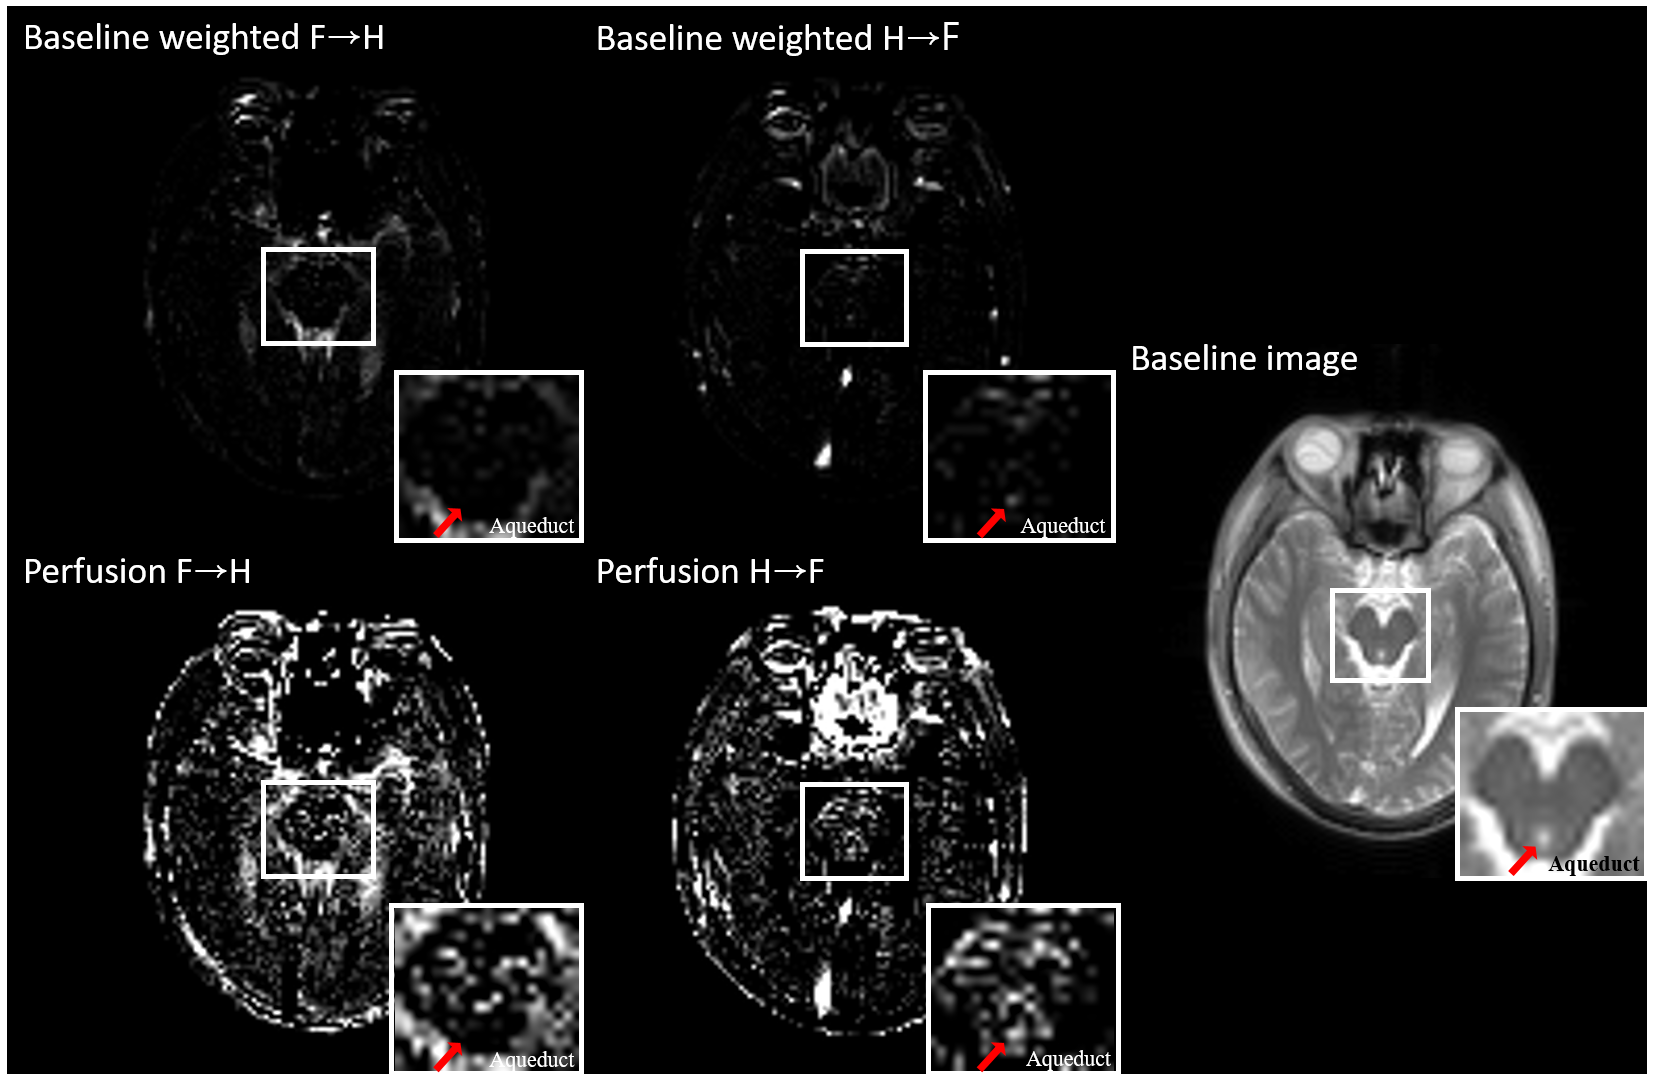
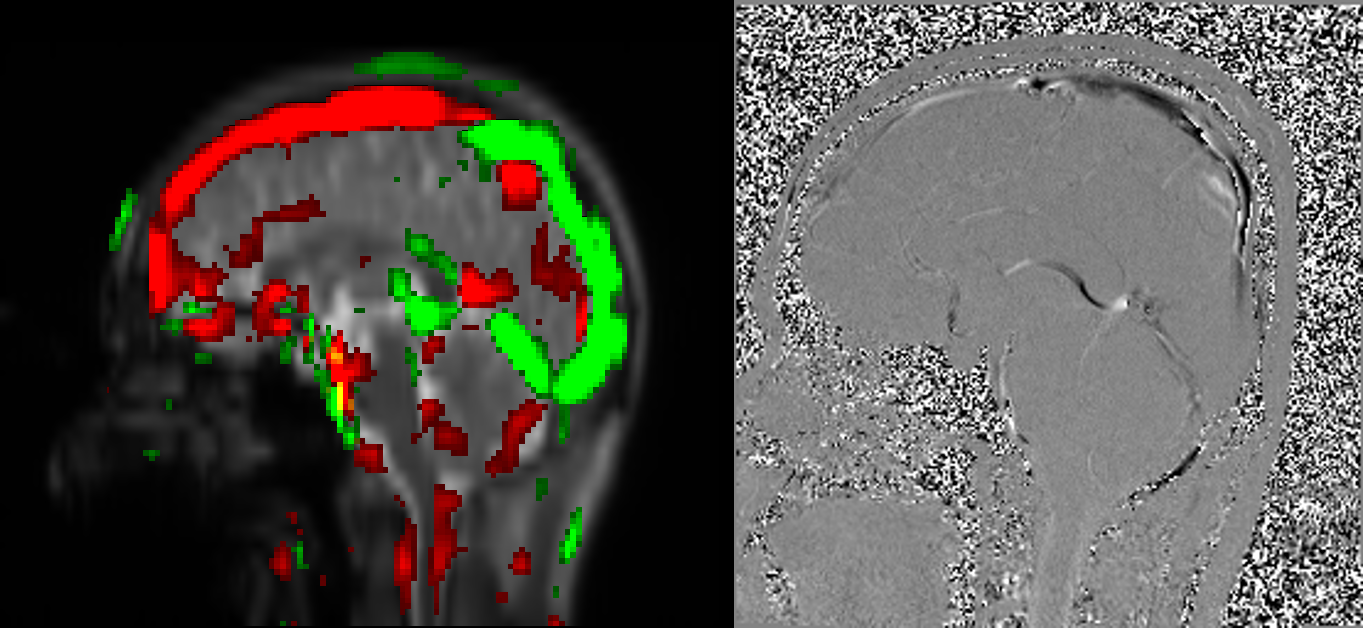
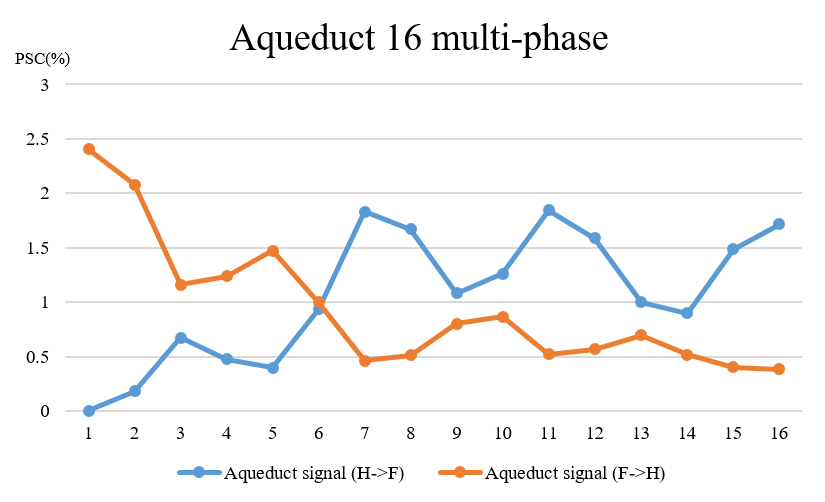
Both single-phase and multi-phase ALADDIN showed high signal intensity in the CSF spaces with high flow rate, typically in the region of aqueduct. Furthermore, aqueduct signal was bright in the ALADDIN images of flow direction from head to feet(Fig.3). In multi-planar reconstruction of the axial ALADDIN baseline-weighted images into the sagittal view, the overall flow directions of CSF and blood compartments were similar to those of the in-plane phase contrast image(Fig.4). In the multiphase ALADDIN, CSF signals of feet to head direction increased first and then decreased in the later phase, whereas those of head to feet direction were low initially and then increased in the later phase(Fig.5).Discussion and Conclusion
The signals from the aqueduct region were clearly detected in ALADDIN because the CSF in the aqueduct is moving relatively fast compare to other CSF spaces. CSF movement was mostly affected by cardiac pulsation and respiratory movement as previous studies showed by using phase contrast MRI. However, ALADDIN images displayed bulk flow direction of CSF because each ALADDIN image contains 16 measurements which were acquired in 12 seconds(Fig.2, Fig.3). From the result of multiphase ALADDIN, we can confirm that the labeled CSF in the 4th ventricle moves up to the aqueduct immediately by cardiac pulsation and the labeled CSF in the lateral ventricle moves down to the aqueduct slowly by the pressure gradient made by lateral ventricle choroid plexus CSF production(Fig.4). For the future works, aqueduct CSF flow can be quantified from multiphase ALADDIN by using kinetic model of bSSFP [4].Acknowledgements
No acknowledgement found.References
1. Ji Hoon Ahn, Hyunsoo Cho, Jun-Hee Kim, Shin Heun Kim, Je-Seok Ham, Intae Park, Sang Heon Suh, Seon Pyo Hong, Joo-Hye Song, Young-Kwon Hong, Yong Jeong, Sung-Hong Park, Gou Young Koh. Meningeal lymphatic vessels at the skull base drain cerebrospinal fluid. Nature, 2019; DOI: 10.1038/s41586-019-1419-5
2. Kim, D. S., Choi, J. U., Huh, R., Yun, P. H., & Kim, D. I. (1999). Quantitative assessment of cerebrospinal fluid hydrodynamics using a phase-contrast cine MR image in hydrocephalus. Child's nervous system, 15(9), 461-467.
3. Park SH, Duong TQ. Brain MR perfusion-weighted imaging with alternate ascending/descending directional navigation. Magn Reson Med. 2011;65(6):1578–1591. doi:10.1002/mrm.22580
4. Kim KH, Choi SH, Park SH. Feasibility of Quantifying Arterial Cerebral Blood Volume Using Multiphase Alternate Ascending/Descending Directional Navigation (ALADDIN). PLoS One. 2016;11(6):e0156687. Published 2016 Jun 3. doi:10.1371/journal.pone.0156687
Figures