1680
WMH and PVS mapping from clinical data using semi-supervised multi-modal convolutional neural network
Farshid Sepehrband1, Giuseppe Barisano2, Hyun-Joon Yang2, Jeiran Choupan2, and Arthur W Toga2
1Stevens Neuroimaging and Informatics Institute, Keck School of Medicine, USC, Los Angeles, CA, United States, 2USC, Los Angeles, CA, United States
1Stevens Neuroimaging and Informatics Institute, Keck School of Medicine, USC, Los Angeles, CA, United States, 2USC, Los Angeles, CA, United States
Synopsis
Perivascular space (PVS), also known as Virchow-Robin space, is a pial-lined, fluid-filled structure that surrounds vessels in the cerebral cortex [1], [2], and occupies a large portion of the cerebral tissue. While PVS mapping becomes more clinically relevant, separation of PVS from white matter hyperintensities (WMH) make it challenging to map PVS on clinical data. Here we present a semi-supervised multi-modal approach to extract both PVS and WMH using T1w and FLAIR image modalities automatically. We also evaluated multi-site, multi-vendor reliability of the technique.
Introduction
Automated mapping of the PVS often requires high-resolution multi-modal acquisitions, limiting its application to research data [3]. In clinical data, since both PVS and WMH appear hypointense in T1w images, automatic distinction of PVS from other age or AD-related white matter changes such as WMH could be challenging. However the inverse pattern of PVS and WMH on FLAIR data provides an additional degree of freedom to improve automated mapping of either of these valuable vascular features.Method
Here we propose an automated technique for mapping PVS and WMH on clinical data using a combination of T1w and FLAIR data. To this end, we extracted morphological features of the PVS from T1w image using Frangi filtering [3]. We also mapped WMH from FLAIR using conventional algorithmic approaches [4]. FLAIR image of each subject was then corrected for non-uniform field inhomogeneity using N4ITK module [5]of Advanced Normalization Tools (ANTs) [6]. FLAIR image was then co-registered to T1w image using ANTs software. For each voxel with high vesselness likelihood we estimated the percentile of the FLAIR intensity in a given geodesic distant across the voxels within the white matter. Voxels with low percentile were segmented as PVS and those with high FLAIR intensity were added to a temporary WMH mask, which was obtained using signal processing approaches. Then a convolutional neural network was trained on the co-registered multi-modal (T1w and FLAIR) to extract final WMH map. Data from Alzheimer’s disease neuroimaging initiative 3 (ADNI-3) was used to obtain WMH and PVS on total of 423 cognitively healthy controls which were scanned across 19 different sites using Siemens, Philips and GE 3T scanners. 3D T1w with 1mm3resolution was acquired using an MPRAGE sequence (on Siemens and Philips scanners) and FSPGR (on GE scanners). For FLAIR image, a 3D sequence with similar resolution as T1w image was acquired, which provided the opportunity for accurate intrasubject intermodal co-registration. A MPRAGE T1w MRI scan was acquired using the following parameters: Sagittal slices, TR = 2300 ms, TE = 2.98 ms, FOV = 240 ´256 mm2, matrix = 240 ´256 (variable slice number), TI = 900 ms, flip angle = 9, effective voxel resolution = 1 ´1 ´1 mm3. The FSPGR sequence was acquired using: Sagittal slices, TR = 7.3 ms, TE = 3.01 ms, FOV = 256 ´256 mm2, matrix = 256 ´256 (variable slice number), TI = 400 ms, flip angle = 11, effective voxel resolution = 1 ´1 ´1 mm3. 3D FLAIR image was acquired using: Sagittal slices, TR = 4,800 ms, TE = 441 ms, FOV = 256 ´256 mm2, matrix = 256 ´256 (variable slice number), TI = 1650 ms, flip angle = 120, effective voxel resolution = 1 ´1 ´1.2 mm3.A multi-scale 3D convolutional neural network (CNN) was trained on the T1w-FLAIR combined WMH masks to additionally create an automated and fast segmentation of the WMH. Training was performed on ADNI-3 subjects, and recommended network architecture and configuration of [7]was utilized. Finally the mean volume of the segmented PVS was compared and site or vendor dependencies were evaluated.Results
Figure 1shows an example from ADNI3, in which the multi-modal approach enabled accurate classification of PVS. Note that, without FLAIR-based correction, a large portion of white matter voxels may be segmented as PVS. Figure 2compares segmented WMH from FLAIR while the multi-modal approach was adopted. We found no site dependency in PVS maps. However, we observed MRI manufacturer difference across PVS measures (Figure 3). Specifically, PVS was constantly underestimated in Philips scanners (p<0.01 across all comparisons). Further visual inspection suggested that this could be due to the additional filtering that was performed internally in the reconstruction of the T1w image for Philips data. Scanner-related difference was estimated by calculating the unpaired Cohen’deffect size between the mean PVS volume fraction values across vendors.Discussion
Combining T1w and FLAIR enables PVS mapping of clinical data and could also improve WMH mapping. In particular, we showed that PVS can be mapped in clinical data. However, to compensate the presence of white matter lesions, a multi-modal approach should be used. We also noted that the technique was reliable across sites, but could be affected by MRI manufacturer and should be adjusted accordingly.Acknowledgements
This work was supported by NIH grants: 2P41EB015922-21, 1P01AG052350-01 and USC ADRC 5P50AG005142 and R01NS100973. The content is solely the responsibility of the authors and does not necessarily represent the official views of the NIH.References
[1] M. Krueger and I. Bechmann, “CNS pericytes: concepts, misconceptions, and a way out,” Glia, vol. 58, no. 1, pp. 1–10, 2010.[2] E. T. Zhang, C. B. Inman, and R. O. Weller, “Interrelationships of the pia mater and the perivascular (Virchow-Robin) spaces in the human cerebrum.,” J. Anat., vol. 170, p. 111, 1990.[3] F. Sepehrband et al., “Image processing approaches to enhance perivascular space visibility and quantification using MRI,” Sci. Rep., vol. 9, p. 12351, Aug. 2019.[4] N. C. Wetter, E. A. Hubbard, R. W. Motl, and B. P. Sutton, “Fully automated open-source lesion mapping of T2-FLAIR images with FSL correlates with clinical disability in MS.,” Brain Behav., vol. 6, no. 3, p. e00440, Mar. 2016.[5] N. J. Tustison et al., “N4ITK: improved N3 bias correction,” IEEE Trans. Med. Imaging, vol. 29, no. 6, pp. 1310–1320, 2010.[6] B. B. Avants, N. Tustison, and G. Song, “Advanced Normalization Tools (ANTS),” Insight J., pp. 1–35, 2009.[7] K. Kamnitsas et al., “Efficient multi-scale 3D CNN with fully connected CRF for accurate brain lesion segmentation,” Med. Image Anal., vol. 36, pp. 61–78, 2017.Figures
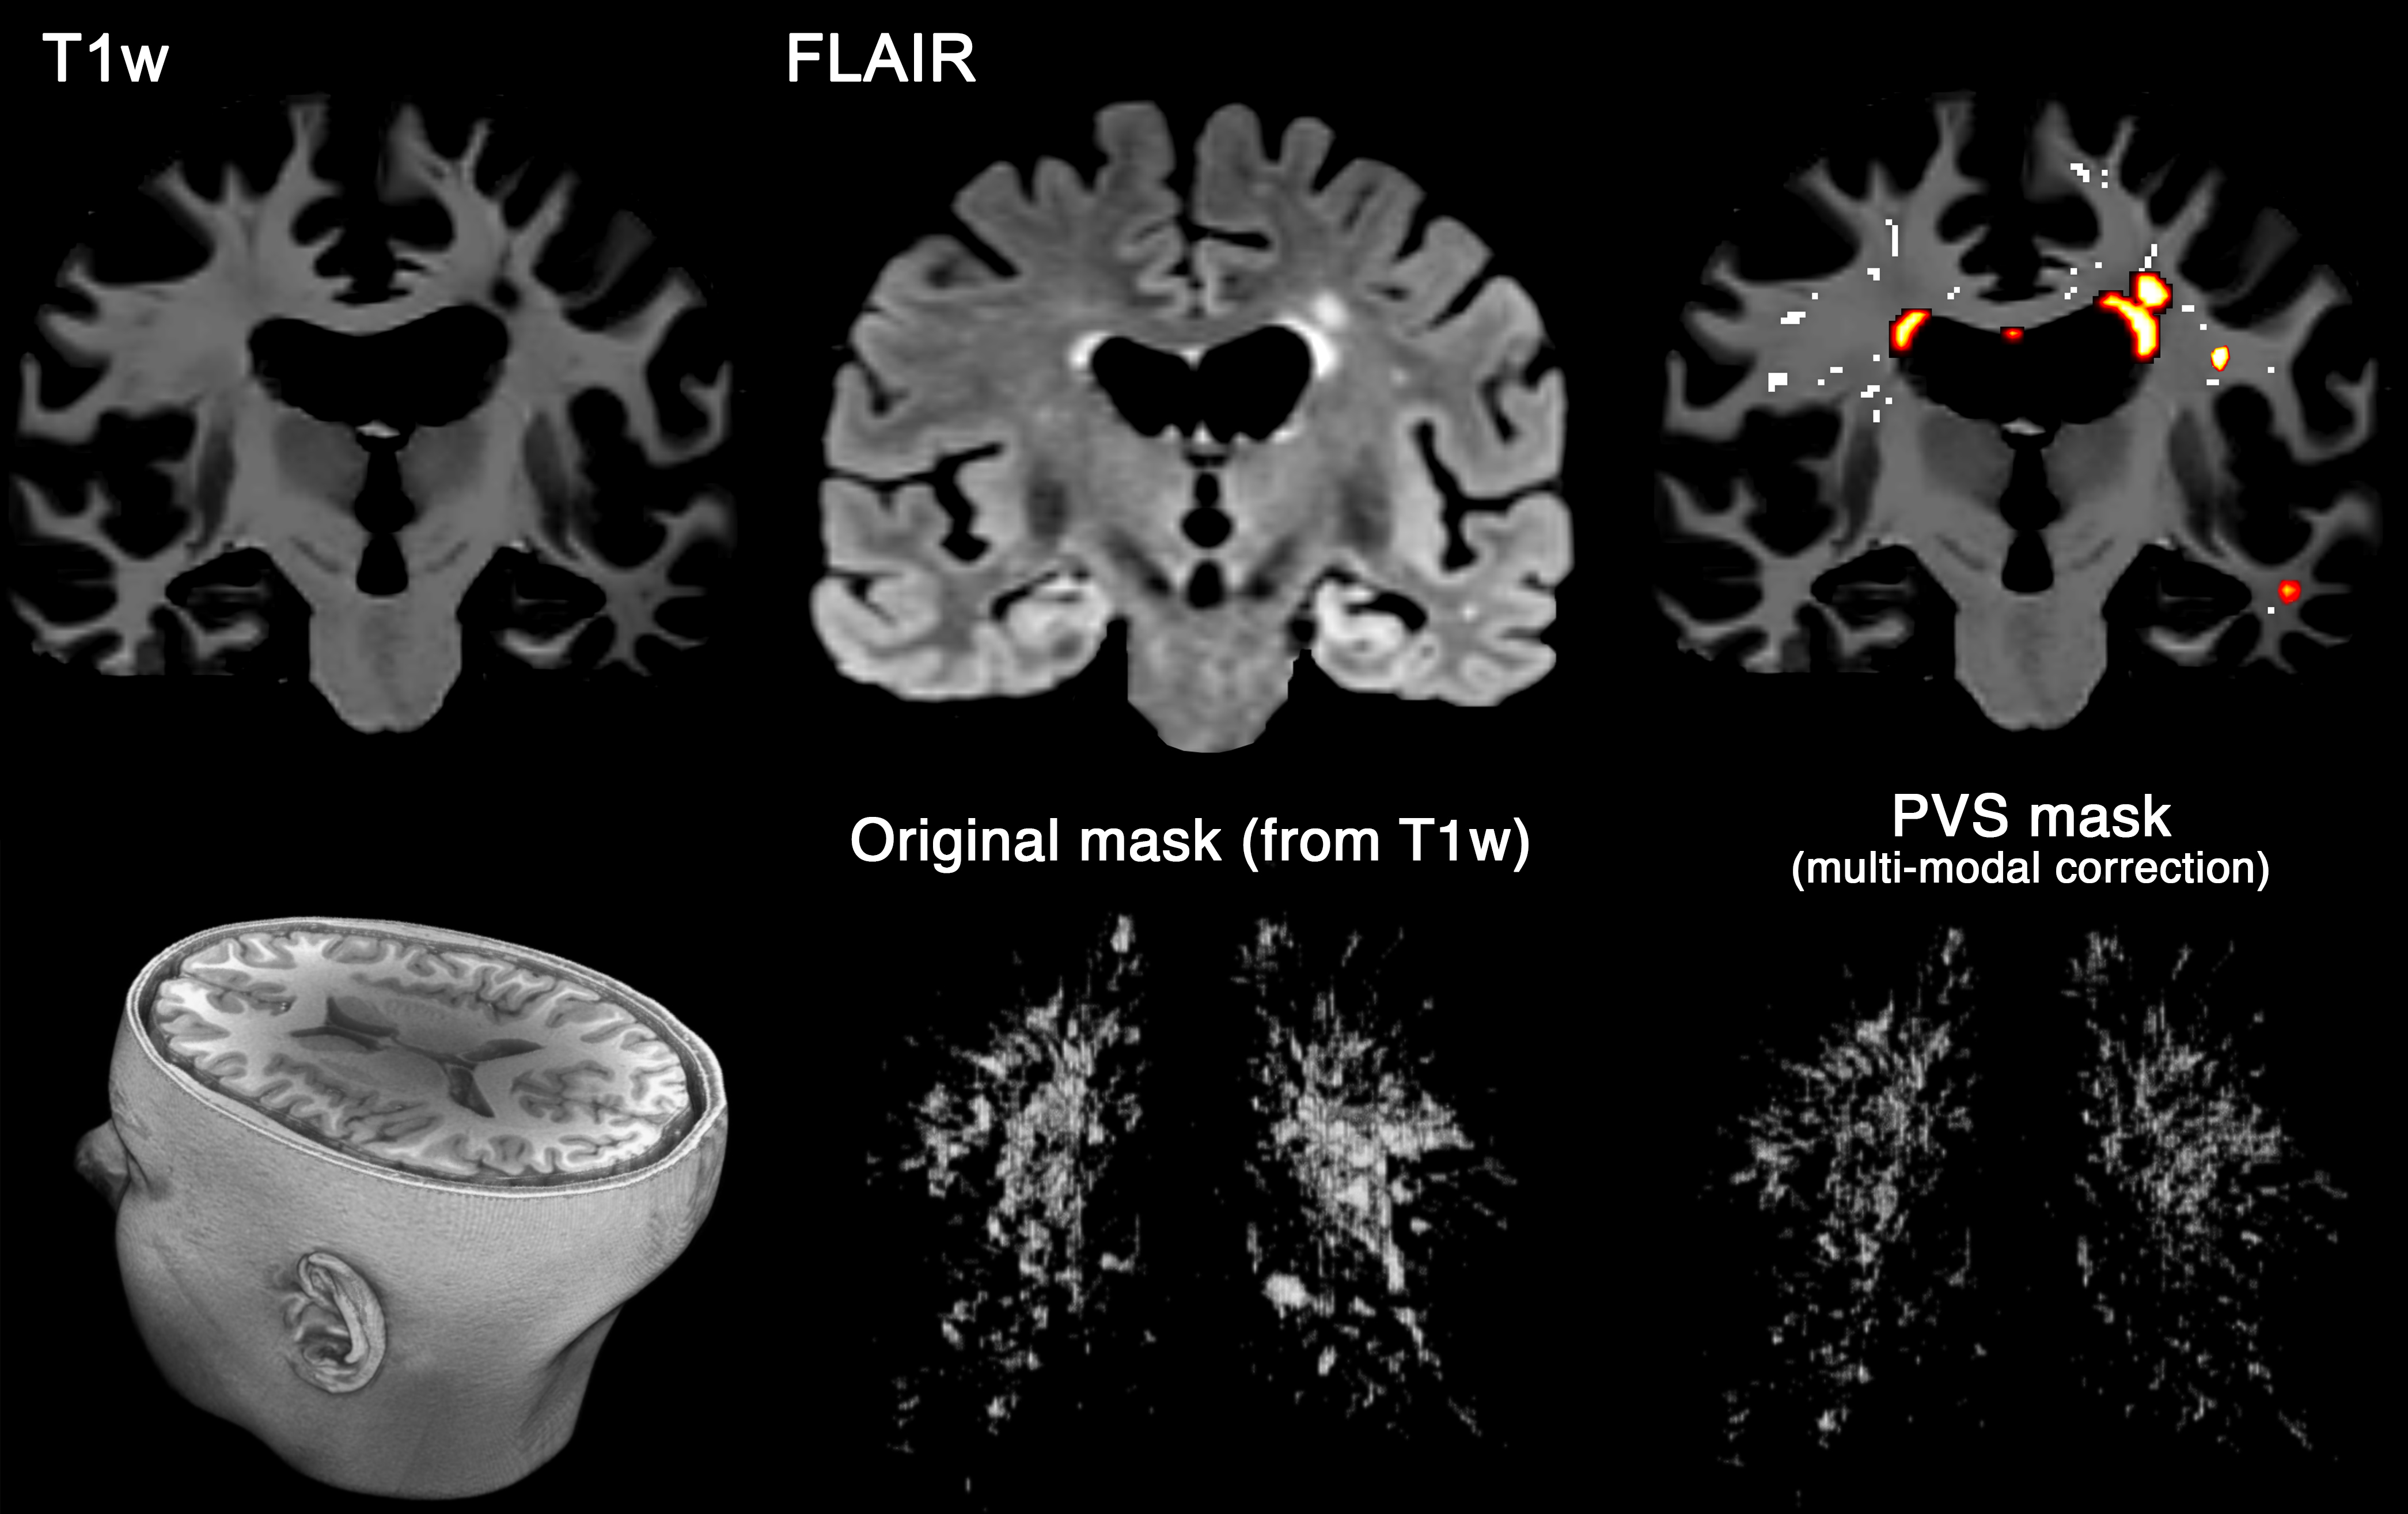
Figure 1. Multi-modal PVS segmentation of clinical data. PVS were mapped from T1w images and then white matter hyperintensities, which was falsely segmented as PVS, were excluded using FLAIR images. PVS segmentation was done using an automated and highly reliable quantification technique [3], based on non-local filtering, Frangi filtering and optimized mask identification. For each segmented voxel in T1w, corresponding FLAIR voxels was checked, and if the FLAIR voxel value was a white matter hyperintensity, then the voxel was excluded from the final PVS mask.
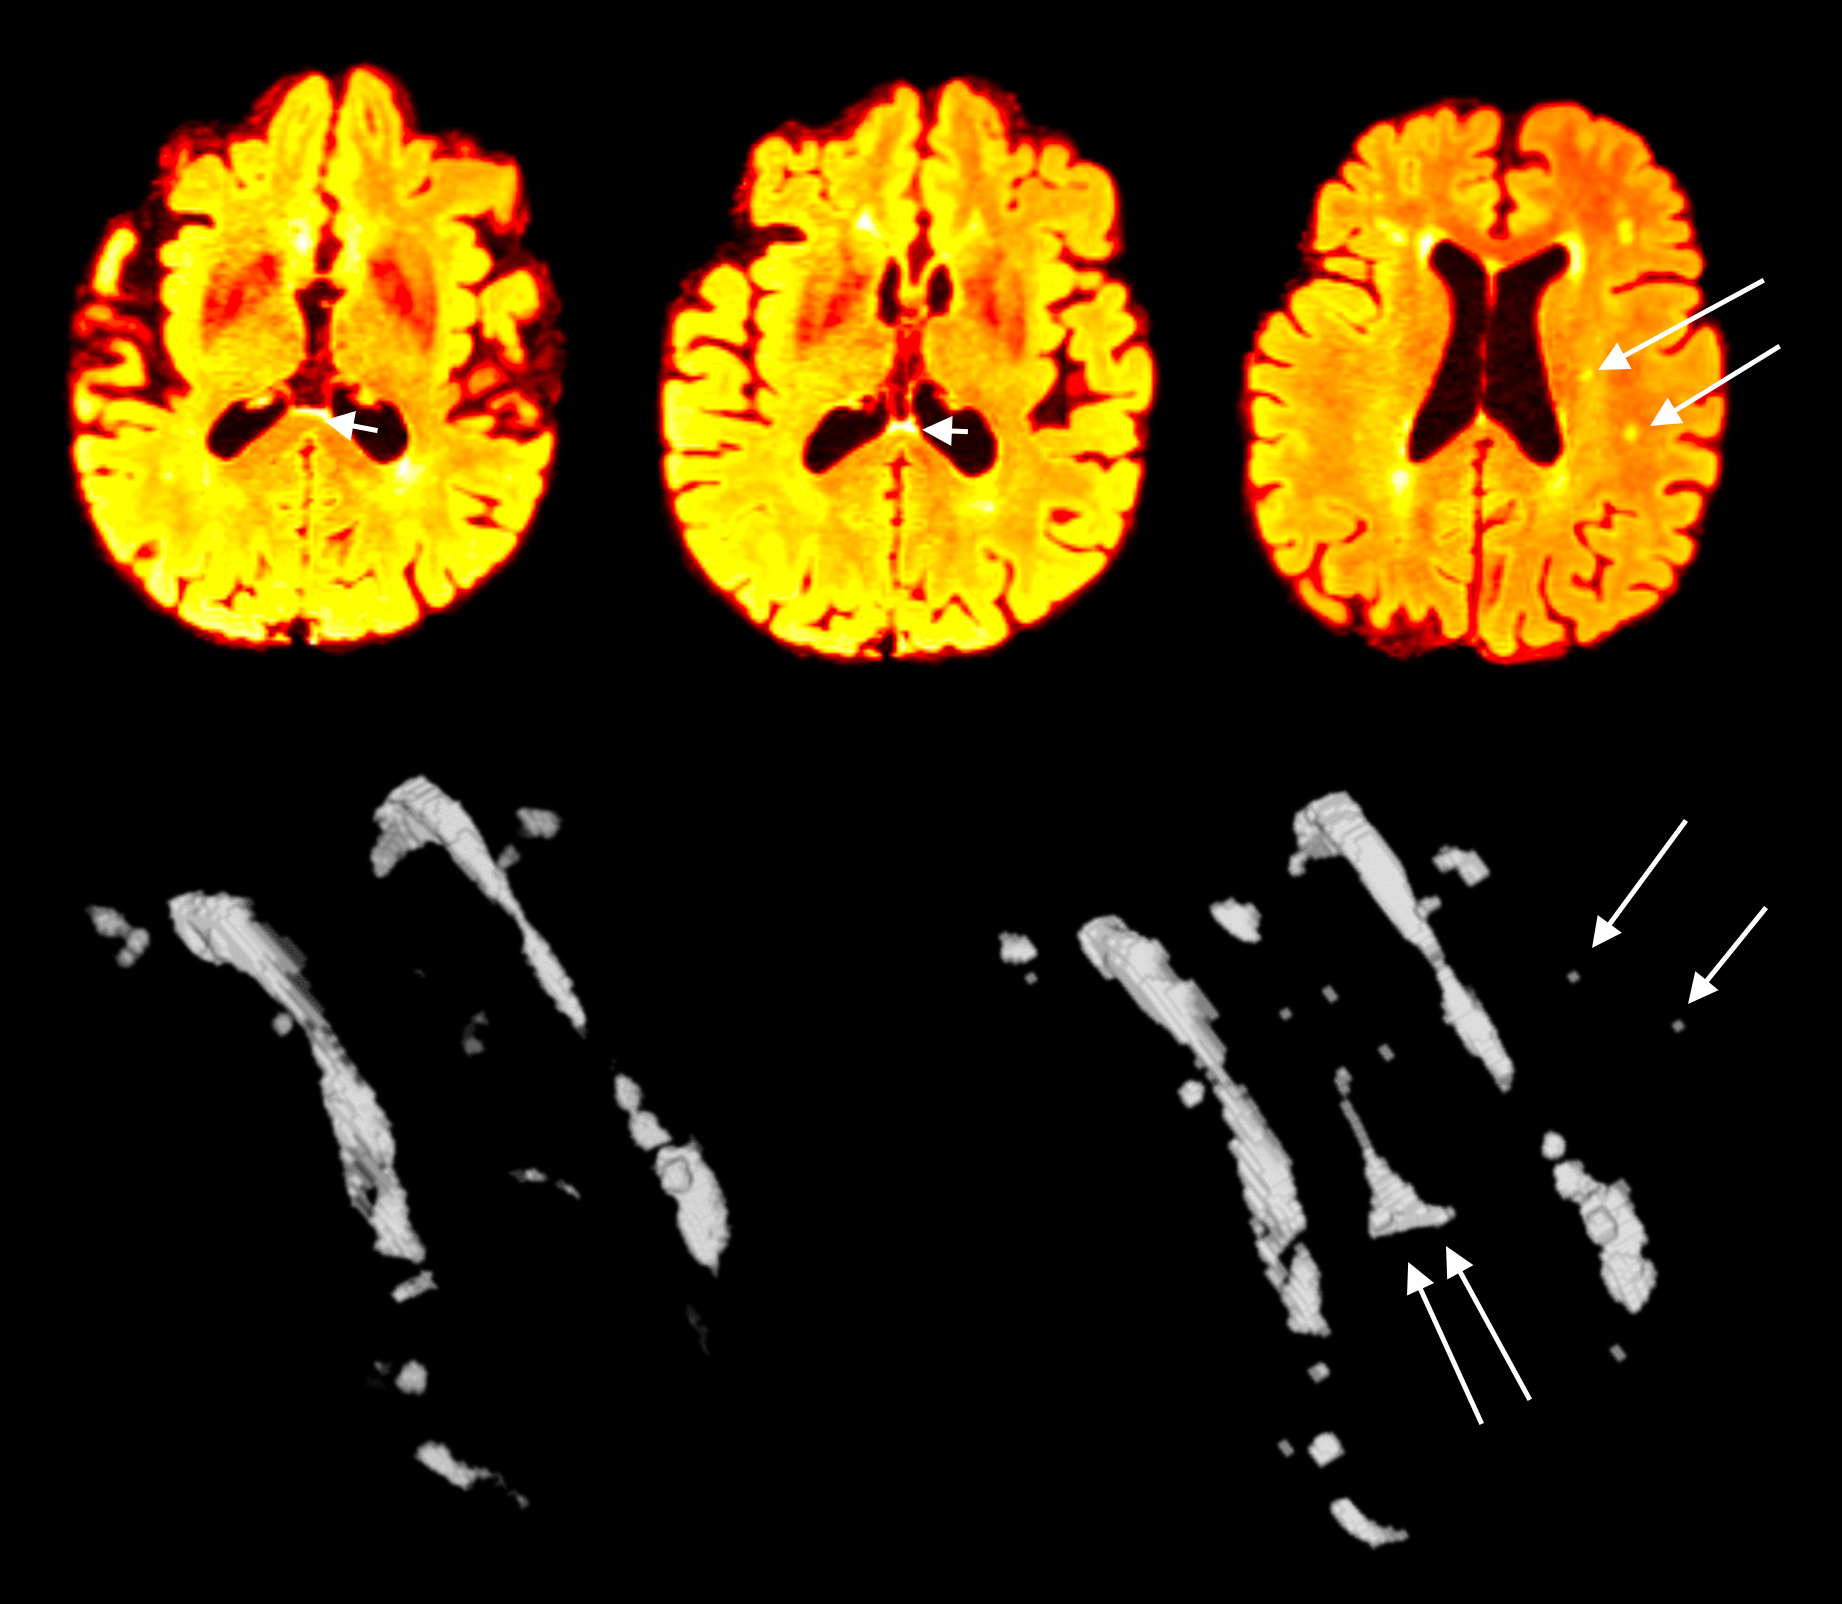
Figure 2. Multi-modal CNN-based WMH segmentation. WMH segmentation when compared when an algorithmic based approach was used[4](left 3D segmented WMH) versus when a multi-modal CNN-based approach was used. Note the increased sensitivity to the small WMHs, or WMH at the ventricle boundary which is often challenging to detect.
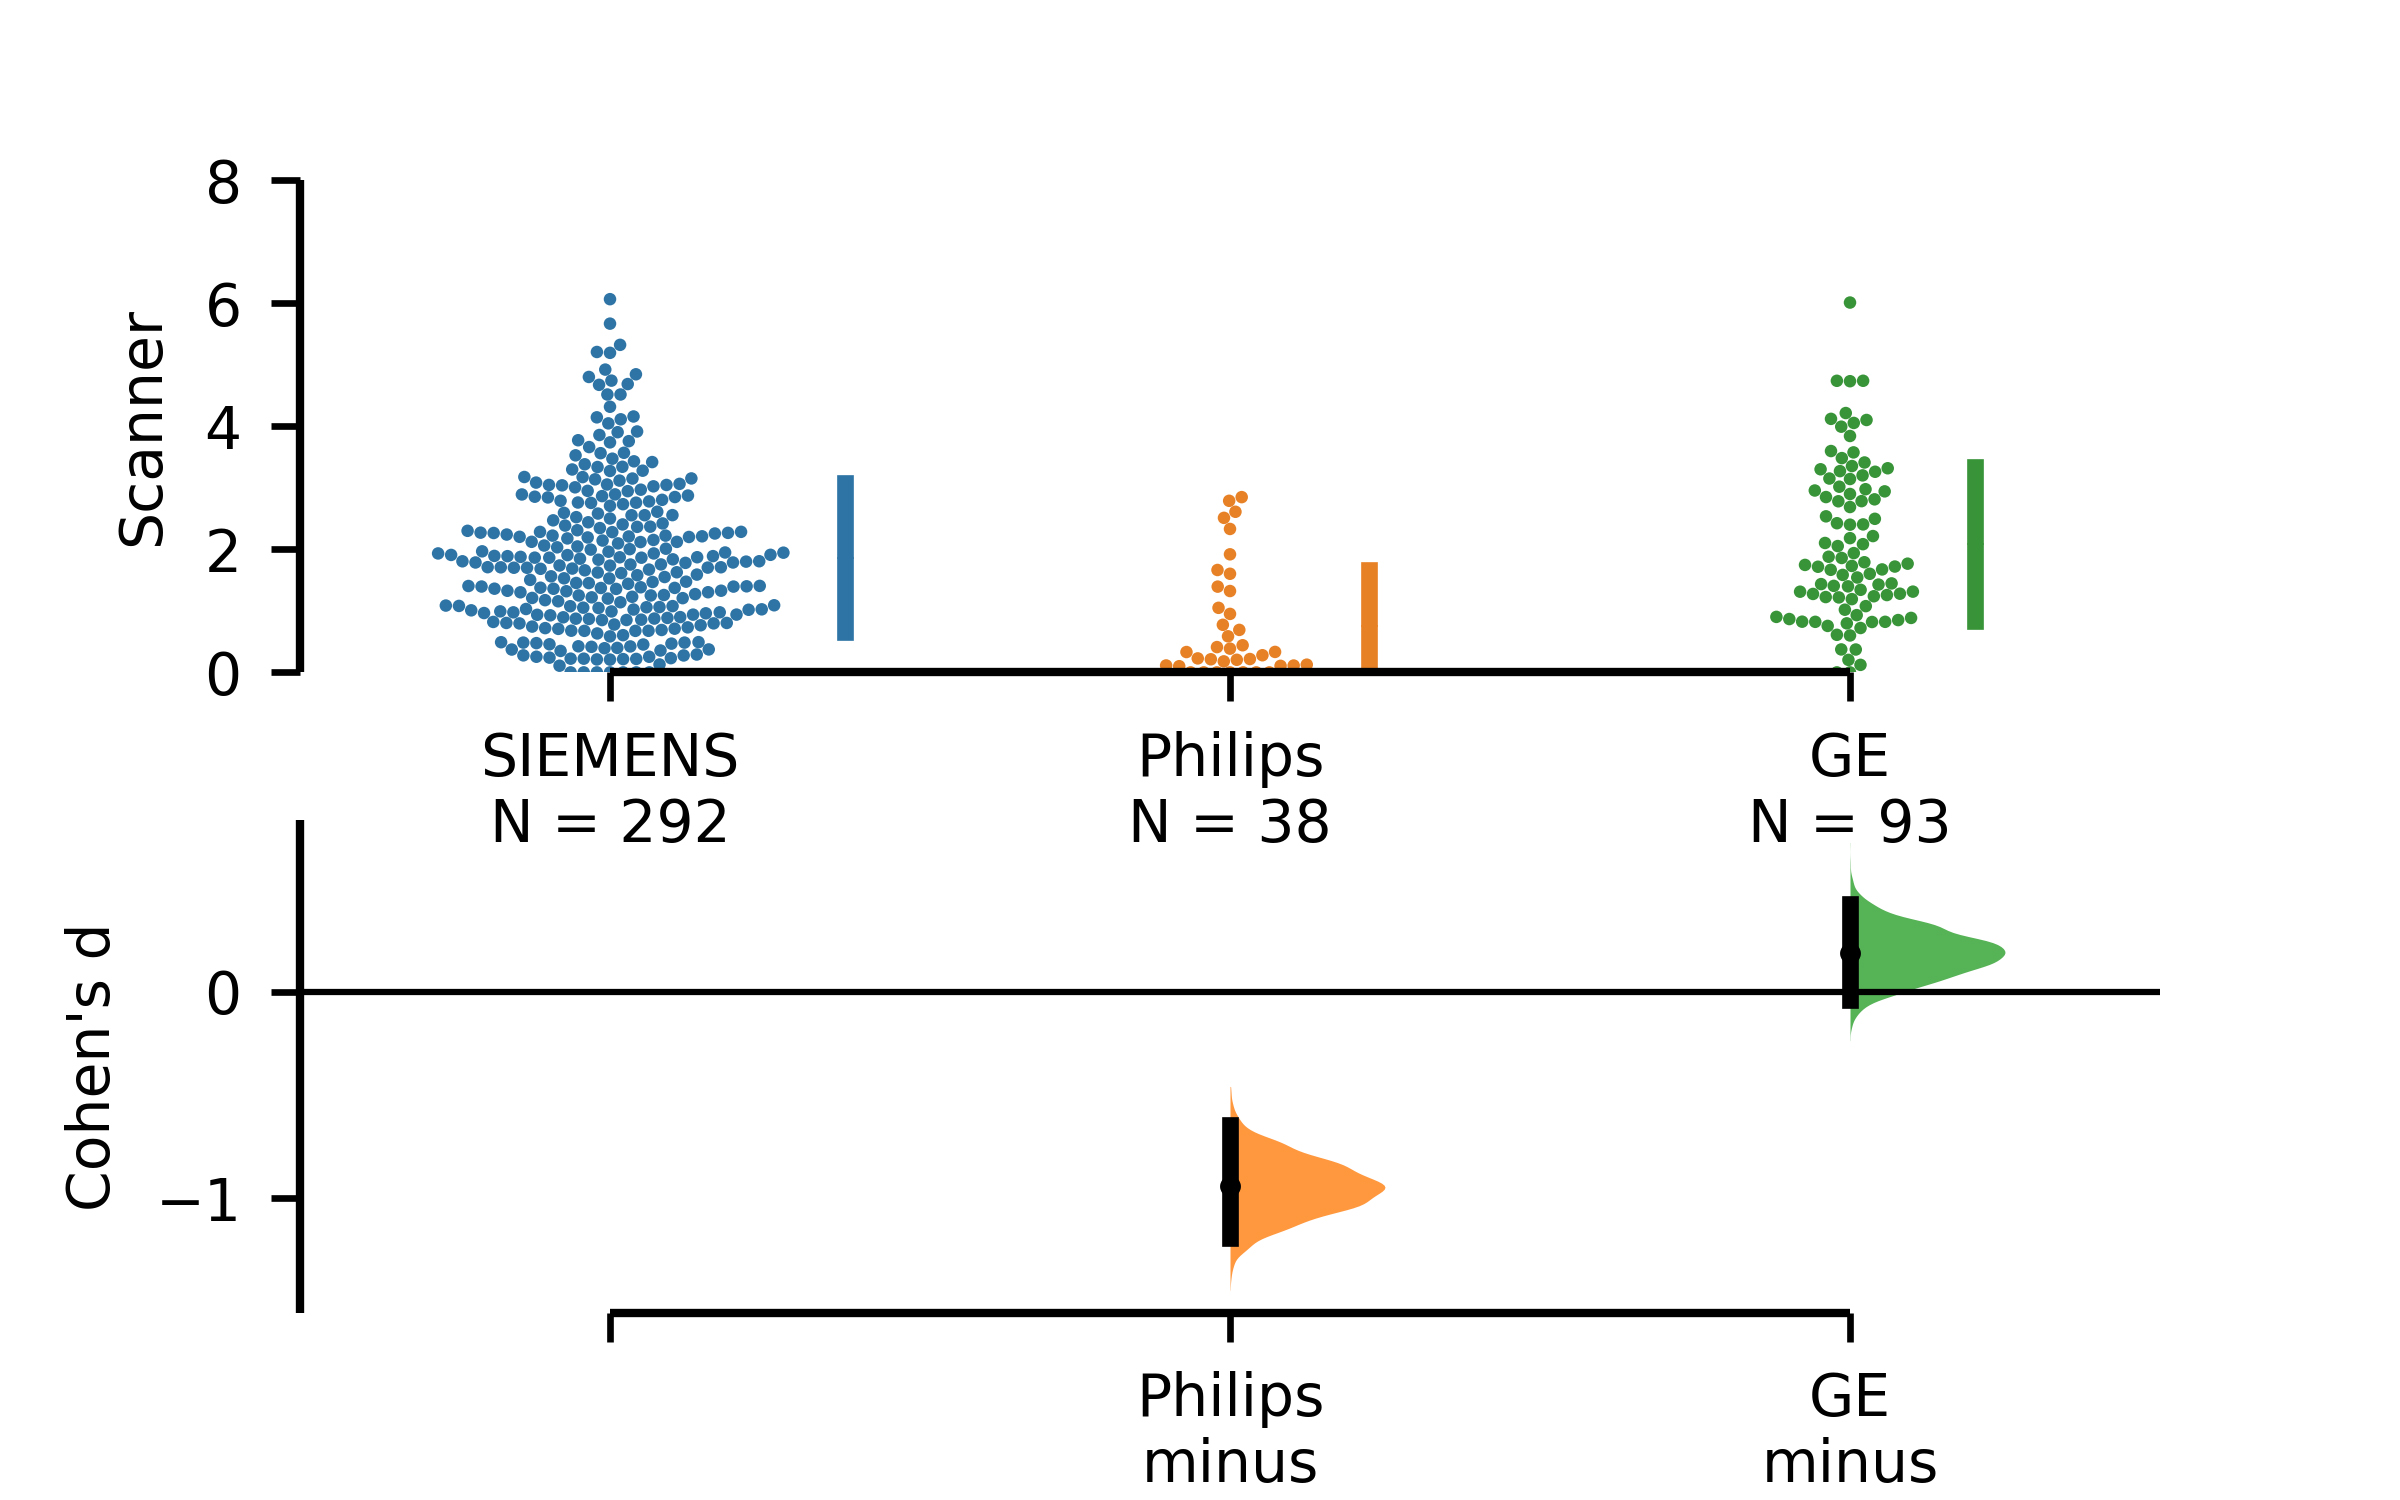
Figure 3. PVS measures was vendor-dependent, in which PVS was underestimated on Philips scanner. No significant difference between PVS measurements from Siemens and GE was observed. Volume of PVS was estimated to be significantly lower in Philips scanner (p<0.01), with Cohen’d = -0.9.