1679
Mesoscopic imaging of perivascular spaces at 7T
Farshid Sepehrband1, Samantha Ma2, Jeiran Choupan2, Sook-Lei Liew2, and Arthur W Toga2
1Stevens Neuroimaging and Informatics Institute, Keck School of Medicine, USC, Los Angeles, CA, United States, 2USC, Los Angeles, CA, United States
1Stevens Neuroimaging and Informatics Institute, Keck School of Medicine, USC, Los Angeles, CA, United States, 2USC, Los Angeles, CA, United States
Synopsis
Imaging of the perivascular spaces (PVS) is of growing interest, especially due to its involvement in brain clearance and blood-brain barrier exchange [1]–[3]. PVS mapping is often limited to macroscopic PVS (>1mm), which limits the study of subtle morphological PVS alteration that is expected to occur in submillimeter resolution. Here we show the advantage of ultra-high field imaging for detailed quantification of PVS in vivoand noninvasively.
Introduction
The clinical approach to assess PVS and its pathological variation is based on visual reading and counting of visible PVS on T2 weighted MR images. Recent imaging advancements, such as high resolution structural imaging with MPRAGE and T2 SPACE, have made 3D mapping of PVS possible [4]. However, these techniques are limited to macroscopic PVS mapping (>1mm in caliber). Here we applied a flow compensated high-resolution T2 SPACE sequence at 7 Tesla and mapped PVS in unprecedented detail which elucidates morphological and distribution features of the PVS at mesoscale. The derived map aids in better modeling of PVS and its quantitative characteristics. It also highlights the significant presence of PVS throughout the brain.Method
Image acquisition was performed using a 7T Terra whole-body MR system [Magnetom Terra, Siemens Healthcare, Erlangen, Germany], equipped with 8-channel pTx array capability [Nova Medical, Inc., Wilmington, MA] to image a healthy 26-years-old male volunteer. The institutional review board of the insatiate approved the study. Informed consent was obtained from the volunteer, and the image datasets were anonymized. First-level controlled SAR mode was employed for 3D structural imaging sequences to ensure FDA guidelines (3.2W/kg on head) were met. A high resolution Sagittal T2-weighted SPACE image was acquired with 0.32 x 0.32 x 0.4 mm resolution, interpolated to 0.16 x 0.16 x 0.4mm, which enabled the identification of parts of the white matter vasculatures. To enable timely acquisition, a sagittal slab ~8cm was acquired, covering a large portion of the white matter centrum semi-ovale. The following parameters were used: GRAPPA=3, TR/TE=2320/299ms, flip angle=120, 2 averages, scan time 24min. Commercially available patient-specific shimming for the parallel transmit coil array was used to enhance B1+ homogeneity, which is often affected when using the single transmit head coil at ultra-high fields. To mitigate the accentuated CSF pulsation artifact, flow compensation was applied. Additional T2 space was acquired as a comparison reference to the high-resolution image. Sagittal T2-weighted SPACE images were acquired with the following parameters: resolution= 0.6mm3isotropic, GRAPPA=3, TR/TE=2140/221ms, scan time ~11min. All visible PVS were carefully and manually segmented across the image. Segmentation was done using ITK-SNAP by a trained specialist. The PVS segmentation, secondary visual inspection, and quality control took a total of 46 hours to complete. Morphological characteristics of the PVS was then evaluated.Results
A total of 1814 PVS were segmented on the high resolution T2 SPACE image. Note that the superficial part of the white matter centrum semi-ovale was not even included in the acquisition, which in fact contains a large amount of visible PVS surrounding the penetrating arteries and veins. Figure1 and 2highlight the dominant presence of PVS across the white matter, many of which are too small PVS to be captured by conventional low-resolution MRI. PVS mesoscopic structure and morphometric characteristics were captured at high resolution. Figure 3represents the distribution of PVS caliber and solidity. The mean PVS caliber of 0.88 highlights the importance of high-resolution imaging for PVS quantification. However, at low resolution, the partial volume effect of PVS with sub-millimeter caliber could lead to biased overestimation of PVS caliber (Figure 4). The high-resolution imaging was also able to capture a wide range of solidity across PVS, which could be used as a marker of vulnerability to trauma or neurodegeneration. Both PVS and solidity were overestimated when conventional T2 SPACE was used.Acknowledgements
This work was supported by NIH grants: 2P41EB015922-21, 1P01AG052350-01 and USC ADRC 5P50AG005142 and R01NS100973. The content is solely the responsibility of the authors and does not necessarily represent the official views of the NIH.References
[1] H. Mestre, S. Kostrikov, R. I. Mehta, and M. Nedergaard, “Perivascular spaces, glymphatic dysfunction, and small vessel disease,” Clin. Sci., vol. 131, no. 17, pp. 2257–2274, 2017.[2] A. Bacyinski, M. Xu, W. Wang, and J. Hu, “The Paravascular Pathway for Brain Waste Clearance: Current Understanding, Significance and Controversy.,” Front. Neuroanat., vol. 11, p. 101, 2017.[3] D. A. Nation et al., “Blood–brain barrier breakdown is an early biomarker of human cognitive dysfunction,” Nat. Med., vol. 25, no. 2, pp. 270–276, Feb. 2019.[4] F. Sepehrband et al., “Image processing approaches to enhance perivascular space visibility and quantification using MRI,” Sci. Rep., vol. 9, p. 12351, Aug. 2019.Figures
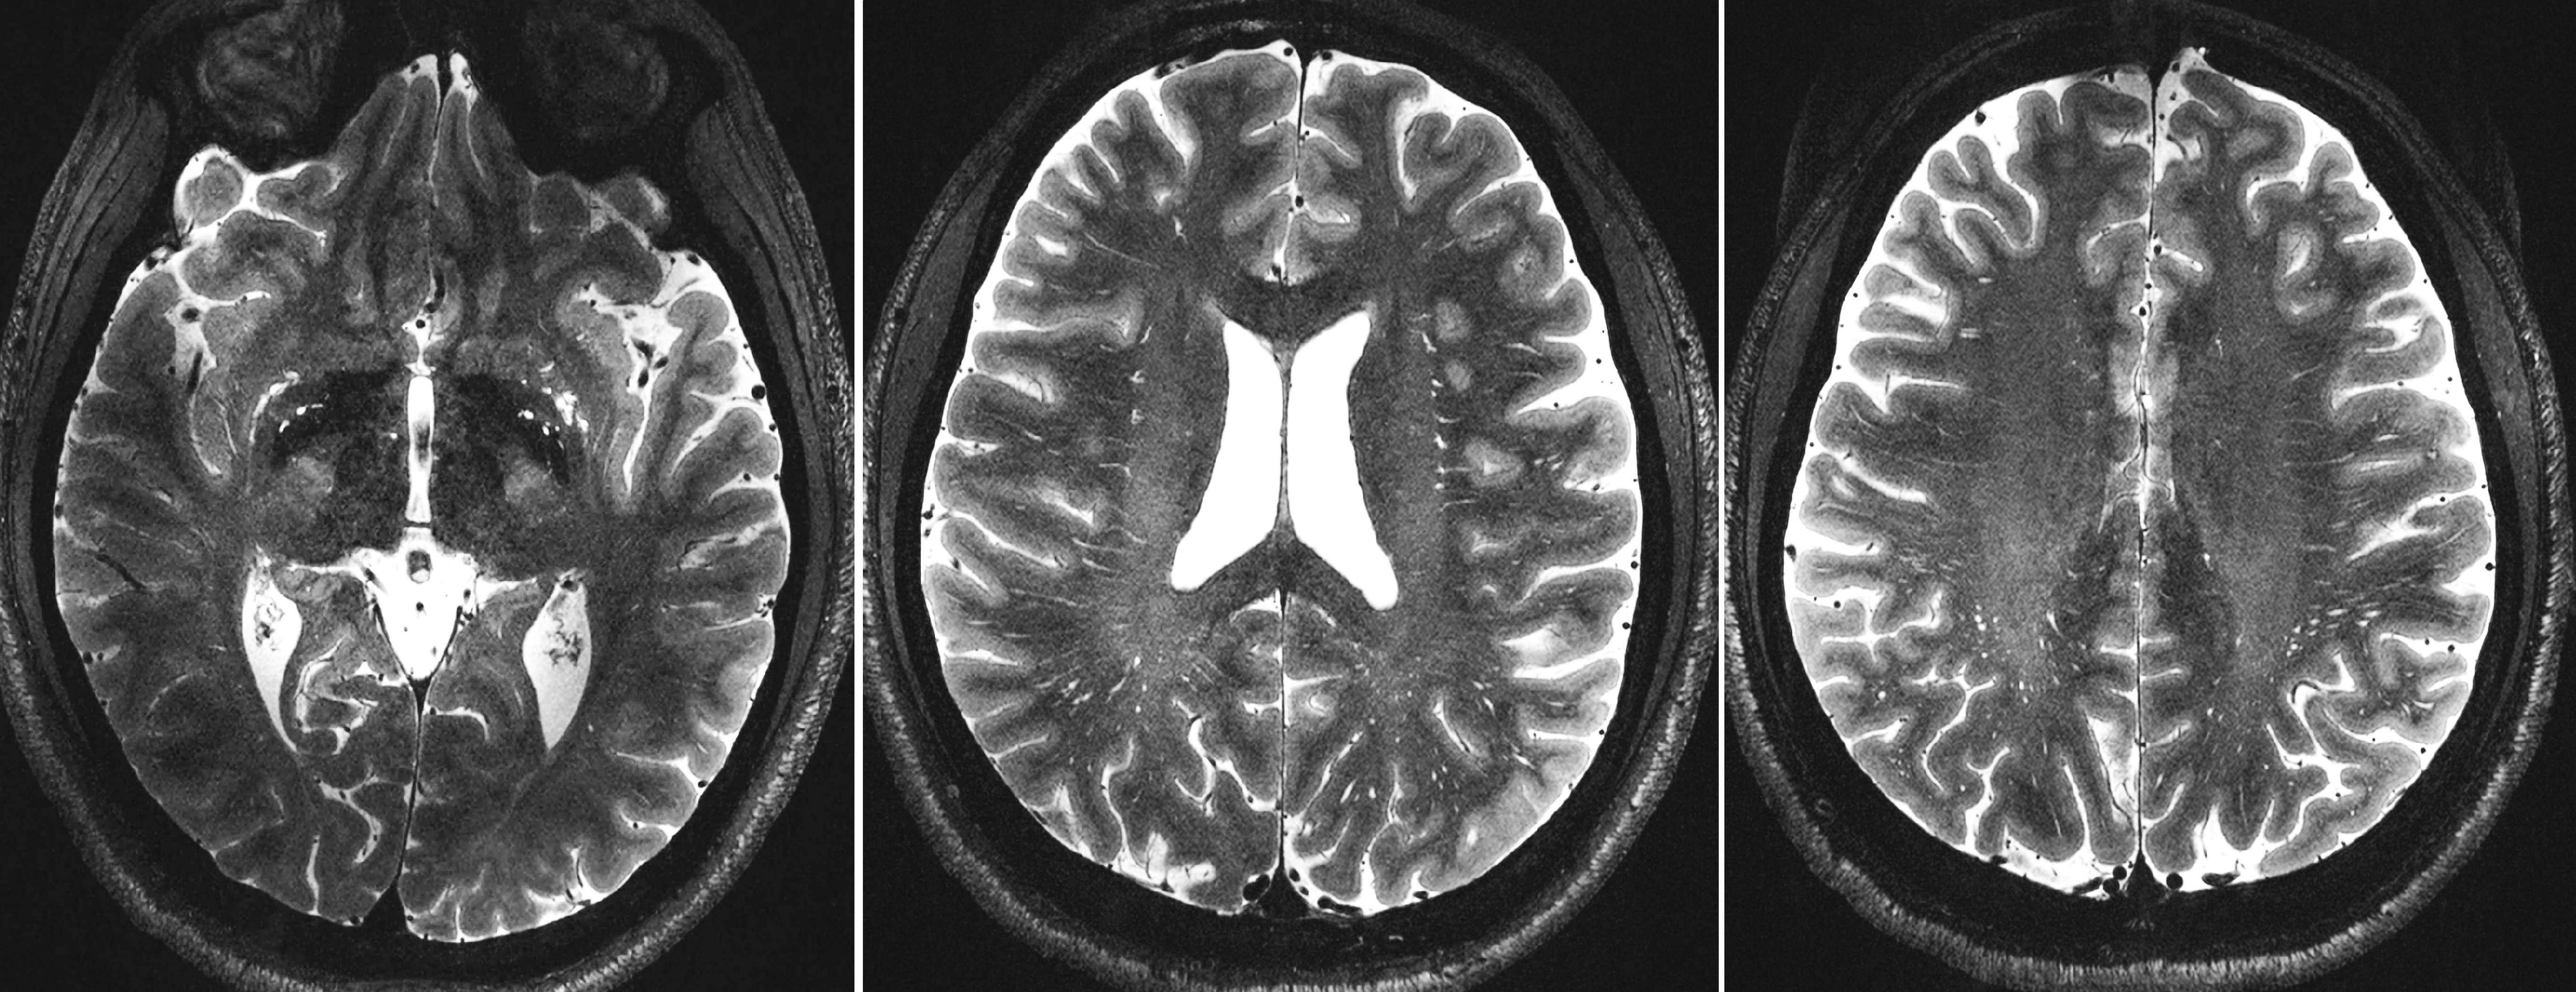
Figure 1. Axial images of the high resolution T2 SPACE at 7T. Images were acquired at 0.16x0.16x0.4 using flow compensated T2 SPACE sequence at 7T (scan time = 24 min).
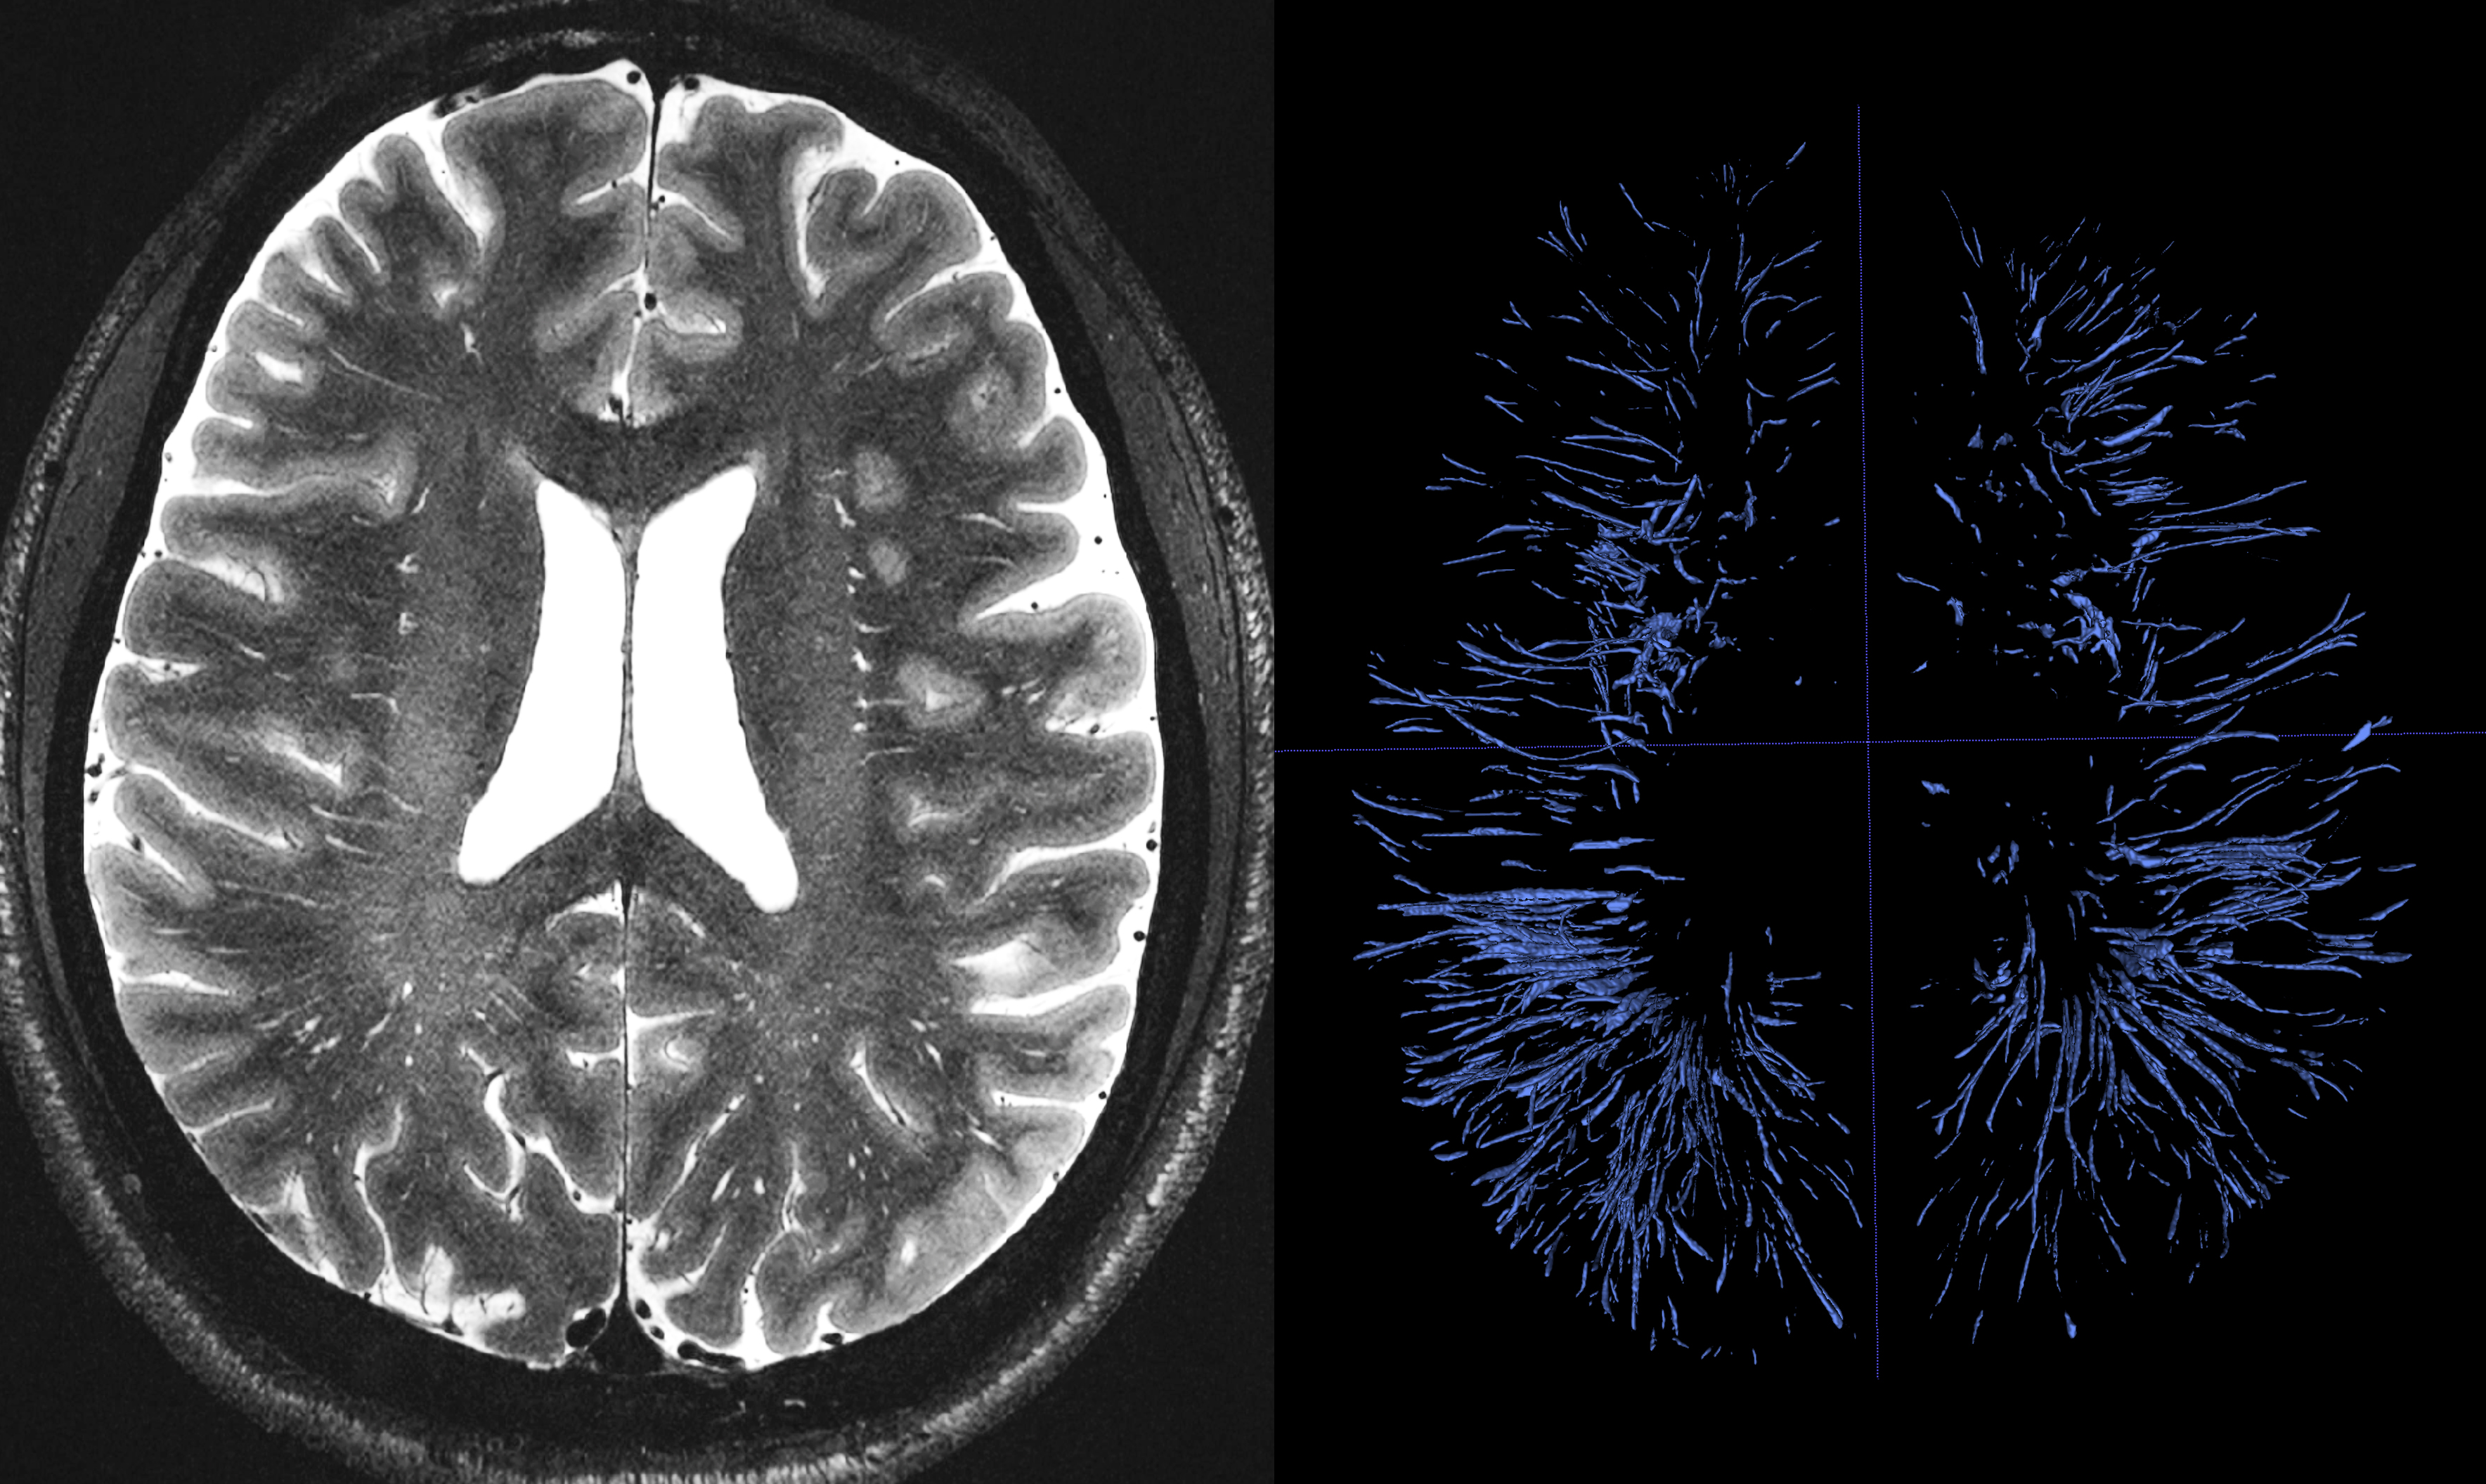
Figure 2. Manual segmentation of 1814 PVS across a sub-portion of the white matter.
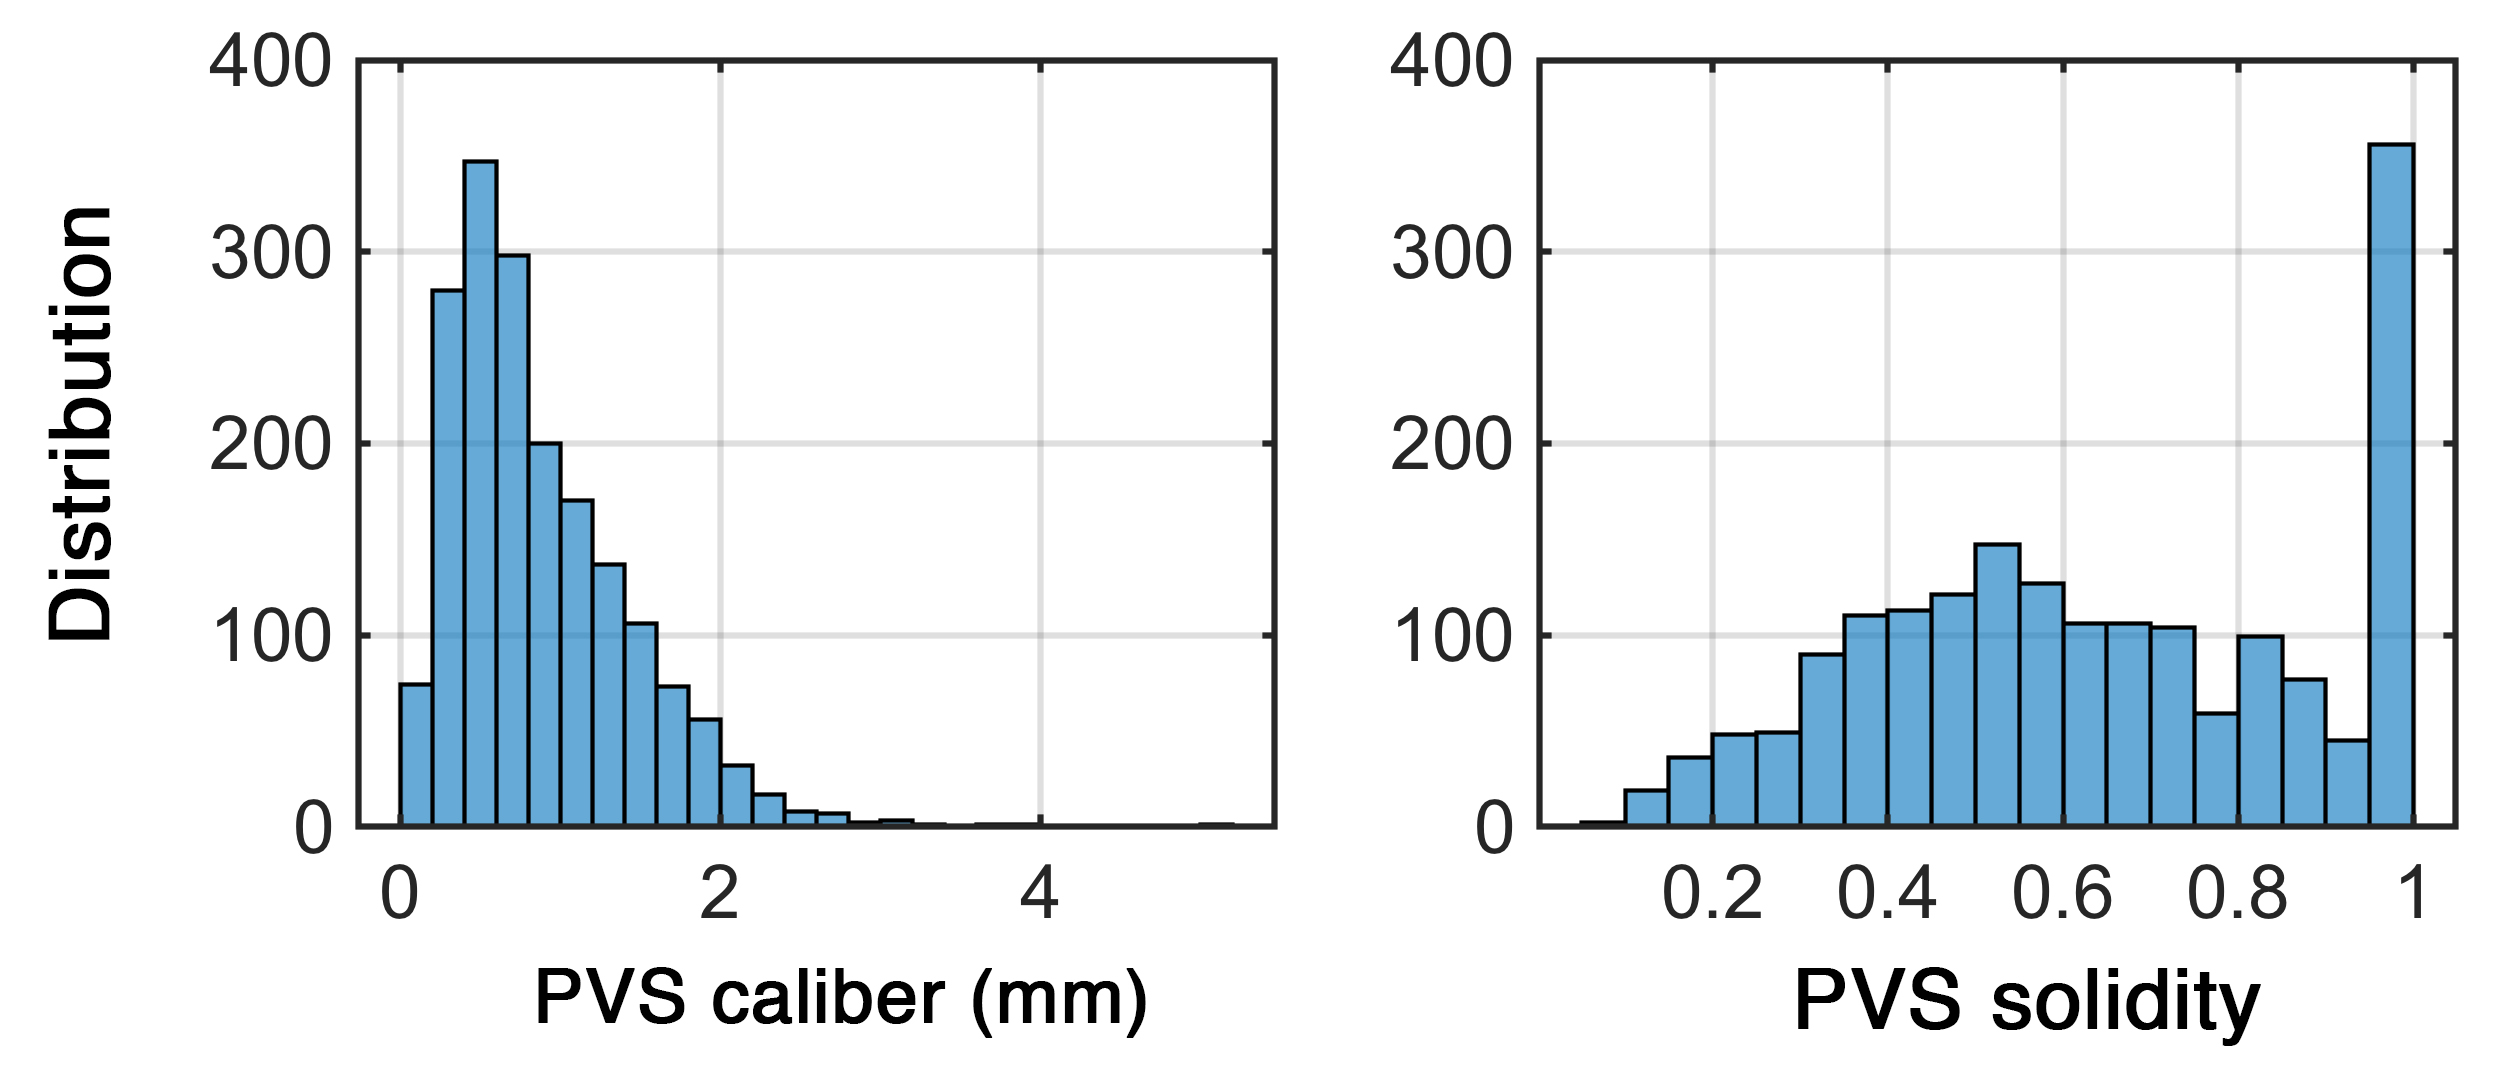
Figure 3. PVS caliber and solidity, derived from high resolution T2 SPACE and manual segmentation. Mesoscopic characteristics were captured at high resolution.
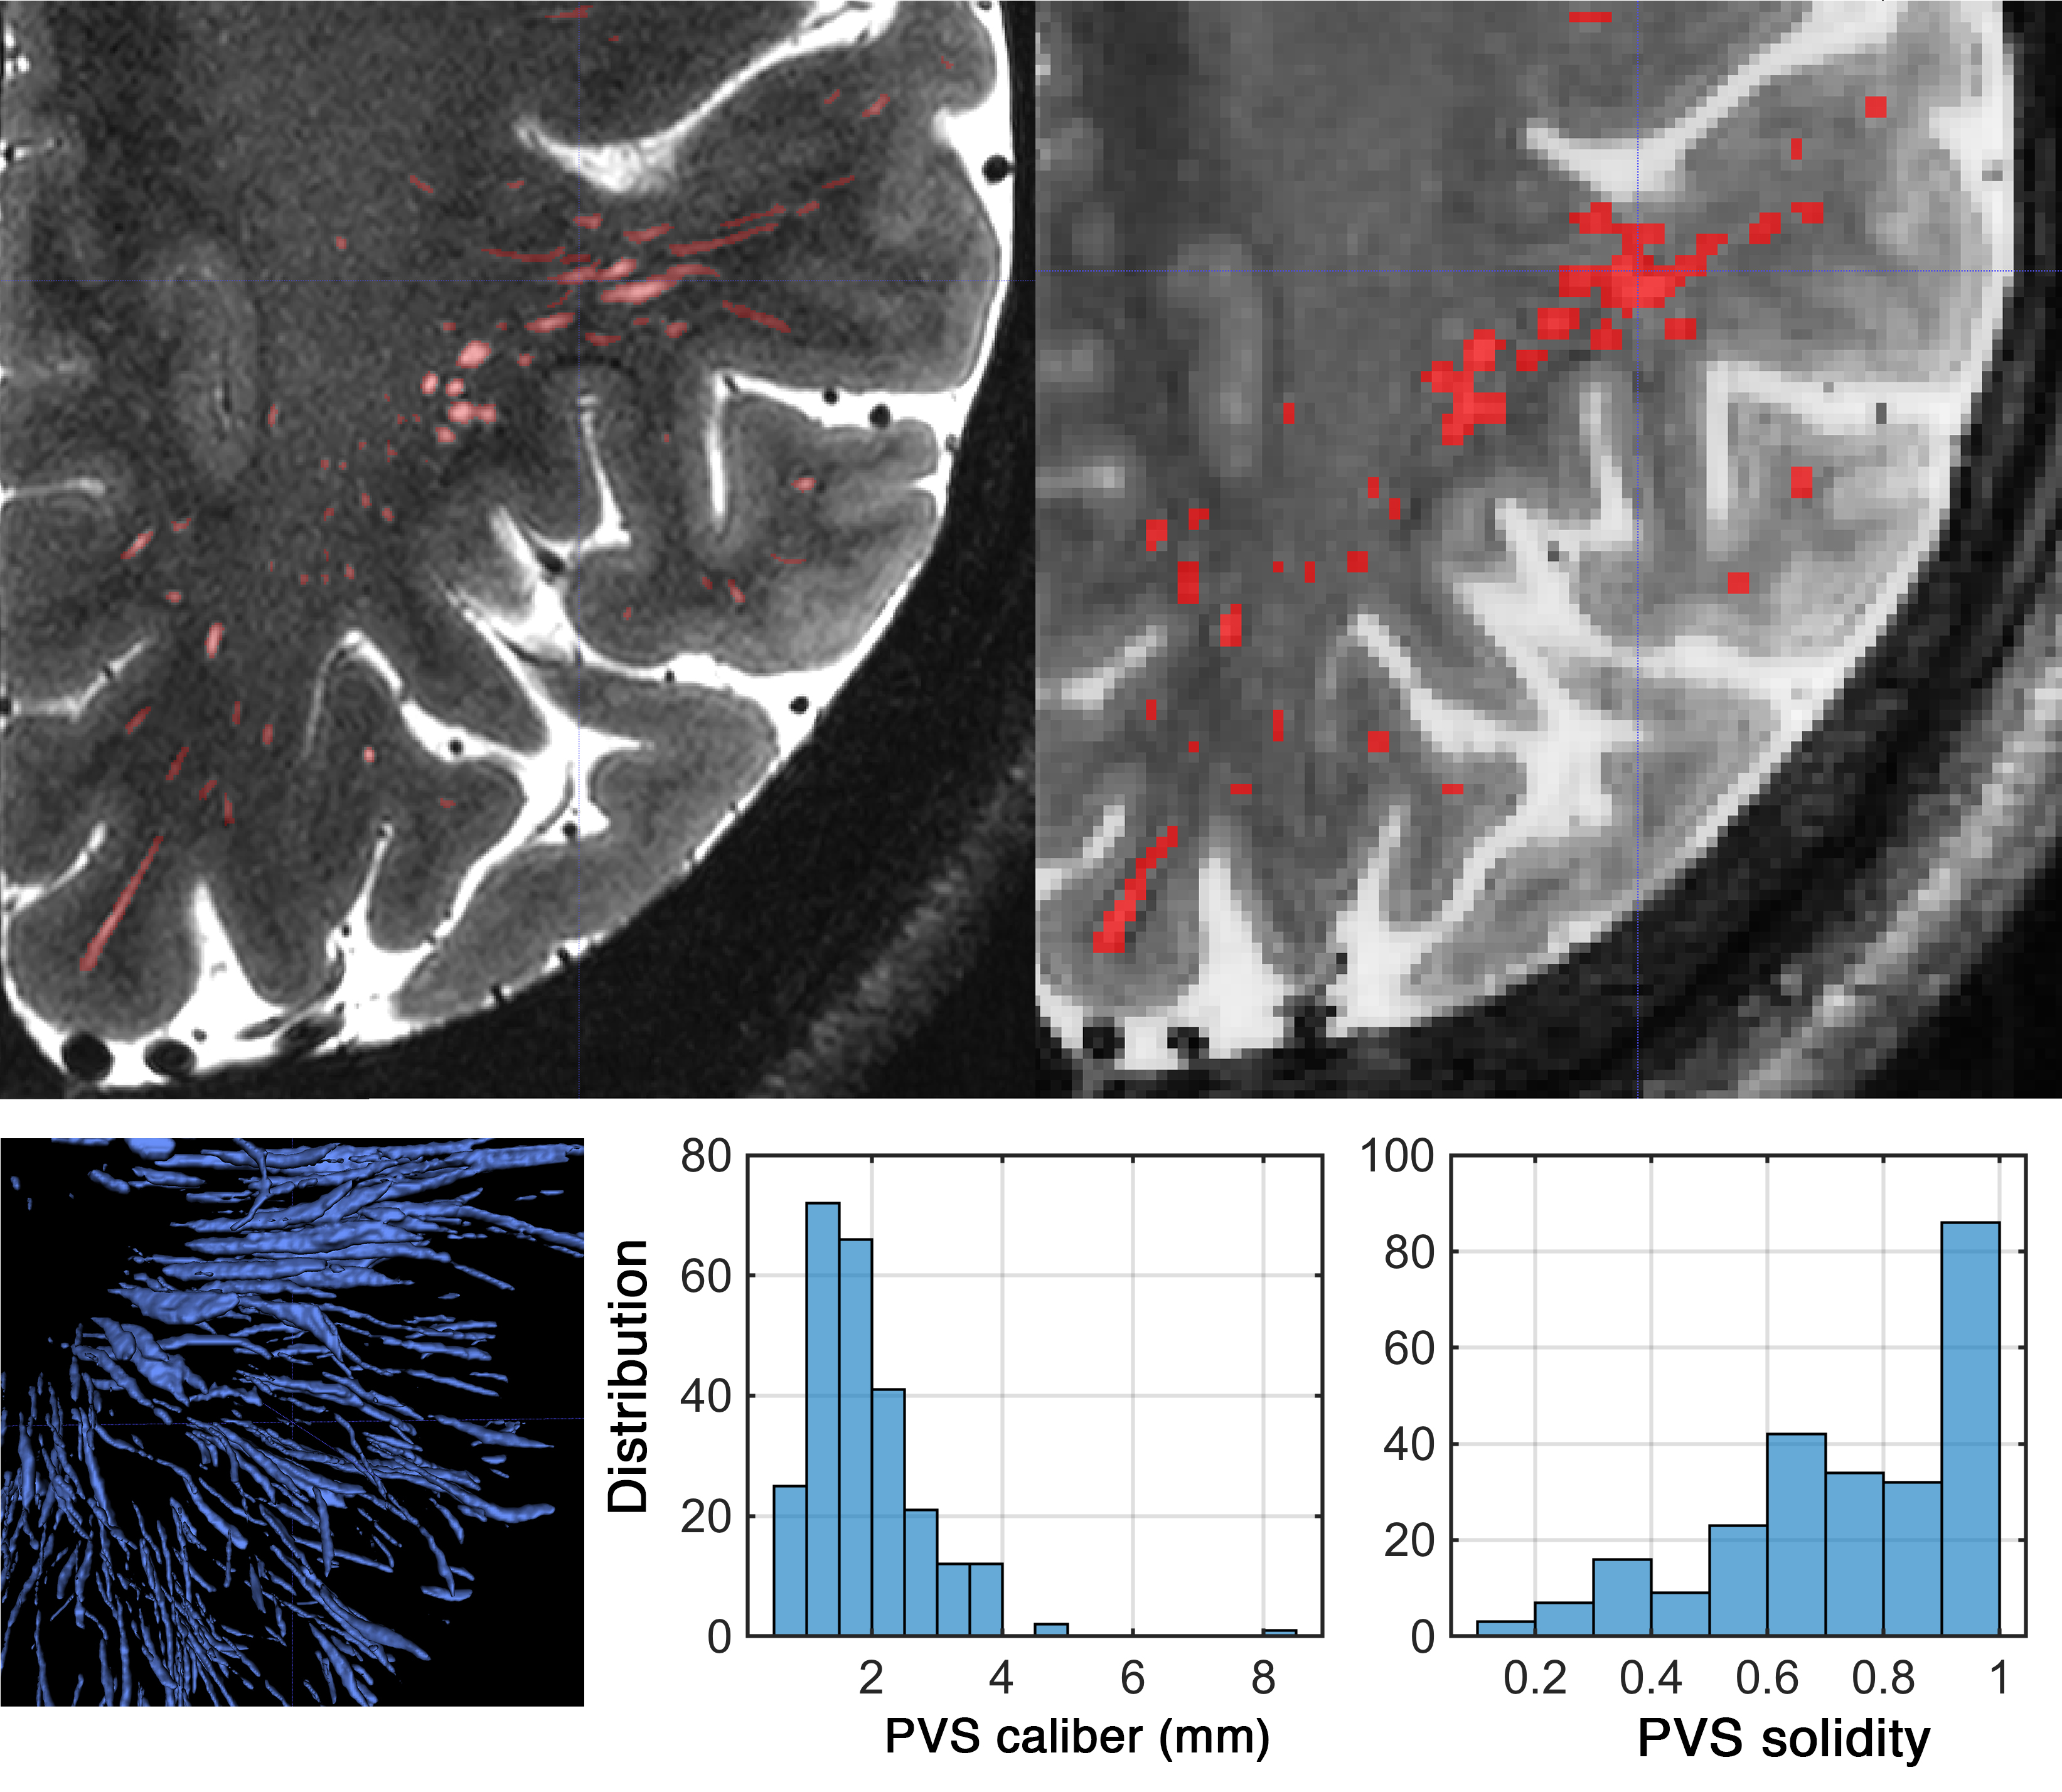
Figure 4. PVS map at high resolution (top left: 0.16x0.16x0.4mm) and moderate resolution (top right: 0.6mm3). PVS characteristics were overestimated when 0.6 mm3resolution image was used.