1678
Continuous Golden-Angle Spiral Acquisition as a Flexible Tool for Studying CSF Flow Dynamics
Daniel D Borup1, Sandeep K Ganji2, Petrice Mostardi Cogswell1, and James G Pipe1
1Radiology, Mayo Clinic, Rochester, MN, United States, 2Philips Healthcare, Gainesville, FL, United States
1Radiology, Mayo Clinic, Rochester, MN, United States, 2Philips Healthcare, Gainesville, FL, United States
Synopsis
The use of a 2D golden-angle spiral trajectory is demonstrated for the measurement of CSF flow at the cerebral aqueduct and foramen magnum. The results compare favorably with a standard cardiac-gated Cartesian scan when retrospectively binned using the cardiac waveform. The spiral data also show variation in the CSF flow waveforms across the respiratory cycle and can be reconstructed as a time-resolved image series for spectral analysis of the flow dynamics.
Introduction
The dynamics of cerebrospinal fluid (CSF) flow are of interest for their potential relevance to a range of disorders. In addition to a strong cardiac-induced pulsatility, recent studies have shown that CSF flow has a significant respiratory component that varies with breathing pattern1,2. Golden-angle spiral trajectories offer a reconstruction flexibility3,4 that is well suited to investigating the multi-frequency dynamics of CSF flow. The aim of this work is to demonstrate the measurement and analysis of 2D, through-plane CSF flow measurements using a spiral readout trajectory with golden angle (111.246°) arm incrementation.Methods
CSF phase contrast images were collected in three healthy volunteers on a 3T Elition scanner (Philips Healthcare, Netherlands). Data were obtained at the foramen magnum (VENC = 5 cm/s) and aqueduct (10 cm/s). All sequences had a flip angle of α = 15 degrees, 3 mm slice thickness, and 21.7 cm field of view with ~1.25 mm in-plane resolution. Three k-space trajectories were employed:- Cartesian with retrospective cardiac gating (TE/TR = 8.3/11.9 ms), typical for a clinical exam
- Single-shot EPI (TE/TR = 39/150 ms, in-plane SENSE factor 3, 1:48 dynamic series)
- Continuous golden-angle spiral (TE/TR = 6.5/17.5 ms, readout dur. τ = 7 ms, 1:48 acquisition time)
For comparison to EPI, time-resolved images were generated by selecting spiral arms using a sliding window that advanced Δt = 70 ms from image to image. Two sliding window types were compared: one with 21 sequential arms and a Gaussian weighting scheme applied during gridding to preferentially weight the central arms6, and a second with 5 preferentially weighted sequential arms added to the full data set from the same cardiac phase.
Results
Figure 2 shows a comparison of the cardiac-synchronized CSF flow waveforms for regions of interest (ROIs) defined in the aqueduct and foramen magnum of one subject. The waveforms are in good agreement, although the spiral data appear to underestimate the strength of the downward pulse in the aqueduct.Figure 3 shows the effects of respiration on the CSF flux. In the aqueduct, the flux curve is higher at peak inspiration and lower at peak expiration for all cardiac phases, which agrees with previous findings1,2,7. At the foramen magnum the same trend was observed during the cranial-flow phases (positive values), but the flux was relatively unchanged during the caudal flow phases.
Figures 4 and 5 show comparisons of time-resolved imaging using EPI and spiral at the aqueduct and foramen magnum, respectively. The top row shows the power spectra from the cardiac and respiratory signals as a reference (scaling between the two curves is arbitrary). Several respiratory peaks appear from 0.1–0.4 Hz, while there are distinct cardiac peaks at ~1.2 Hz (the heart rate) and ~2.4 Hz (the first harmonic). All three spectral peaks have been identified previously in CSF flow7.
The EPI data are shown in the second row. The magnitude images highlight the poor image quality and aliasing present in these scans, which caused difficulty choosing a suitable ROI at the cerebral aqueduct. All three peaks are observed in the CSF flux spectrum at the foramen magnum, but only the first two are observed at the aqueduct due to noise within the small ROI.
The spiral scans yielded significantly improved image quality at both locations for both reconstruction approaches employed. The flow spectrum from the 21-arm reconstruction shows the respiratory and first cardiac peaks, while the harmonic peak at 2.4 Hz is missing due to the long temporal width of the sliding window. Both cardiac peaks are visible in the view sharing reconstruction, but the respiratory peak is visible only in the aqueduct flow data. Because cardiac view sharing uses data from across the full 2-minute scan, the low frequency components from respiration are attenuated in this method.
Discussion and Conclusions
Continuous spiral sampling with golden-angle arm incrementation offers high flexibility in the reconstruction stage. The present results show that this technique can produce similar flow waveforms to Cartesian imaging when averaged across many cardiac cycles, and that the underlying data can be used to demonstrate changes to the flow across the respiratory cycle. Time-resolved reconstructions of the spiral data showed superior image quality versus single-shot EPI and were successfully used to identify the same spectral peaks in the CSF flow waveform.We conclude that golden angle spiral acquisition performs similarly to EPI for time-resolved measurements, with improved image quality coming at the expense of temporal resolution. The key limitation is the number of spiral arms required for spiral reconstruction; in future studies, use of a variable-density spiral trajectory and/or longer readout duration will reduce the number of arms needed, which could allow for improved temporal resolution at similar image quality.
Acknowledgements
Thanks to Guruprasad Krishnamoorthy for assistance with data export for offline reconstruction.References
- Spijkerman JM, Geurts LJ, Siero JC, Hendrikse J, Luijten PR, Zwanenburg JJ. Phase contrast MRI measurements of net cerebrospinal fluid flow through the cerebral aqueduct are confounded by respiration. Journal of Magnetic Resonance Imaging. 2019 Feb;49(2):433-44.
- Yildiz S, Thyagaraj S, Jin N, Zhong X, Heidari Pahlavian S, Martin BA, Loth F, Oshinski J, Sabra KG. Quantifying the influence of respiration and cardiac pulsations on cerebrospinal fluid dynamics using real‐time phase‐contrast MRI. Journal of Magnetic Resonance Imaging. 2017 Aug;46(2):431-9.
- Tolouee A, Alirezaie J, Babyn P. Compressed sensing reconstruction of cardiac cine MRI using golden angle spiral trajectories. Journal of Magnetic Resonance. 2015 Nov 1;260:10-9.
- Kim YC, Narayanan SS, Nayak KS. Flexible retrospective selection of temporal resolution in real‐time speech MRI using a golden‐ratio spiral view order. Magnetic resonance in medicine. 2011 May;65(5):1365-71.
- Zwart NR, Pipe JG. Graphical programming interface: A development environment for MRI methods. Magnetic resonance in medicine. 2015 Nov;74(5):1449-60.
- Johnson KO, Pipe JG, Convolution Kernel Design and Efficient Algorithm for Sampling Density Correction. Magn Reson Med. 2009 Feb;61(2):439-47.
- Daouk J, Bouzerar R, Baledent O. Heart rate and respiration influence on macroscopic blood and CSF flows. Acta radiologica. 2017 Aug;58(8):977-82.
Figures
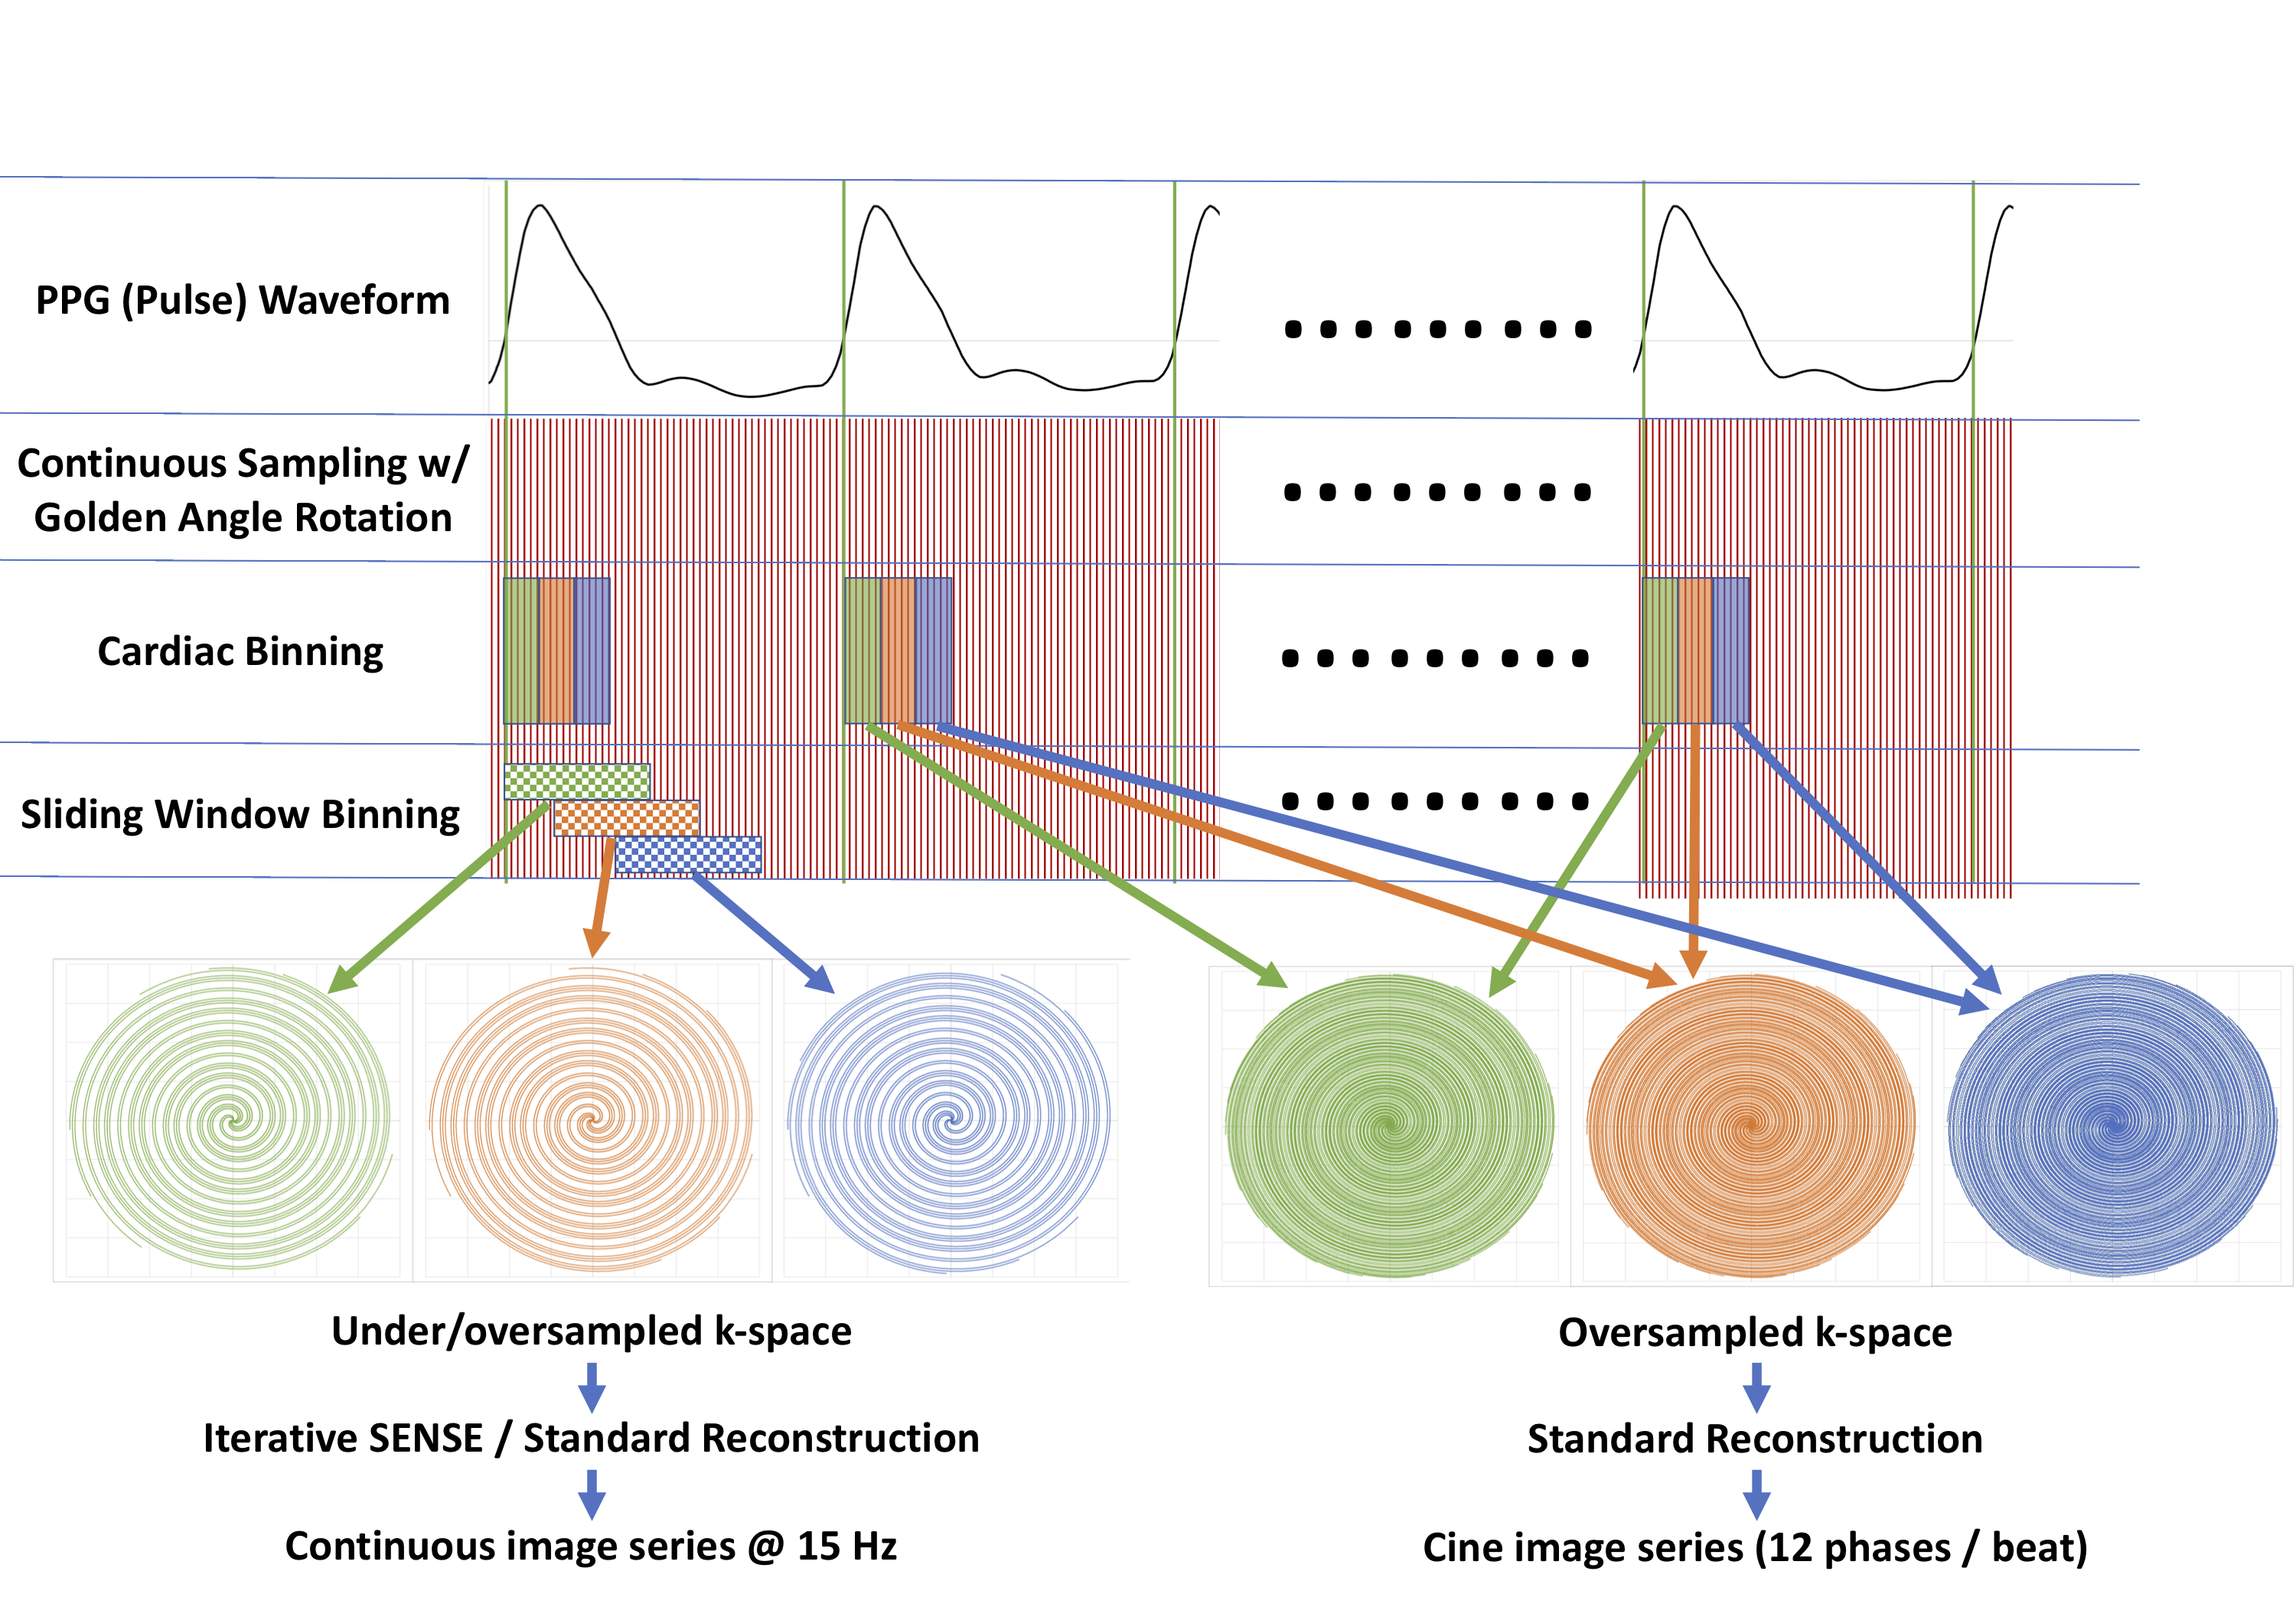
Diagram of two possible reconstruction methods for the
golden-angle spiral data: cardiac binning, where fully-sampled k-space is
obtained using spiral arms from the full scan; and a simple sliding window scheme,
where a smaller number of arms are reconstructed into a time-resolved image.
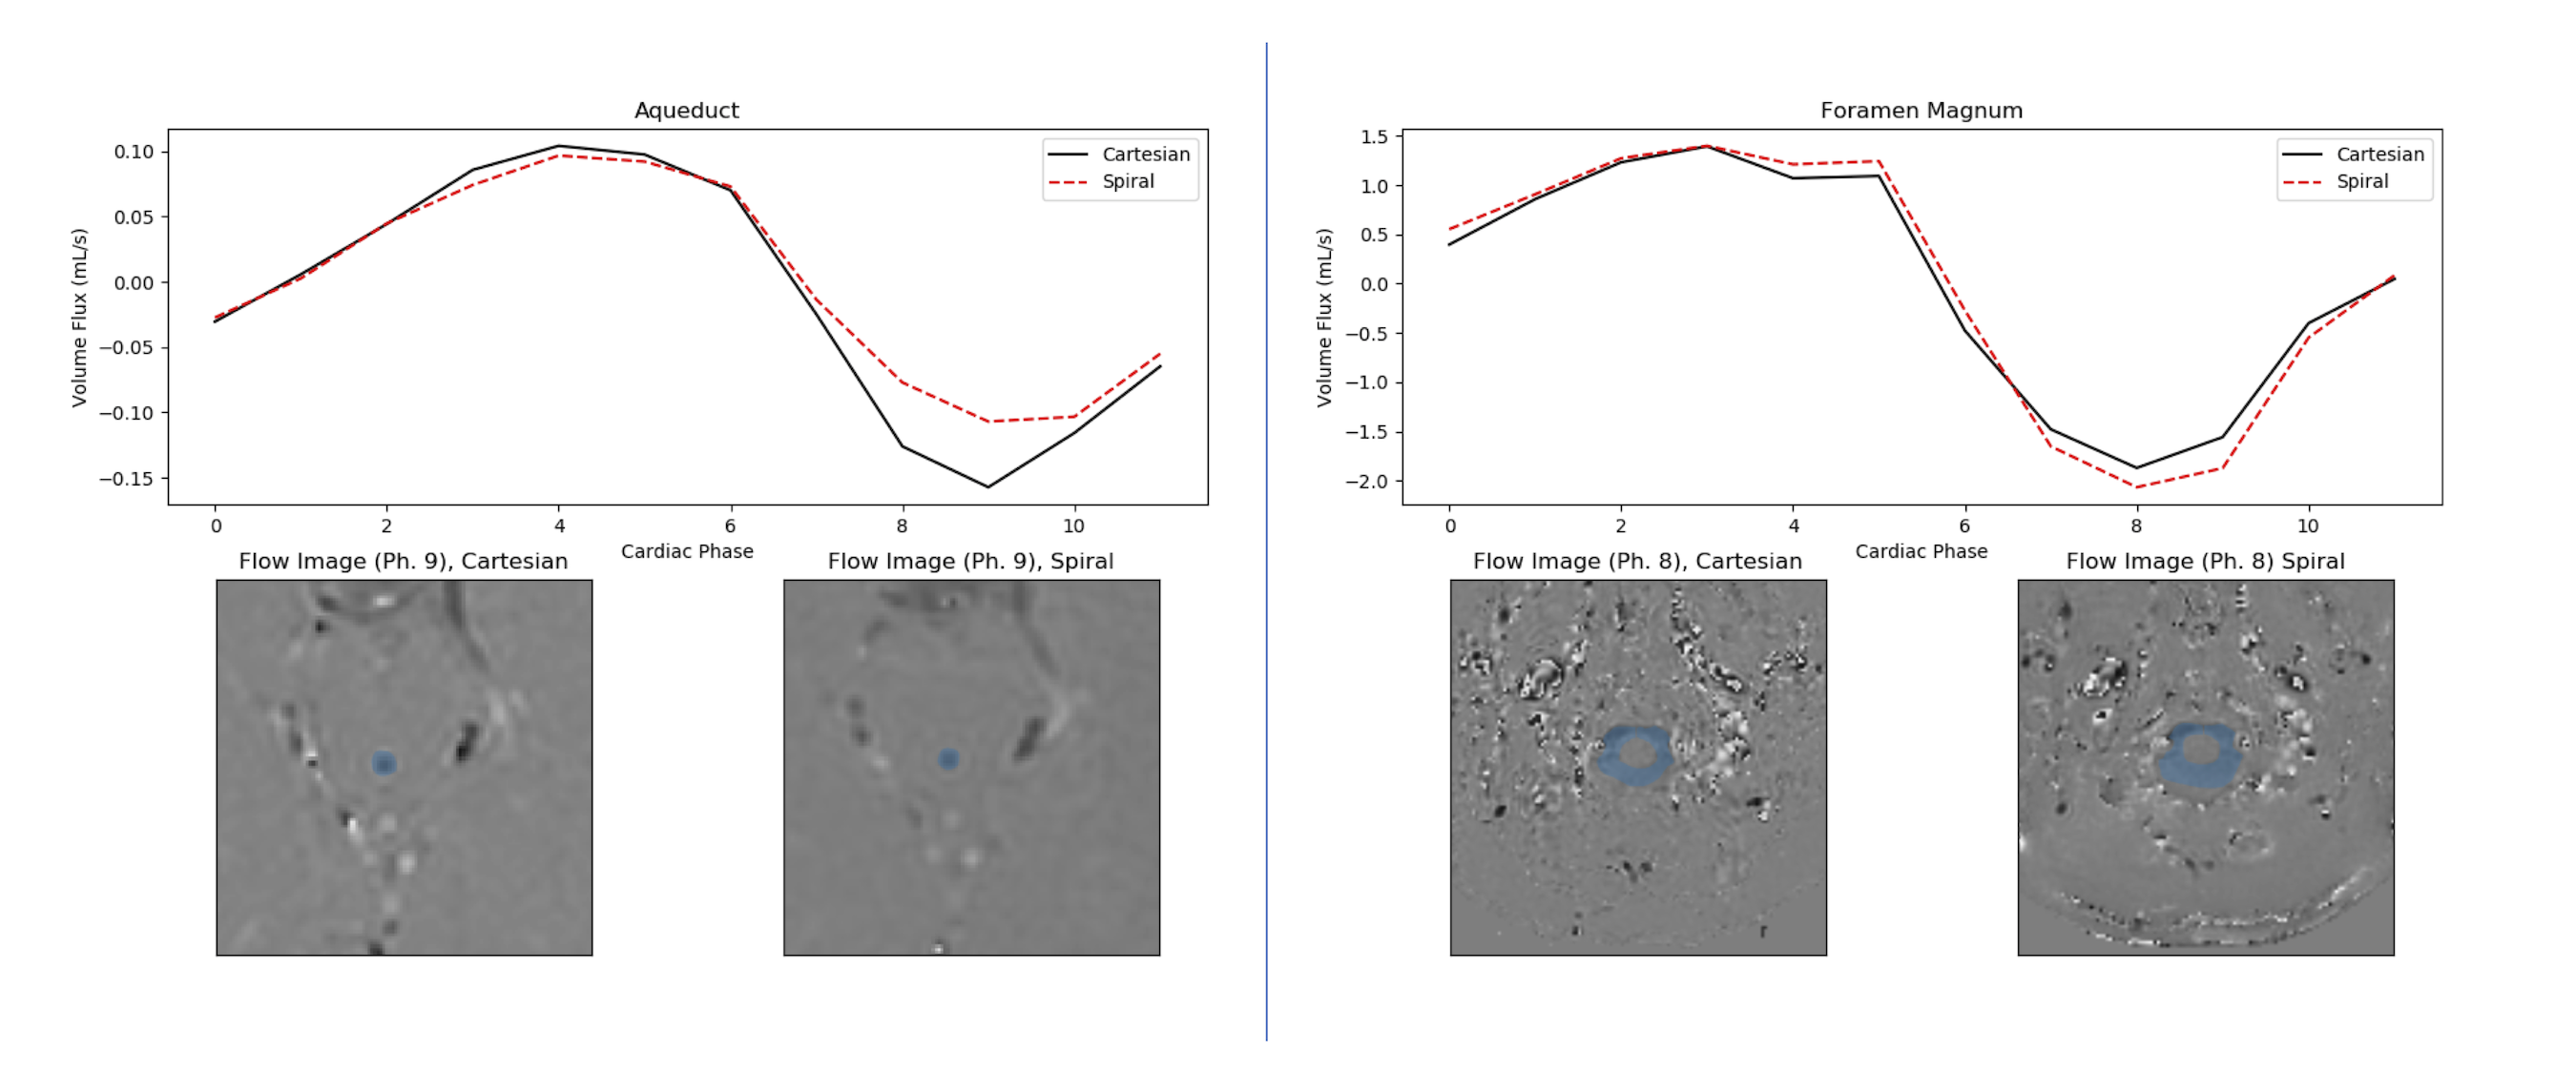
Cardiac-binned flow waveforms through the cerebral aqueduct
(Left) and foramen magnum (Right). Solid curves show data from Cartesian scans, while
dashed curves show retrospectively binned spiral data. The ROI for flux
measurements is overlaid in blue on four example phase-contrast images from the
complete data sets.
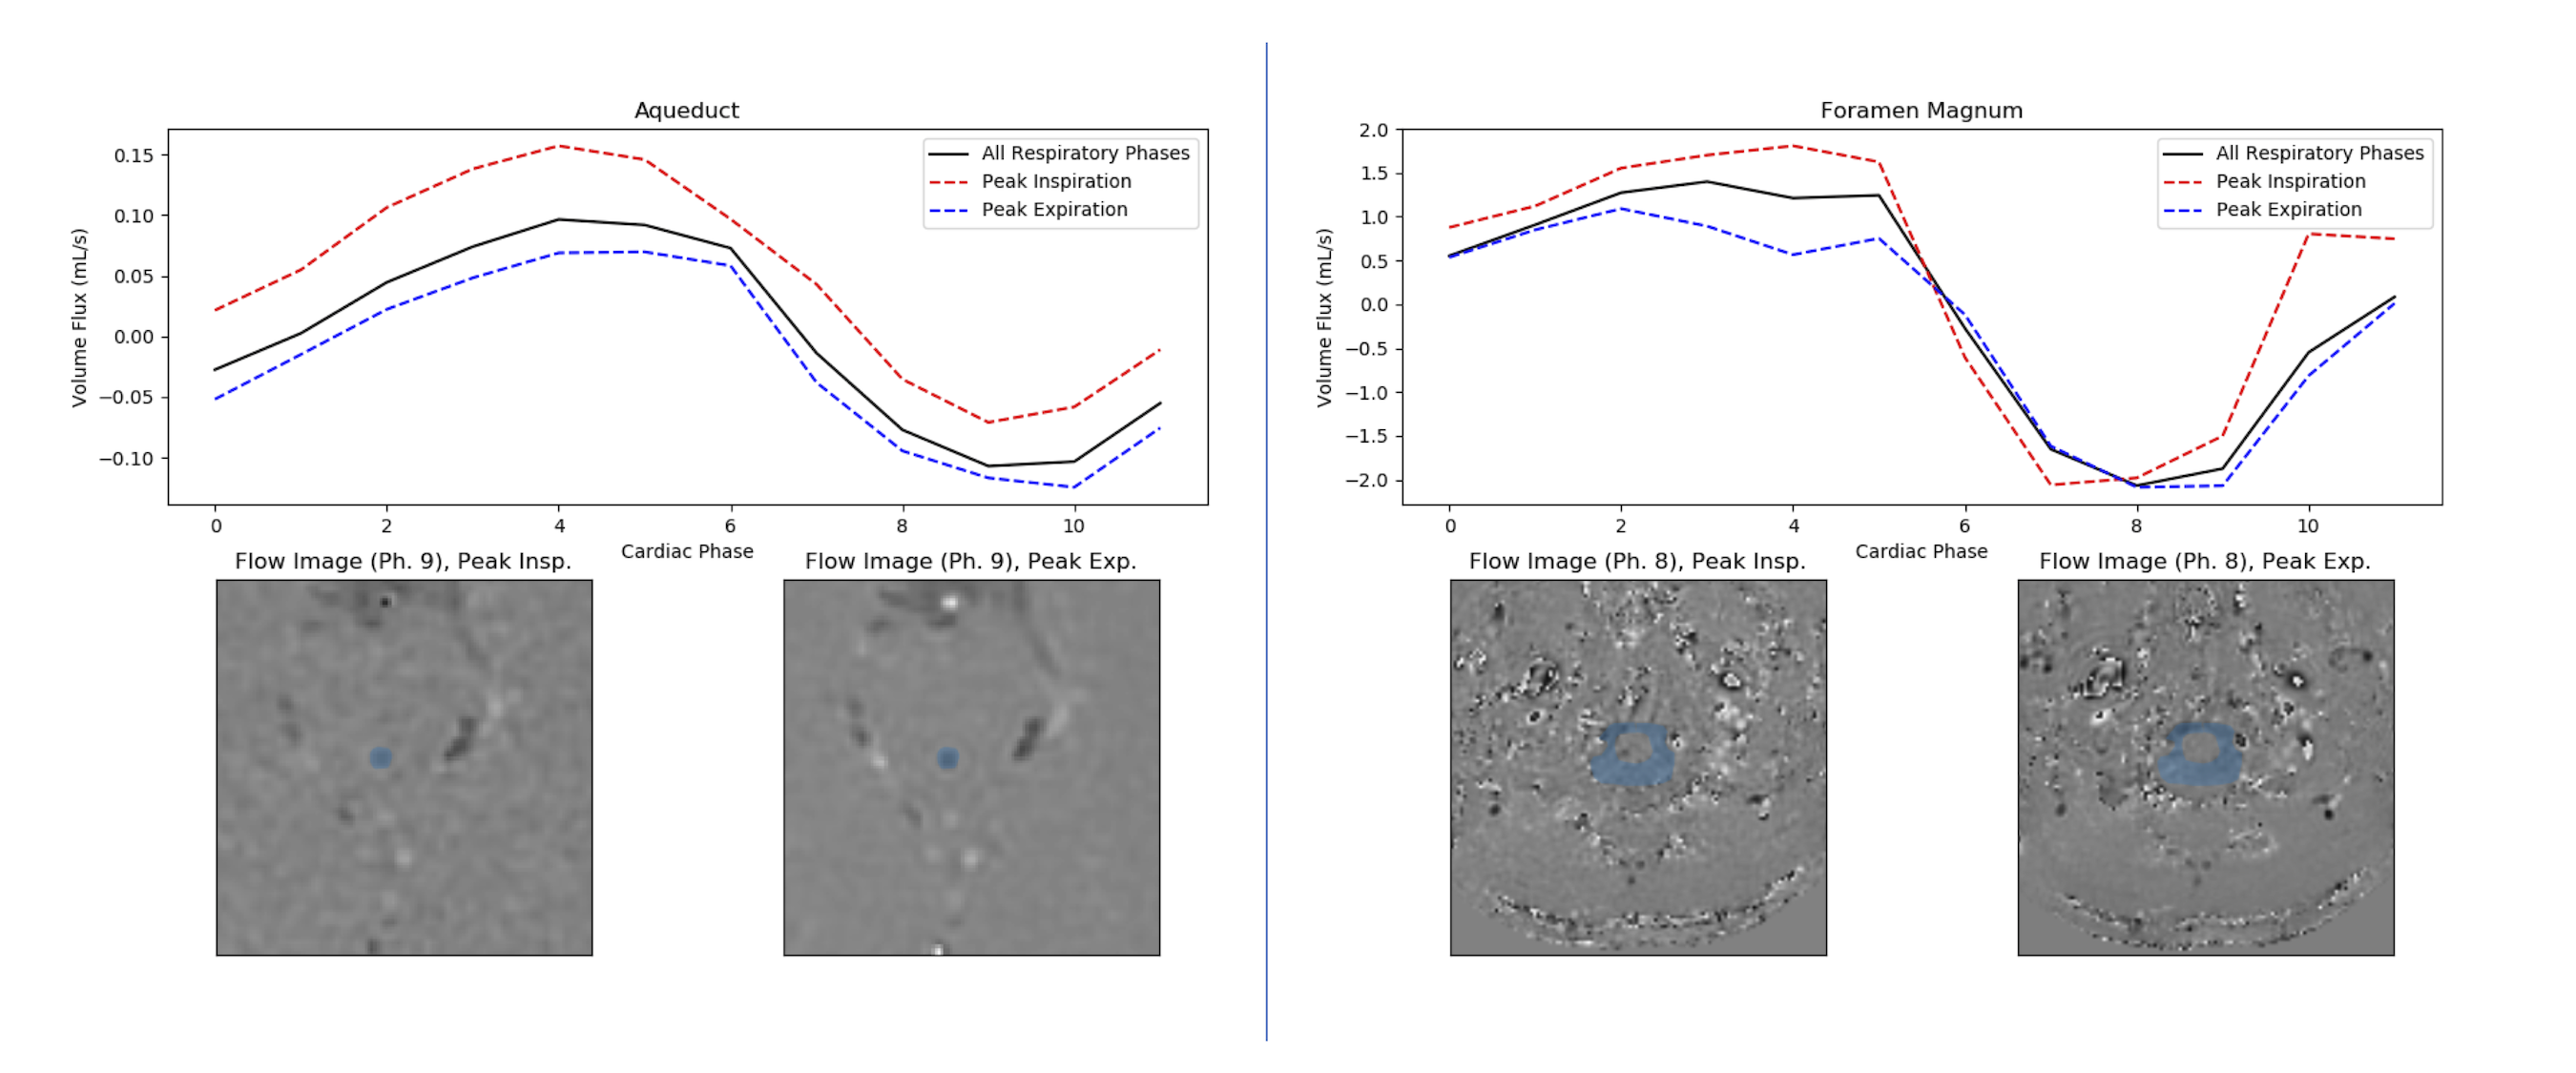
Cardiac CSF flow waveforms from spiral data retrospectively
binned into peak inspiration (red dashed lines) and expiration (blue dashed)
phases. The results are plotted against the average over all respiratory phases
(solid black).
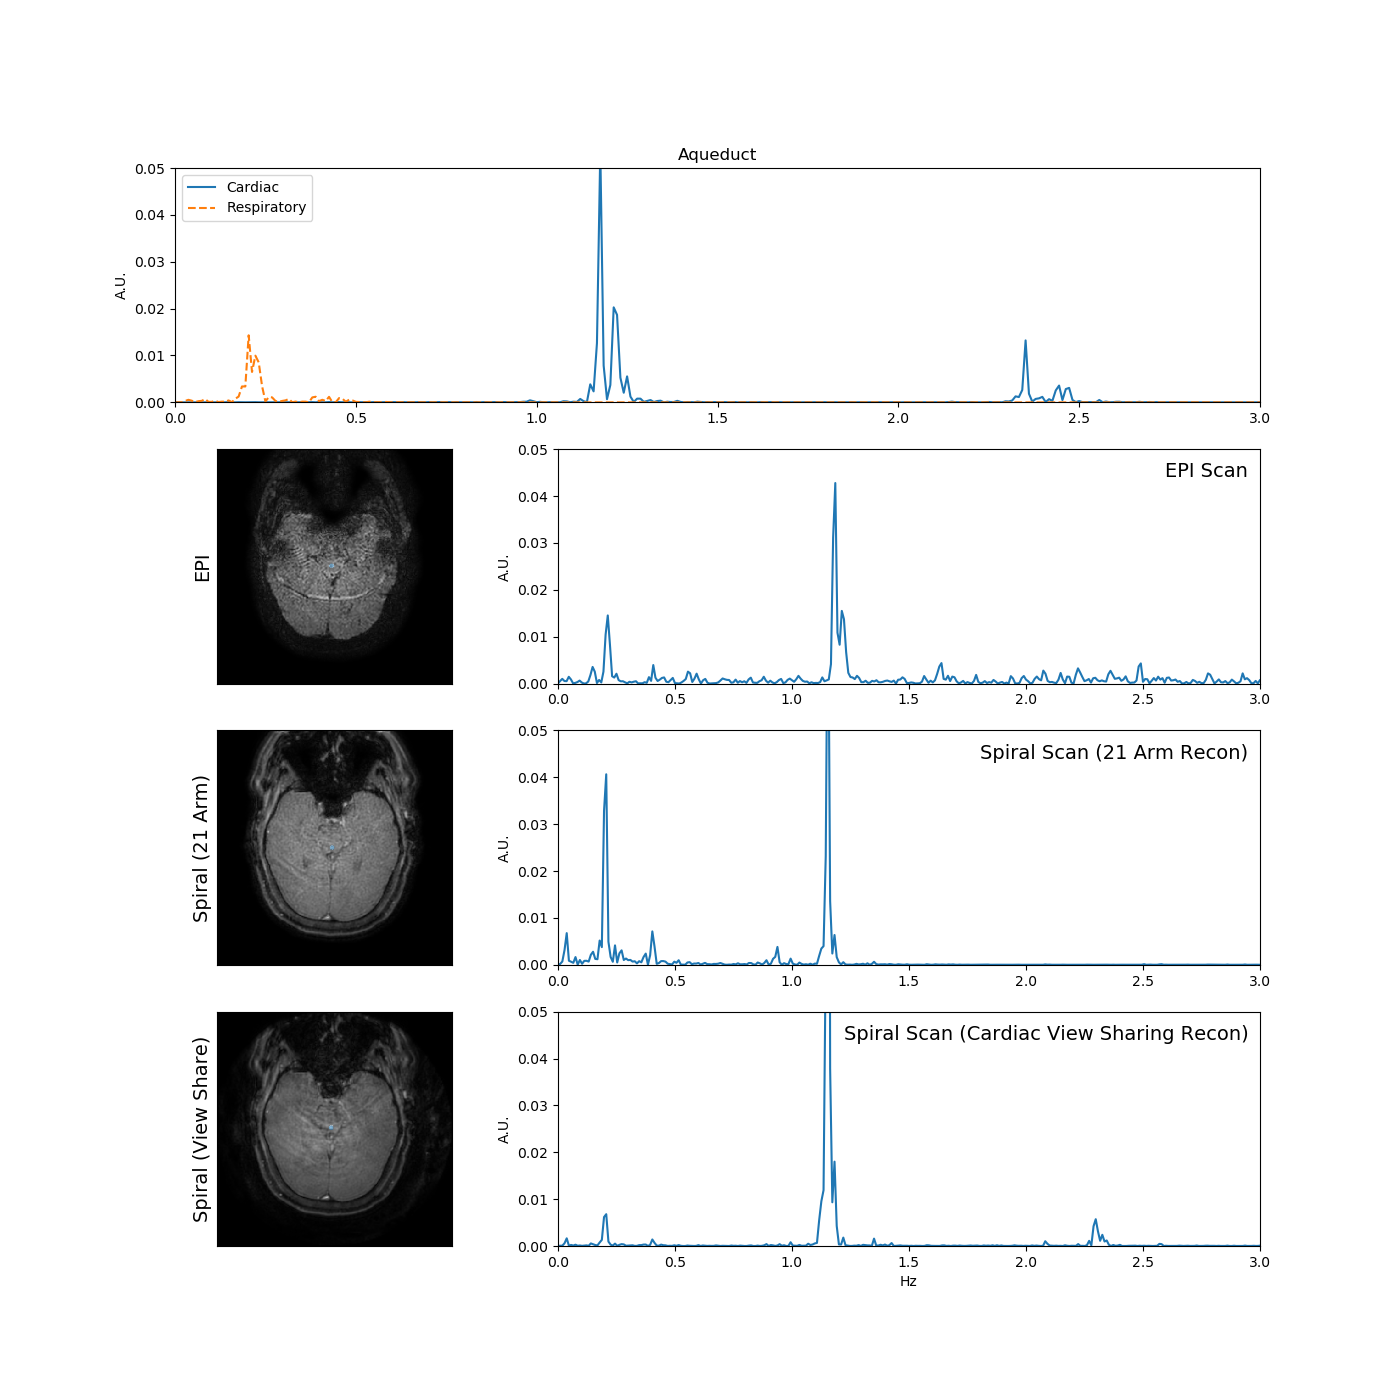
Comparison of time-resolved data at the cerebral aqueduct. Top
row shows frequency spectra for the cardiac and respiratory signals obtained
during the EPI scan. Remaining rows show a reconstructed magnitude image with
ROI overlaid in blue (left), and frequency spectrum for the time-resolved CSF
flow waveform in the ROI (right).
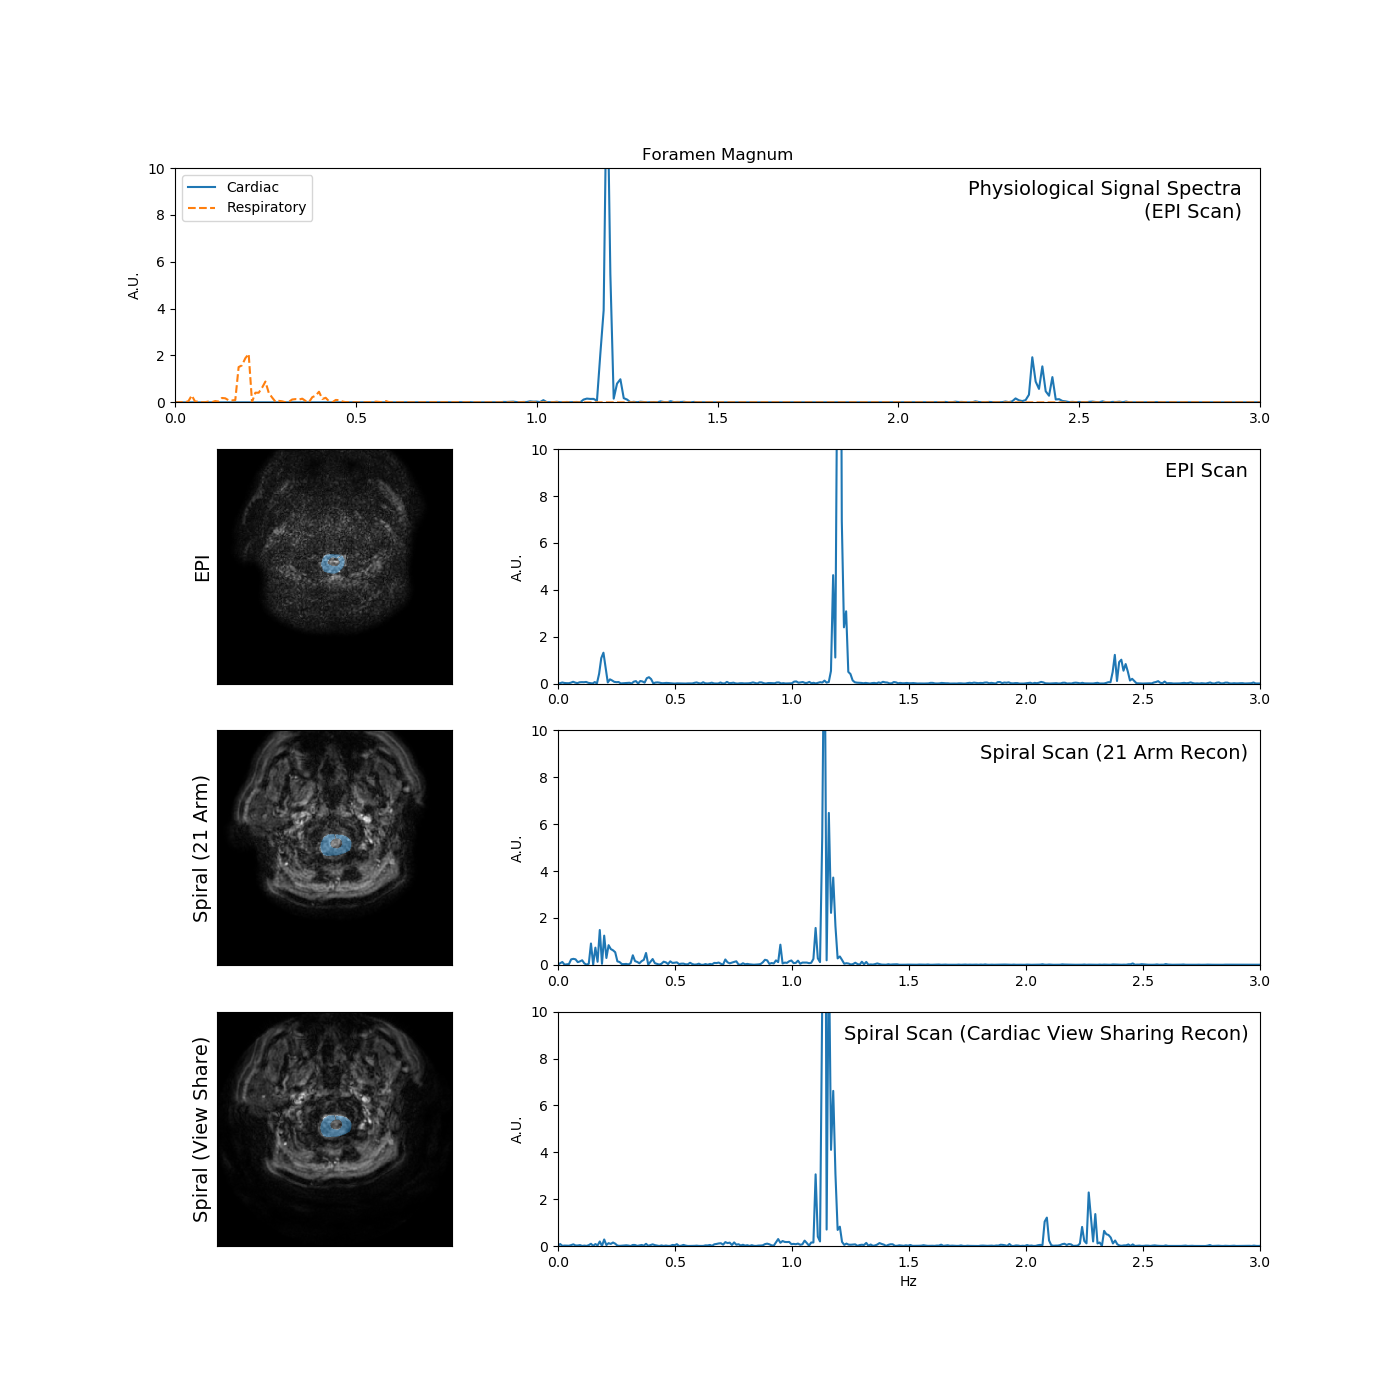
Comparison of time-resolved data at the foramen magnum (layout
identical to Fig. 4).