1676
Relationship between GluCEST concentration and Perivascular Spaces (glia-lymphatic waste clearance pathways) at 7T in Acute Ischemic Stroke1Department of Neuroscience, Monash University, Melbourne, Australia, 2Department of Neurology, Alfred Hospital, Melbourne, Australia, 3Department of Neurology, Royal Melbourne Hospital, Melbourne, Australia, 4Department of Medicine, University of Melbourne, Melbourne, Australia, 5Melbourne Node of the National Imaging Facility, Department of Radiology, University of Melbourne, Melbourne, Australia, 6Department of Radiology, Alfred Hospital, Melbourne, Australia, 7Department of Radiology, The Nanjing Brain Hospital Affiliated to Nanjing Medical University, Nanjing, China, 8Department of Radiology, Royal Melbourne Hospital, Melbourne, Australia, 9Department of Radiology and Medicine, University of Melbourne, Melbourne, Australia, 10Penn Epilepsy Center, Department of Neurology, Hospital of the University of Pennsylvania, Philadelphia, PA, United States, 11Center for Magnetic Resonance & Optical Imaging, Department of Radiology, University of Pennsylvania, Philadelphia, PA, United States, 12USC Stevens Neuroimaging and Informatics Institute, Keck School of Medicine, University of Southern California, Los Angeles, CA, United States
Synopsis
In this pilot study we test the hypothesis that glutamate levels post-stroke are influenced by glia-lymphatic clearance pathways in the brain. Excess glutamate can be neurotoxic, and stroke is associated with focally elevated gluatamate concentrations. Perivascular spaces have recently been found to play a role in waste clearance in the brain, and often become enlarged when compromised. We used Chemical Exchange Saturation Transfer (CEST) imaging at 7T to characterise glutamate concentrations, and found that they were moderately positively correlated with scores of enlarged pervivascular spaces.
Introduction
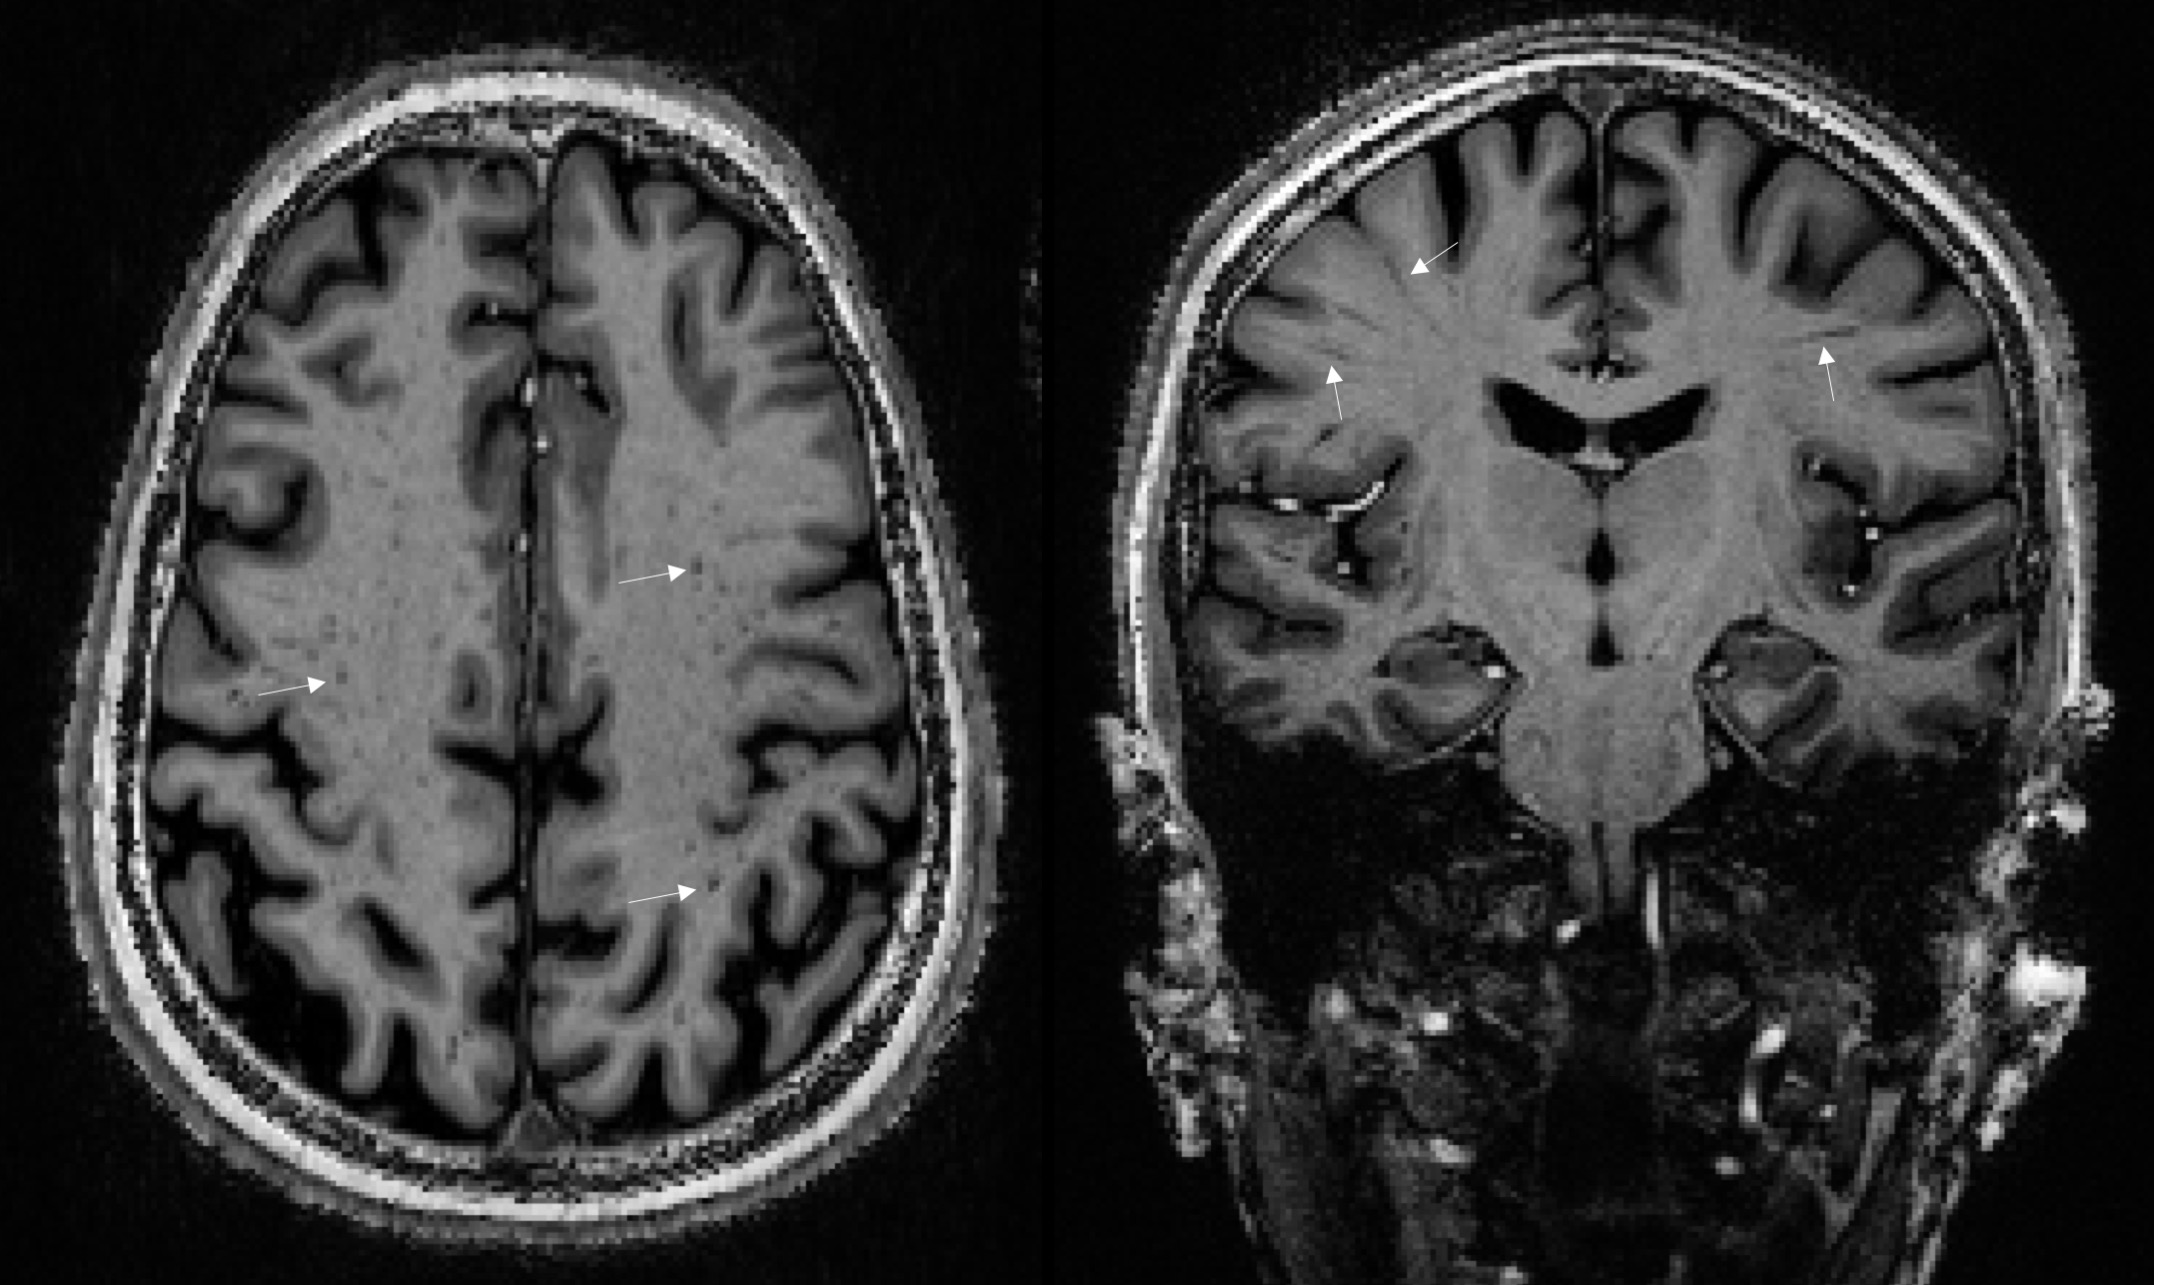
Glutamate is the primary excitatory neurotransmitter in the central nervous system, but elevated concentrations of glutamate can be neurotoxic, with numerous adverse effects including compromise of organelle functions, increase in nitric oxide production and free radicals, and increases in expression of pro-death transcription factors1. Acute ischemic stroke (AIS) has been observed to be associated with focally elevated cerebral concentrations of glutamate2, 3, possibly causing cell death and contributing to post-stroke epilepsy. Recent advances in Chemical Exchange Saturation Transfer (CEST) imaging have allowed high resolution in-vivo imaging of glutamate concentrations (GluCEST)4. In a study, we have observed both increases and decreases in GluCEST signal in patients with AIS. Over the last decade it has emerged that waste clearance in the brain is facilitated by flow of CSF through glia-lymphatic pathways and perivascular spaces (PVS), linear tubular structures lining the blood vessels in the brain5,6. A number of pathologies can obstruct these spaces in some cases leading to their enlargement, rendering them visible on MRI (Figure 1), yielding a signal similar to that of CSF. Historically, PVSs have been visible on MRI only when substantially enlarged by pathology, but more recently the higher resolution and signal to noise available at 7T has greatly assisted their in-vivo identification. In this pilot study, we hypothesized that glutamate concentrations following stroke are related to drainage in the brain, for which we use numbers of enlarged PVSs (EPVS) as a proxy. This relates to the interactions between vascular perfusion, collateral blood flow and PVS–CSF drainage.Methods
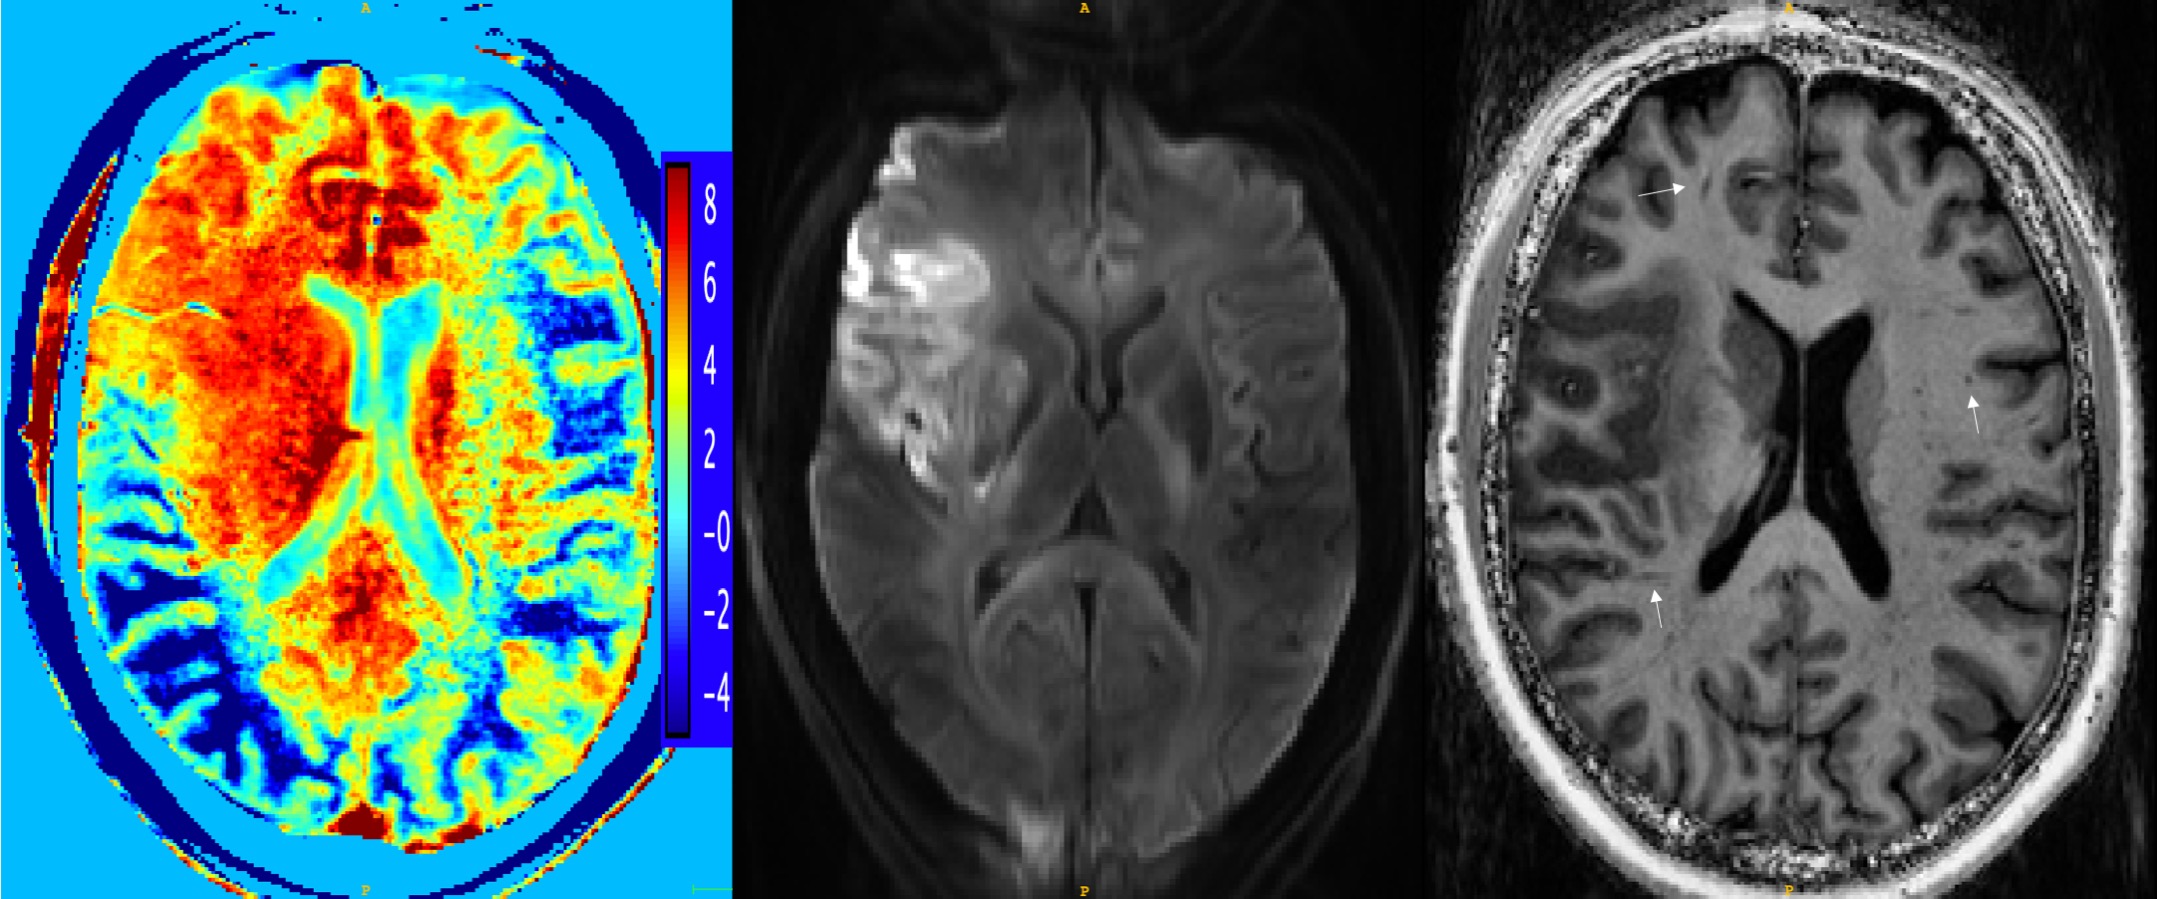
11 subjects (7 male, median age 56(31-72)) with cortical AIS were recruited for this pilot study. Patients were scanned within 14 days of stroke onset on a 7T Siemens Magnetom scanner at the University of Melbourne, Australia. A T1-weighted MP2RAGE sequence, resolution 0.9mm3, TR/TE/FA=4900ms/2.94ms/6o was acquired along with a Diffusion Weighted Image (DWI), resolution 1.24x1.24x5.0mm, TR/TE/FA=7000ms/72.4ms/90o, b-values=0,1000,3000s/mm2. Stroke lesions were identified on the DWI image and the axial slice best showing the lesion was selected as the field of view for the GluCEST acquisition4, resolution=0.78x0.78x5.0mm, TR/TE/FA=6.2ms/3.0ms/10o, 18 offsets: ±1.8-4.2ppm.GluCEST images were corrected for B0 and B1 inhomogeneities as per (4), and z-spectra obtained. Asymmetry in the z-spectra was calculated (Figure 2), henceforth referred to as GluCEST contrast, and used as an indirect measure of glutamate concentrations ([GLU], Figure 2). Stroke lesions were manually segmented on the DWI by a neurologist, along with an equivalent anatomical region on the contralateral hemisphere, and the mean GluCEST contrast within the lesion segmentation, and contralateral region calculated. Glutamate concentration change (∆[GLU]), henceforth referred to as GluCEST ratio, was calculated as:
$$\triangle[GLU]=\frac{mean[GLU]_{L}}{mean[GLU]_{C}}$$
L = lesional hemisphere, C = contralateral hemisphere.
EPVSs were manually annotated on the MP2RAGE images in the Centrum Semivale (CS), following the methodology of (7). Specifically, visible hypointense regions having the shape (circular or linear) and size (<3mm for circular) of PVS were selected. All relevant slices were reviewed for identification, but the slice with the largest number of visible EPVSs was selected for counting. The number of EPVSs were converted into a EPVS score (0-4) according to (7). Additionally, the inter-hemispheric asymmetry in EPVS, was calculated8, 9 as:
$$AI=\frac{N_{L}-N_{C}}{N_{L}+N_{C}}$$
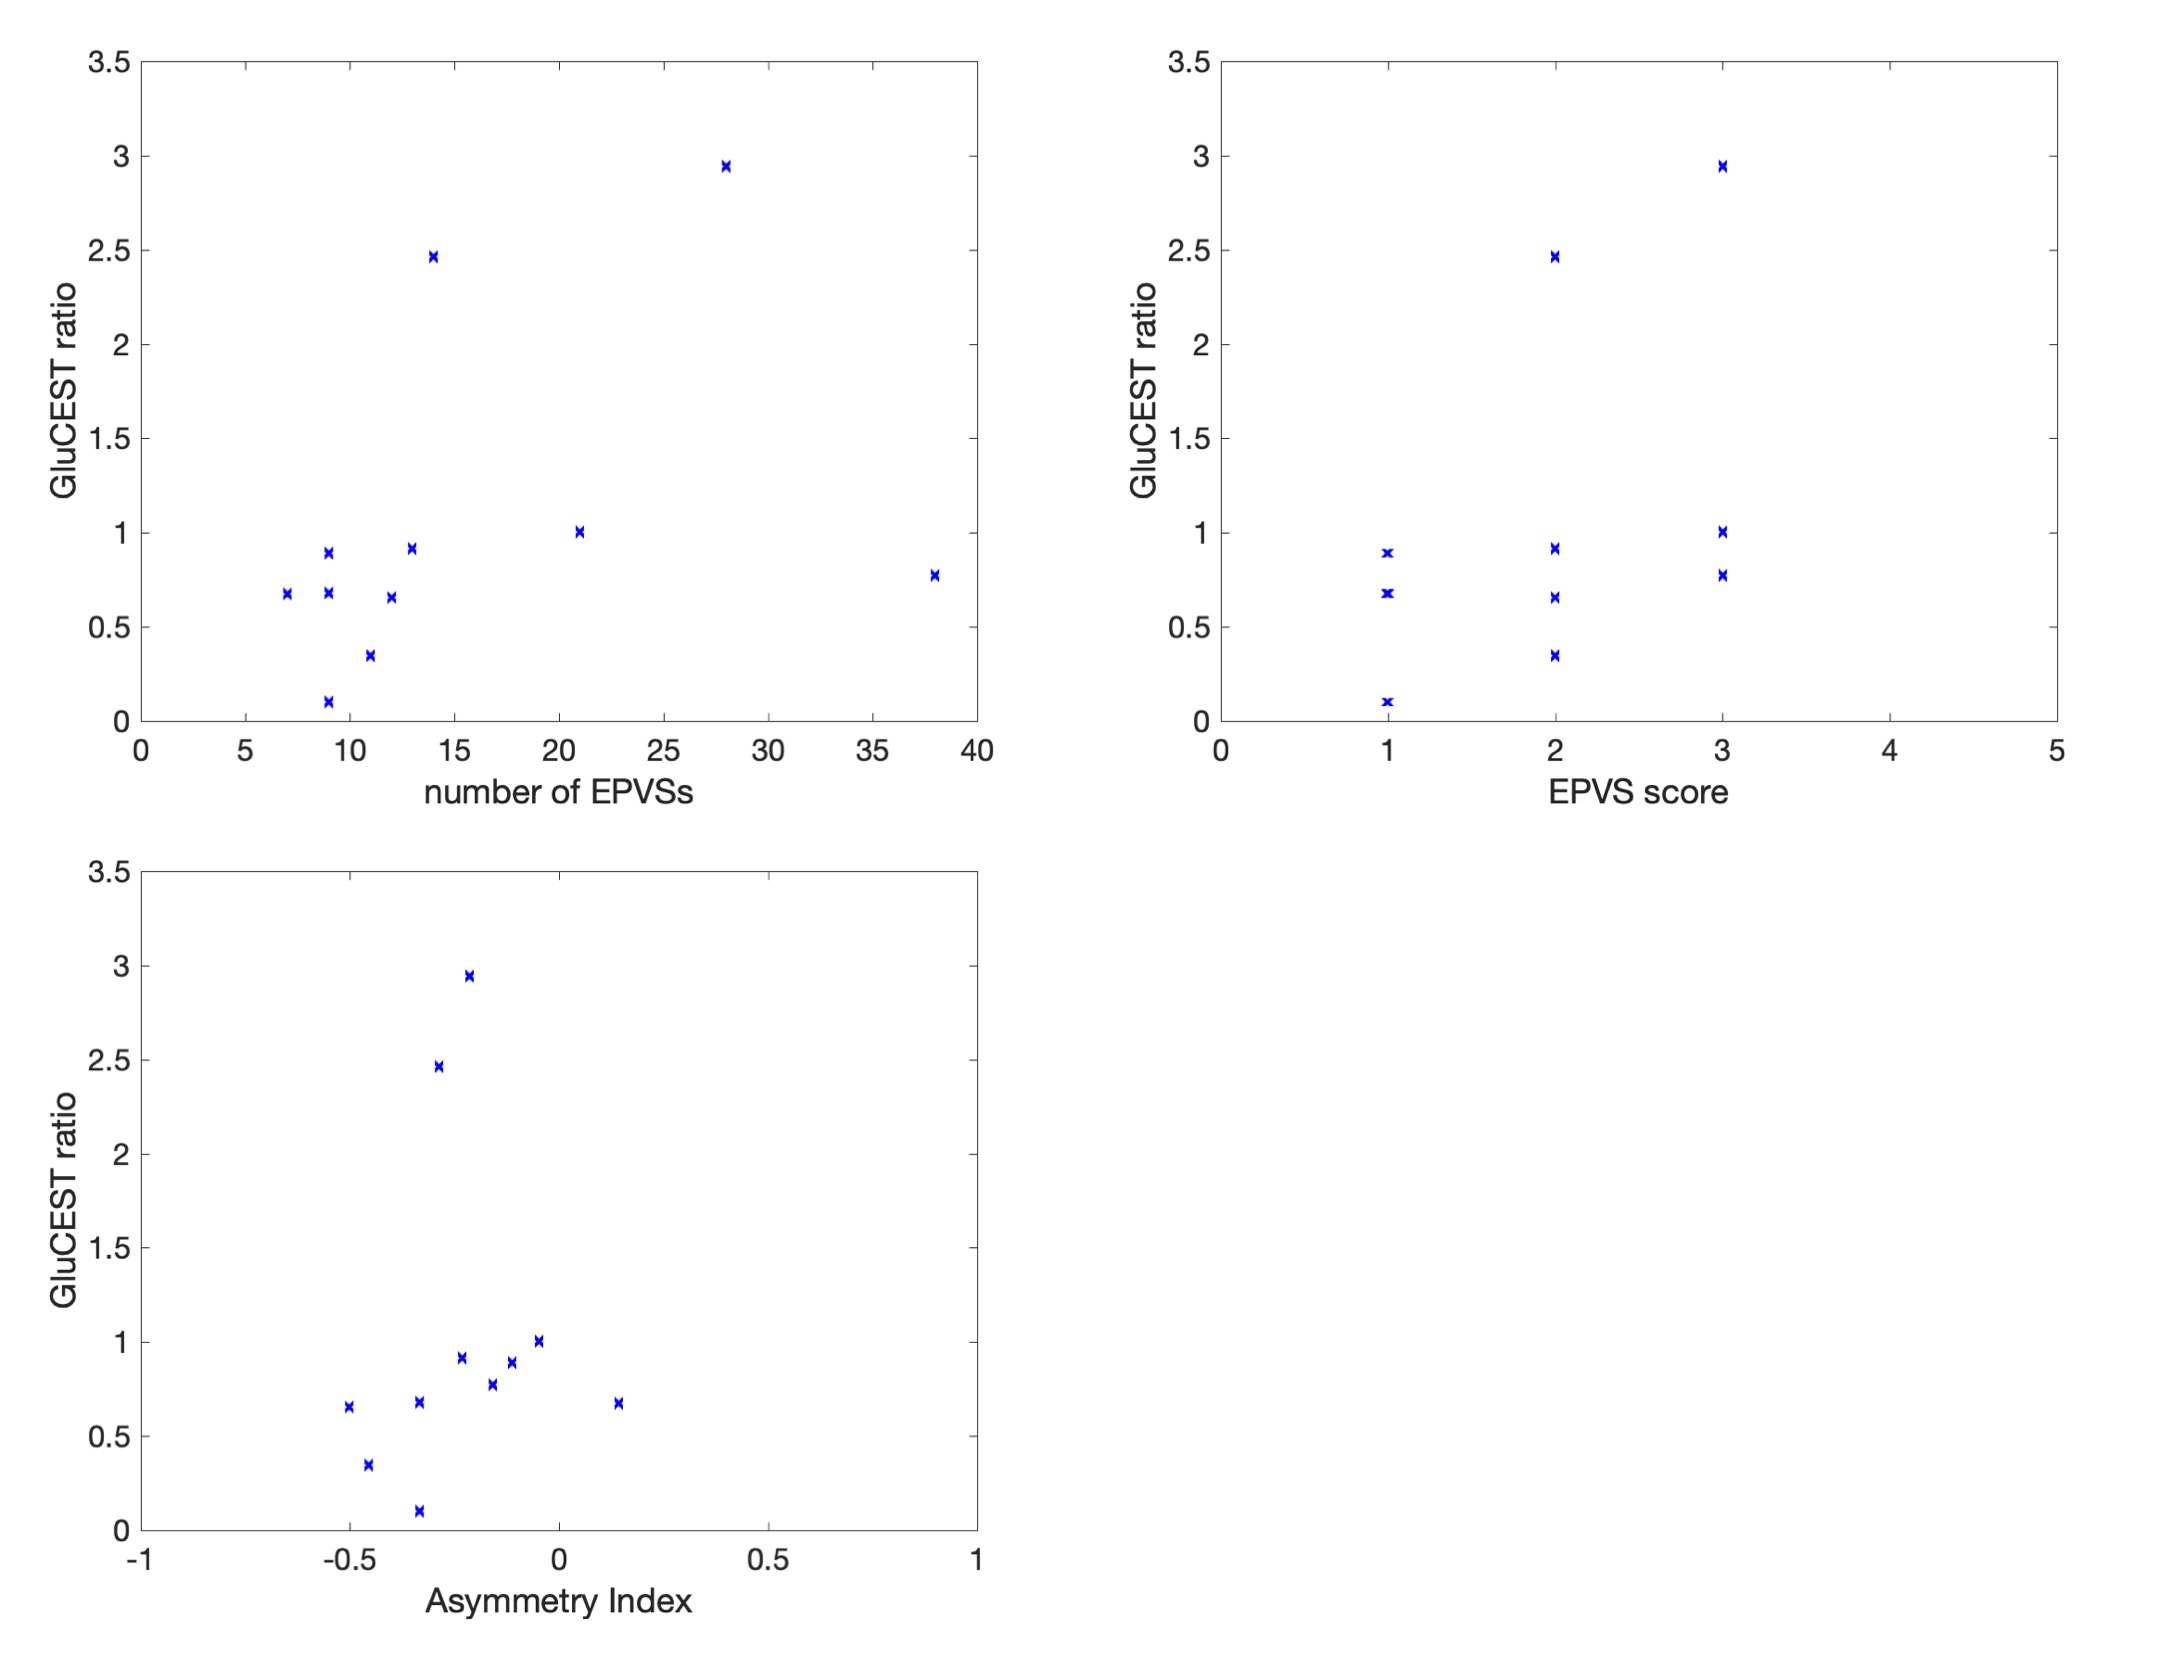
The relationships between glutamate concentration changes (∆[GLU]) and EPVS characteristics were assessed using the Spearman rank-order correlation coefficient for ordinal EPVS score and using the correlation coefficient for EPVS number and AI.
Results
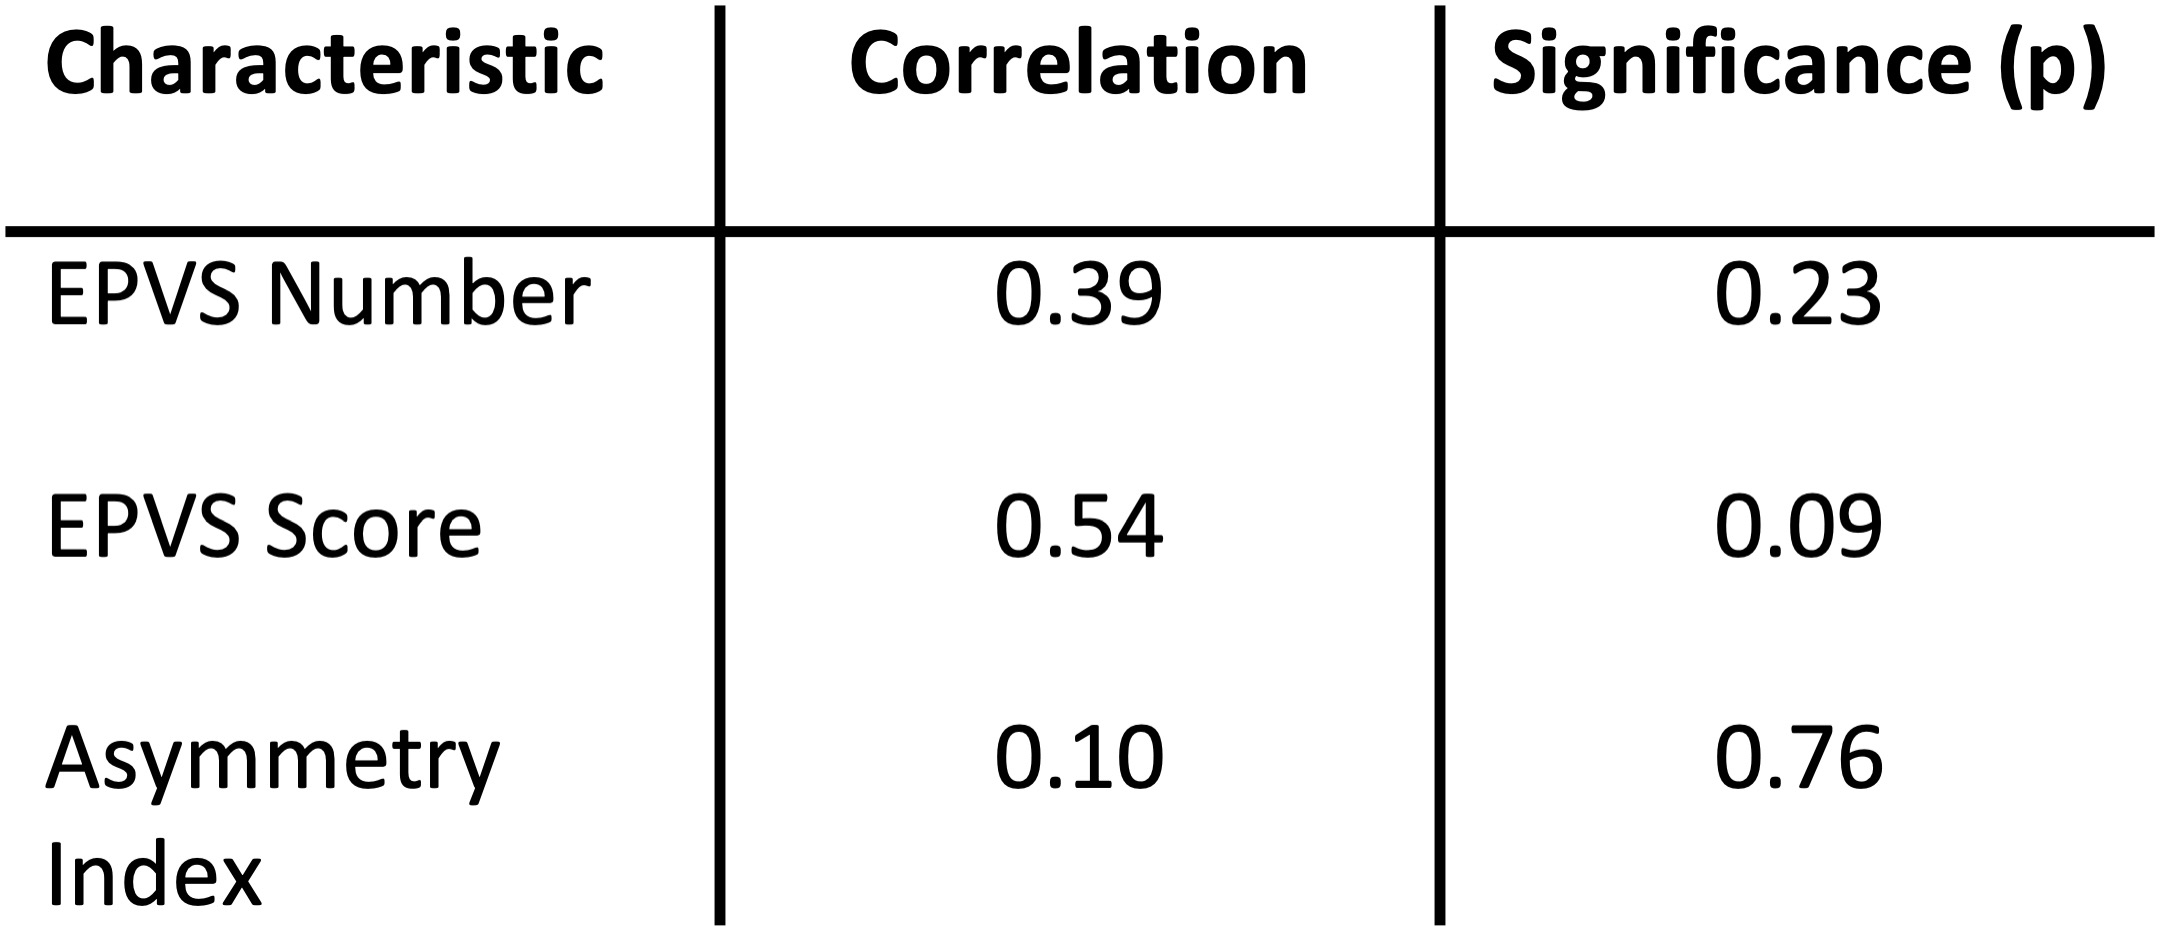
Increases in GluCEST contrast (∆[GLU]>1) were seen in 3 patients, and reductions in 8 patients. GluCEST contrast and T1 image are displayed in Figure 2 for a patient with a high GluCEST ratio. This patient also had a large number of EPVSs. The correlations between EPVS number and EPVS score with ∆[GLU] were both positive, though neither reached statistical significance (Table 1, Figure 3). The correlation between AI and ∆[GLU] was low.Discussion
The positive correlation between EPVS score and GluCEST changes is in line with the hypothesis that deficits in drainage contribute to sustained elevated glutamate concentrations post-stroke. The PVSs play a key role in the removal of waste products in the brain, and the data here suggest that they may have a role in normalizing glutamate levels after AIS. If validated in larger datasets, this would add to our understanding of post-stroke recovery mechanisms, and may provide a novel target for acute treatment of stroke. Although we observed a trend, it was not statistically significant. This pilot study had a low sample size and a number of additional limitations. The major limitations are firstly that PVSs were segmented on T1-weighted images, as opposed to T2-weighted images where they are generally more easily delineated, and distinguishable from other features (e.g. lacunes, blood vessels). Secondly, our method of correcting for B1 inhomogeneities in the CEST images4 have known limitations10. Thirdly, the stroke lesions occurred at varying locations in the brain, whereas EPVS were counted at consistent locations between patients. Finally, although we endeavored to scan patients as soon as possible after hospital admission, there was a variation in the period between admission and scanning (48 to 312 hours), during which the behavior of PVSs has been observed to evolve 11, 12.Acknowledgements
The authors acknowledge the facilities and scientific and technical assistance of the National Imaging Facility, a National Collaborative Research Infrastructure Strategy (NCRIS) capability, at the MBCIU,the University of MelbourneReferences
1. Wang Y, Qin ZH. Molecular and cellular mechanisms of excitotoxic neuronal death. Apoptosis. 2010;15(11):1382-402.
2. Bullock R, Zauner A, Woodward J, Young HF. Massive persistent release of excitatory amino acids following human occlusive stroke. Stroke. 1995;26(11):2187-9.
3. Davalos A, Castillo J, Serena J, Noya M. Duration of glutamate release after acute ischemic stroke. Stroke. 1997;28(4):708-10.
4. Cai K, Haris M, Singh A, Kogan F, Greenberg JH, Hariharan H, et al. Magnetic resonance imaging of glutamate. Nat Med. 2012;18(2):302-6.
5. Iliff JJ, Wang M, Liao Y, Plogg BA, Peng W, Gundersen GA, et al. A paravascular pathway facilitates CSF flow through the brain parenchyma and the clearance of interstitial solutes, including amyloid beta. Sci Transl Med. 2012;4(147):147ra11.
6. Xie L, Kang H, Xu Q, Chen MJ, Liao Y, Thiyagarajan M, et al. Sleep drives metabolite clearance from the adult brain. Science. 2013;342(6156):373-7.
7. Potter G, Morris Z, Wardlaw J. Enlarged perivascular spaces (EPVS): a visual rating scale and user guide. 2015.
8. Feldman RE, Rutland JW, Fields MC, Marcuse LV, Pawha PS, Delman BN, et al. Quantification of perivascular spaces at 7T: A potential MRI biomarker for epilepsy. Seizure. 2018;54:11-8.
9. Duncan D, Barisano G, Cabeen R, Sepehrband F, Garner R, Braimah A, et al. Analytic Tools for Post-traumatic Epileptogenesis Biomarker Search in Multimodal Dataset of an Animal Model and Human Patients. Front Neuroinform. 2018;12:86.
10. Singh A, Cai K, Haris M, Hariharan H, Reddy R. On B1 inhomogeneity correction of in vivo human brain glutamate chemical exchange saturation transfer contrast at 7T. Magn Reson Med. 2013;69(3):818-24.
11. Gaberel T, Gakuba C, Goulay R, Martinez De Lizarrondo S, Hanouz JL, Emery E, et al. Impaired glymphatic perfusion after strokes revealed by contrast-enhanced MRI: a new target for fibrinolysis? Stroke. 2014;45(10):3092-6.
12. Yang D, Ma L, Wang P, Yang D, Zhang Y, Zhao X, et al. Normobaric oxygen inhibits AQP4 and NHE1 expression in experimental focal ischemic stroke. Int J Mol Med. 2019;43(3):1193-202.
Figures