1674
Thalamic structural connectivity abnormalities in minimal hepatic encephalopathy: a probabilistic tractography study1Fujian Medical University Union Hospital, Fuzhou, China
Synopsis
Minimal hepatic encephalopathy (MHE) is characterized by a series of cognitive impairments. Thalamus is a critical pathological node of MHE. Thus, we applied probabilistic tractography to investigate the thalamic fiber pathway alterations in MHE, for the first time. The thalamic structural connection was disturbed in MHE patients (reflected by decreased CS/FA and increased MD/AD/RD). Abnormal thalamic connection primarily involved prefrontal cortex, sensorimotor cortex, parietal cortex, medial temporal cortex and hippocampus, and striatum. Thalamic connectivity abnormalities deteriorated with disease progression and correlated with patients’ impaired neuropsychological performance. The disturbed thalamic connectivity can serve as biomarker for diagnosis of MHE.
Introduction
As the most common neurocognitive complication of cirrhosis, minimal hepatic encephalopathy (MHE) is characterized by a series of cognitive impairments, such as impaired attention ability and disturbed executive performance 1. MHE impairs health related quality of life 2 and daily functioning1, and predicts higher risk of poor prognosis 3. The neuropathological mechanism underlying this disease is still not well understood.Thalamus is a critical pathological node of MHE. Histopathologically, neuronal cell death and myelinolysis involving the thalamus have been reported in MHE 4, 5. An increasing number of studies have demonstrated that MHE is associated with disturbance of basal ganglia-thalamus-cortical pathway 6-8. Moreover, neuroimaging studies have elucidated thalamic associated structural, functional and metabolic abnormality in MHE 9-12.
Diffusion based tractography has enable us to map the thalamic structural network in vivo and shows good agreement with those found in functional and histological studies 13, 14. Using probabilistic tractography, researchers have shown abnormality of thalamic structural connection in ADHD, schizophrenia and other neuropsychological disease 15, 16. Given that previous study has demonstrated disrupted thalamic functional network in MHE12, we inferred that MHE suffers from thalamic structural connectivity disruption that underlies the functional alteration of thalamus. Thus, we aimed to apply probabilistic tractography to investigate the thalamic fiber pathway alterations in MHE, for the first time.
Methods
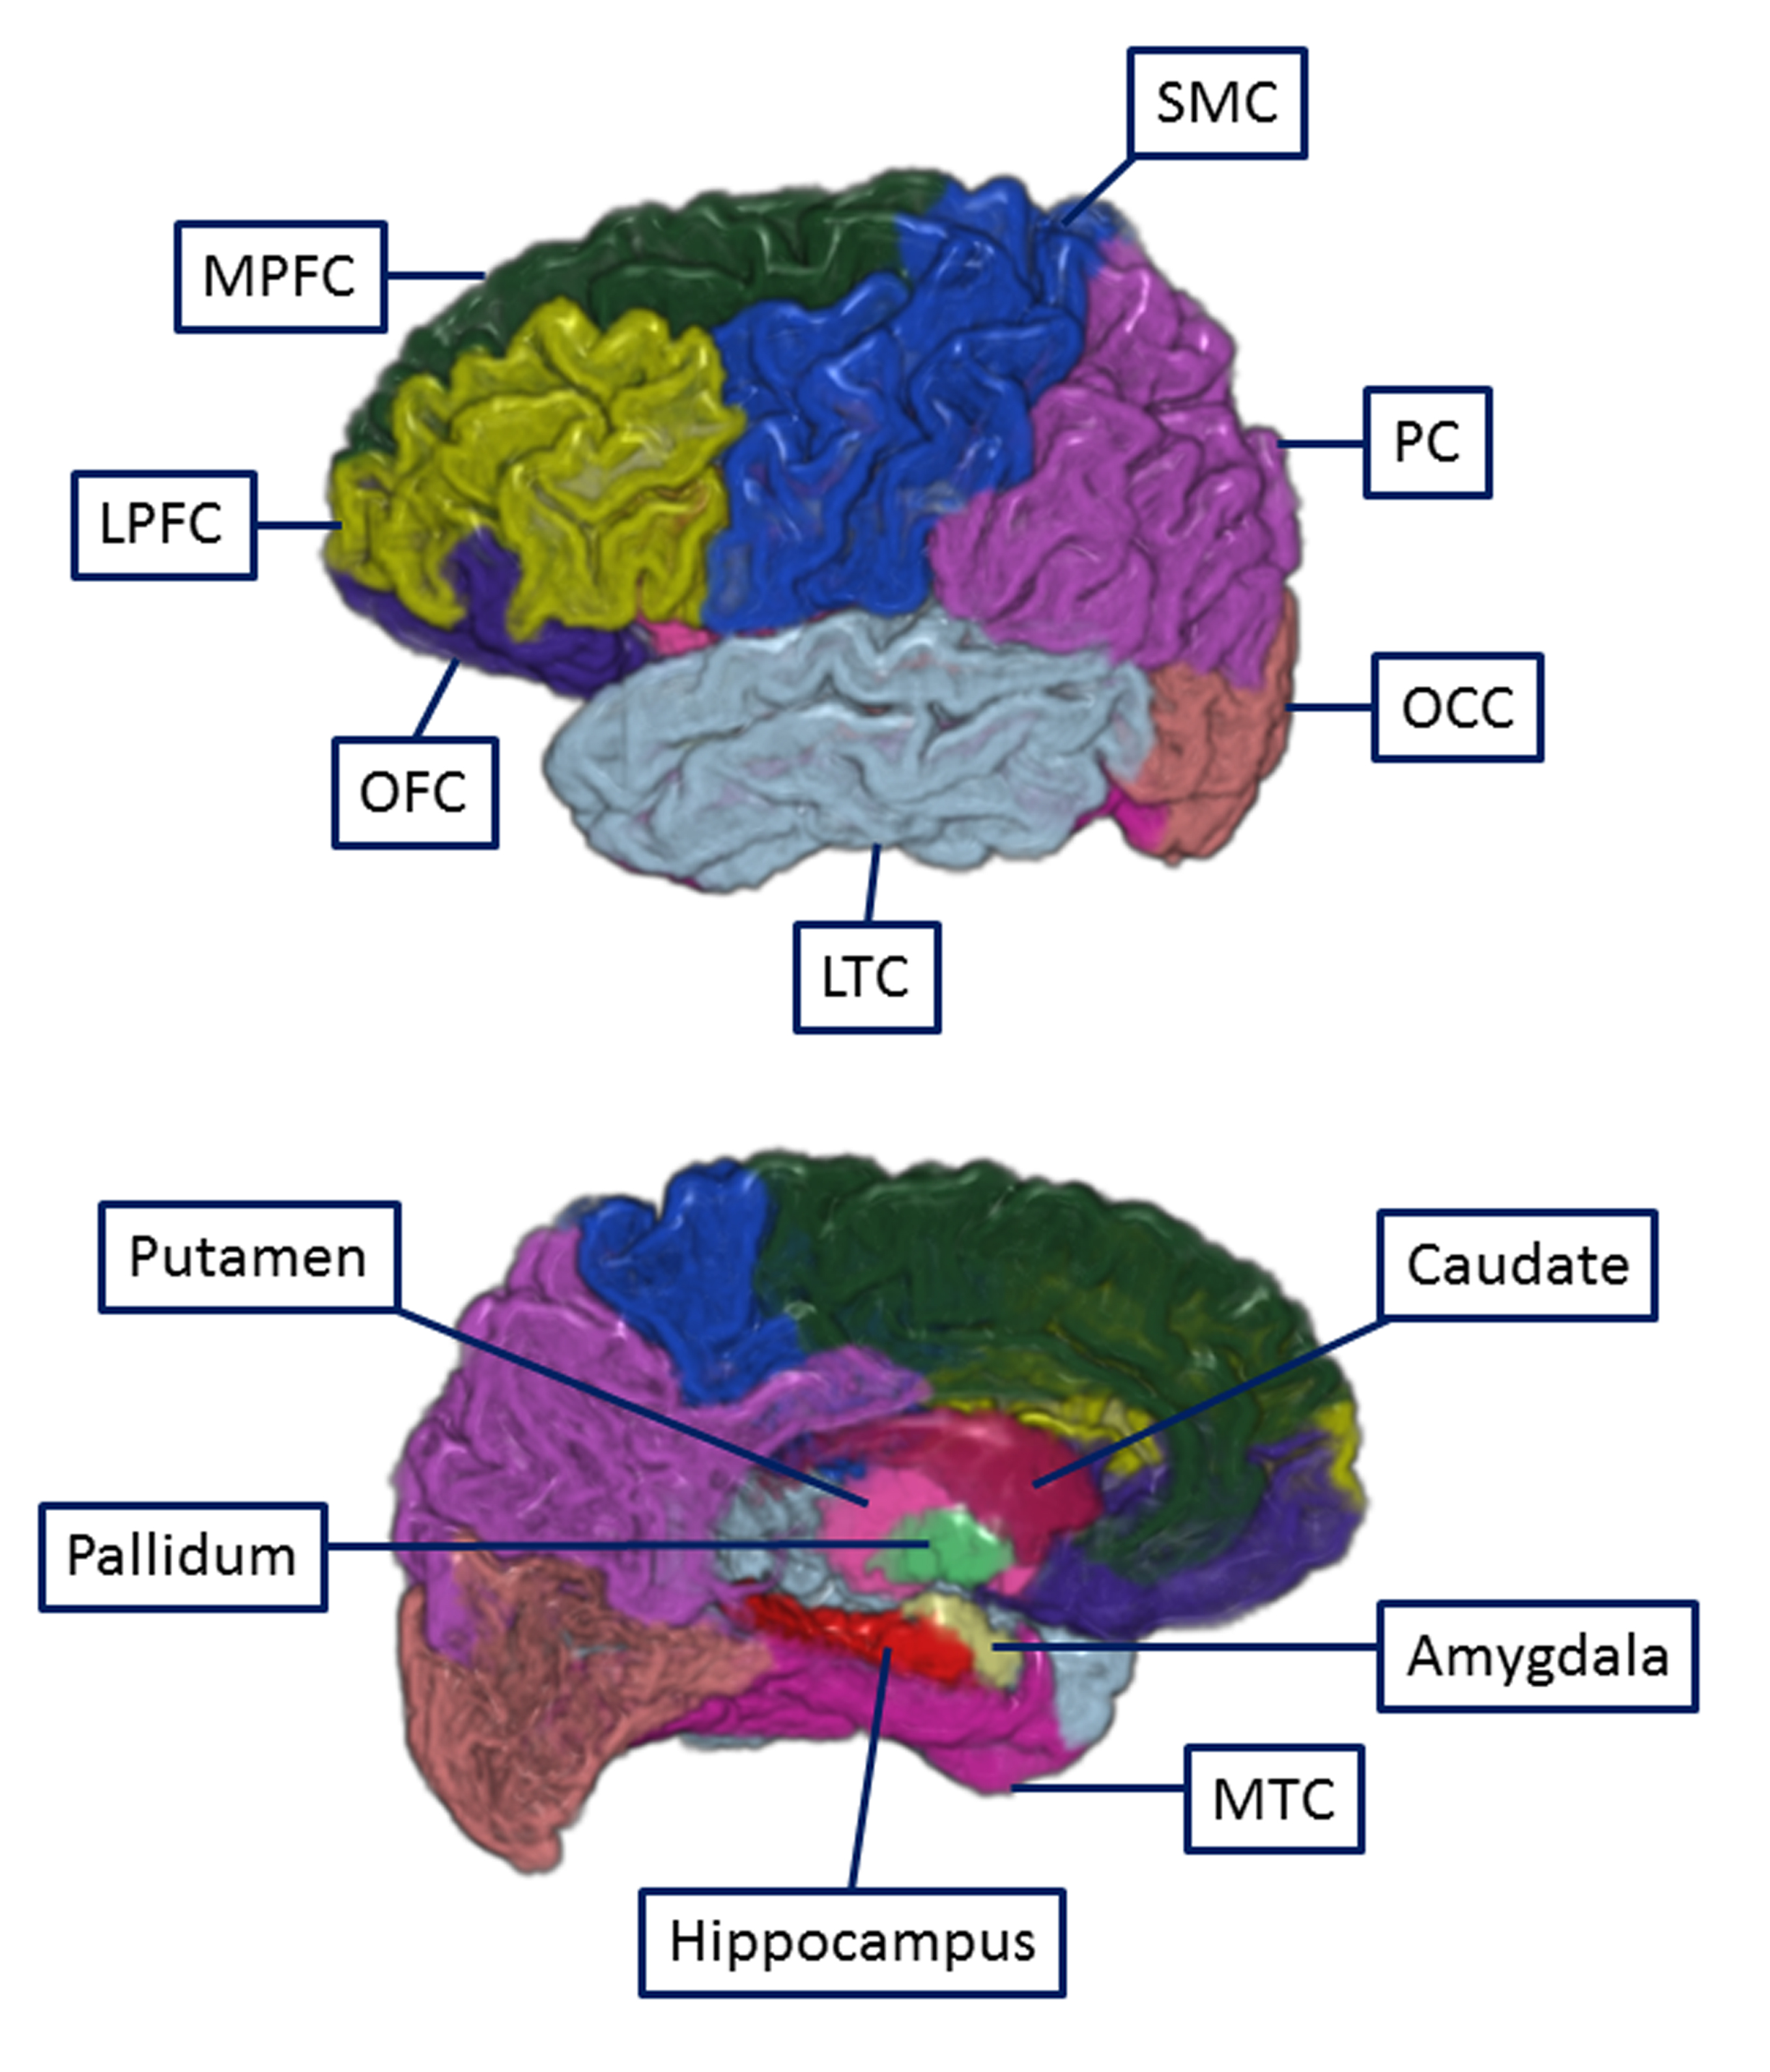
Diffusion based probabilistic tractography was used to determine structural connection between thalamus and the cortical/subcortical regions in 22 cirrhotic patients with MHE, 30 cirrhotic patients without MHE (NHE), and 30 healthy controls (HC).Figures 1 shows the cortical and subcortical subdivisions accordind to the existing studies 15, 17. OFC, orbitofrontal cortex (including parsorbitalis, medial orbitofrontal cortex, and lateral orbitofrontal cortex); MPFC, medial prefrontal cortex (including caudal anterior cingulate, rostral anterior cingulate, and superior frontal gyrus); LPFC, lateral prefrontal cortex (including parstriangularis, frontal pole, rostral middle frontal gyrus, and parsopercularis); SMC, sensorimotor cortex (including precentral gyrus, caudal middle frontal gyrus, postcentral gyrus, and paracentral lobule); PC, parietal cortex (including inferior parietal cortex, supramarginal gyrus, precuneus cortex, posterior cingulate cortex, isthmus cingulate, and superior parietal cortex); MTC, medial temporal cortex (including entorhinal cortex, parahippocampal gyrus, fusiform gyrus); LTC, lateral temporal cortex (including transverse temporal cortex, superior temporal gyrus, banks of the superior temporal sulcus, inferior temporal gyrus, middle temporal gyrus, and temporal pole); OCC, occipital cortex (including pericalcarine cortex, lingual gyrus, lateral occipital cortex, and cuneus cortex).
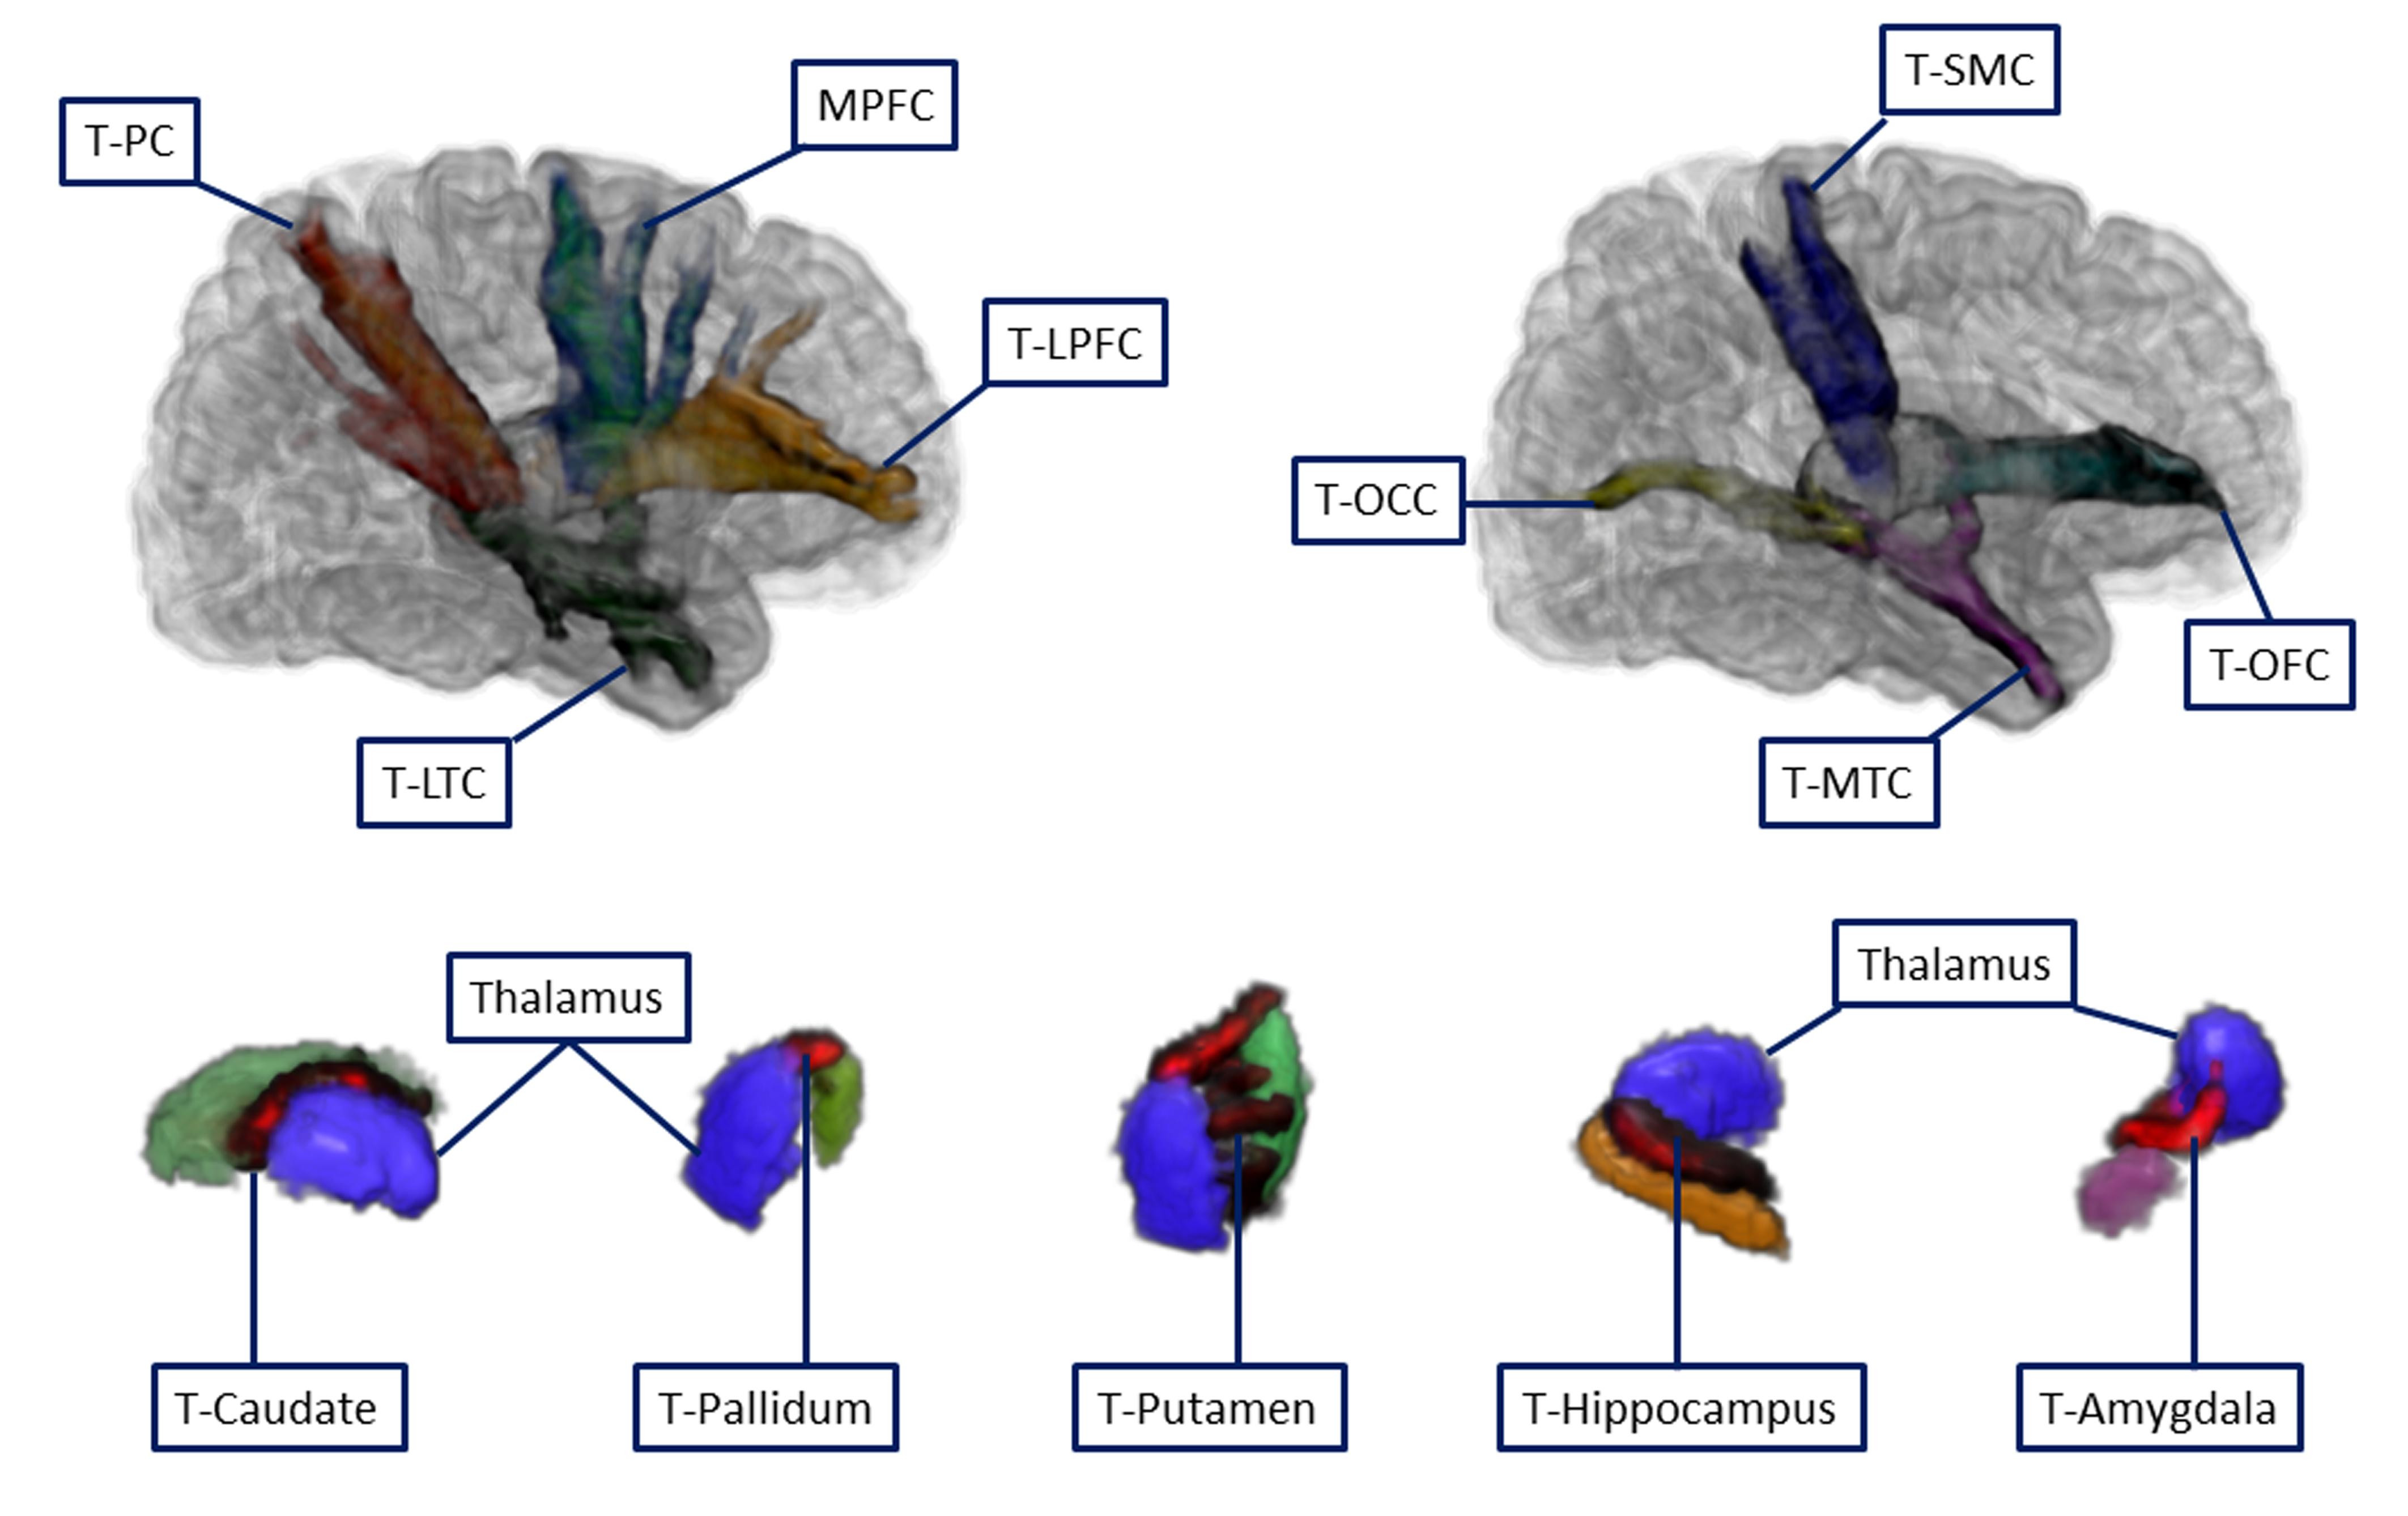
The illustration of fiber connectivity between thalamus and cortical/subcortical subdivisions see Figure 2.
DTI (diffusion tensor imaging) measurements of these thalamic connections, including connectivity strength (CS), fractional anisotropy (FA), mean diffusivity (MD), axial diffusivity (AD) and radial diffusivity (RD), were calculated and compared across three groups. Neuropsychological assessment was performed as well. The correlation analysis was conducted to investigate the relationship between neuropsychological performance and the DTI measurements about thalamic connections. Machine-learning classification analysis was performed to estimate whether diffusion measurements can distinguish MHE from NHE.
Results
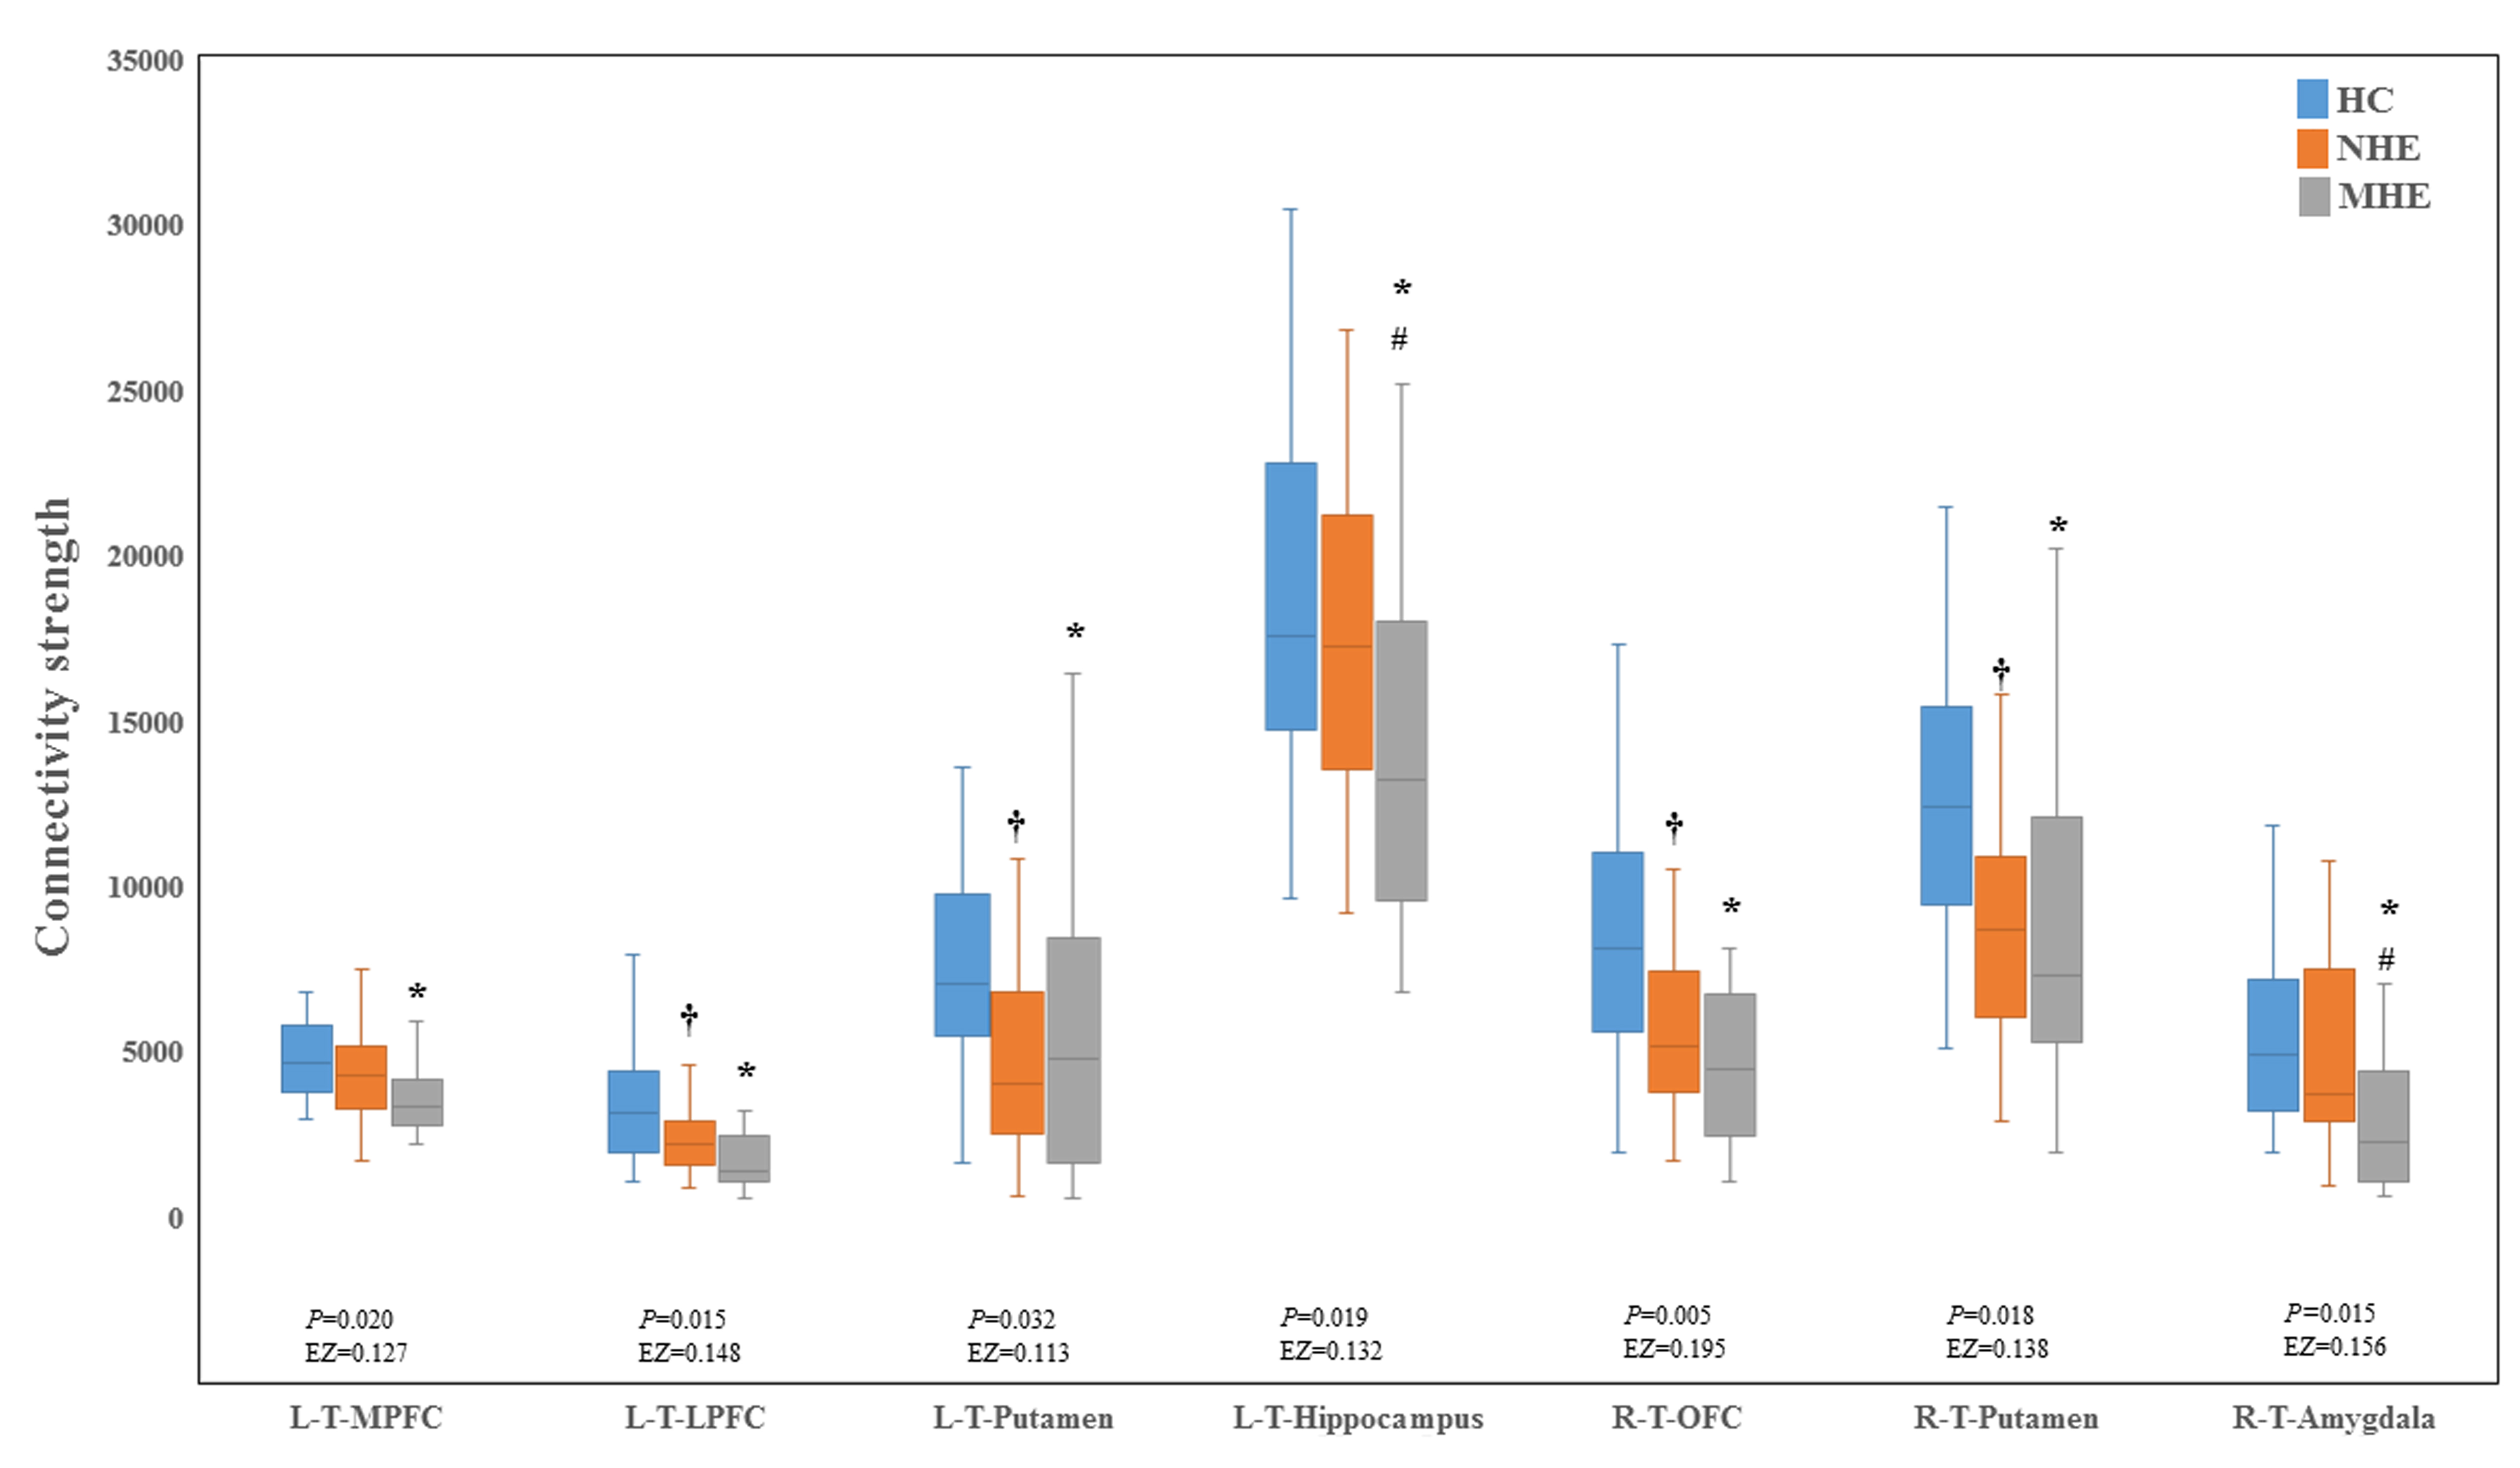
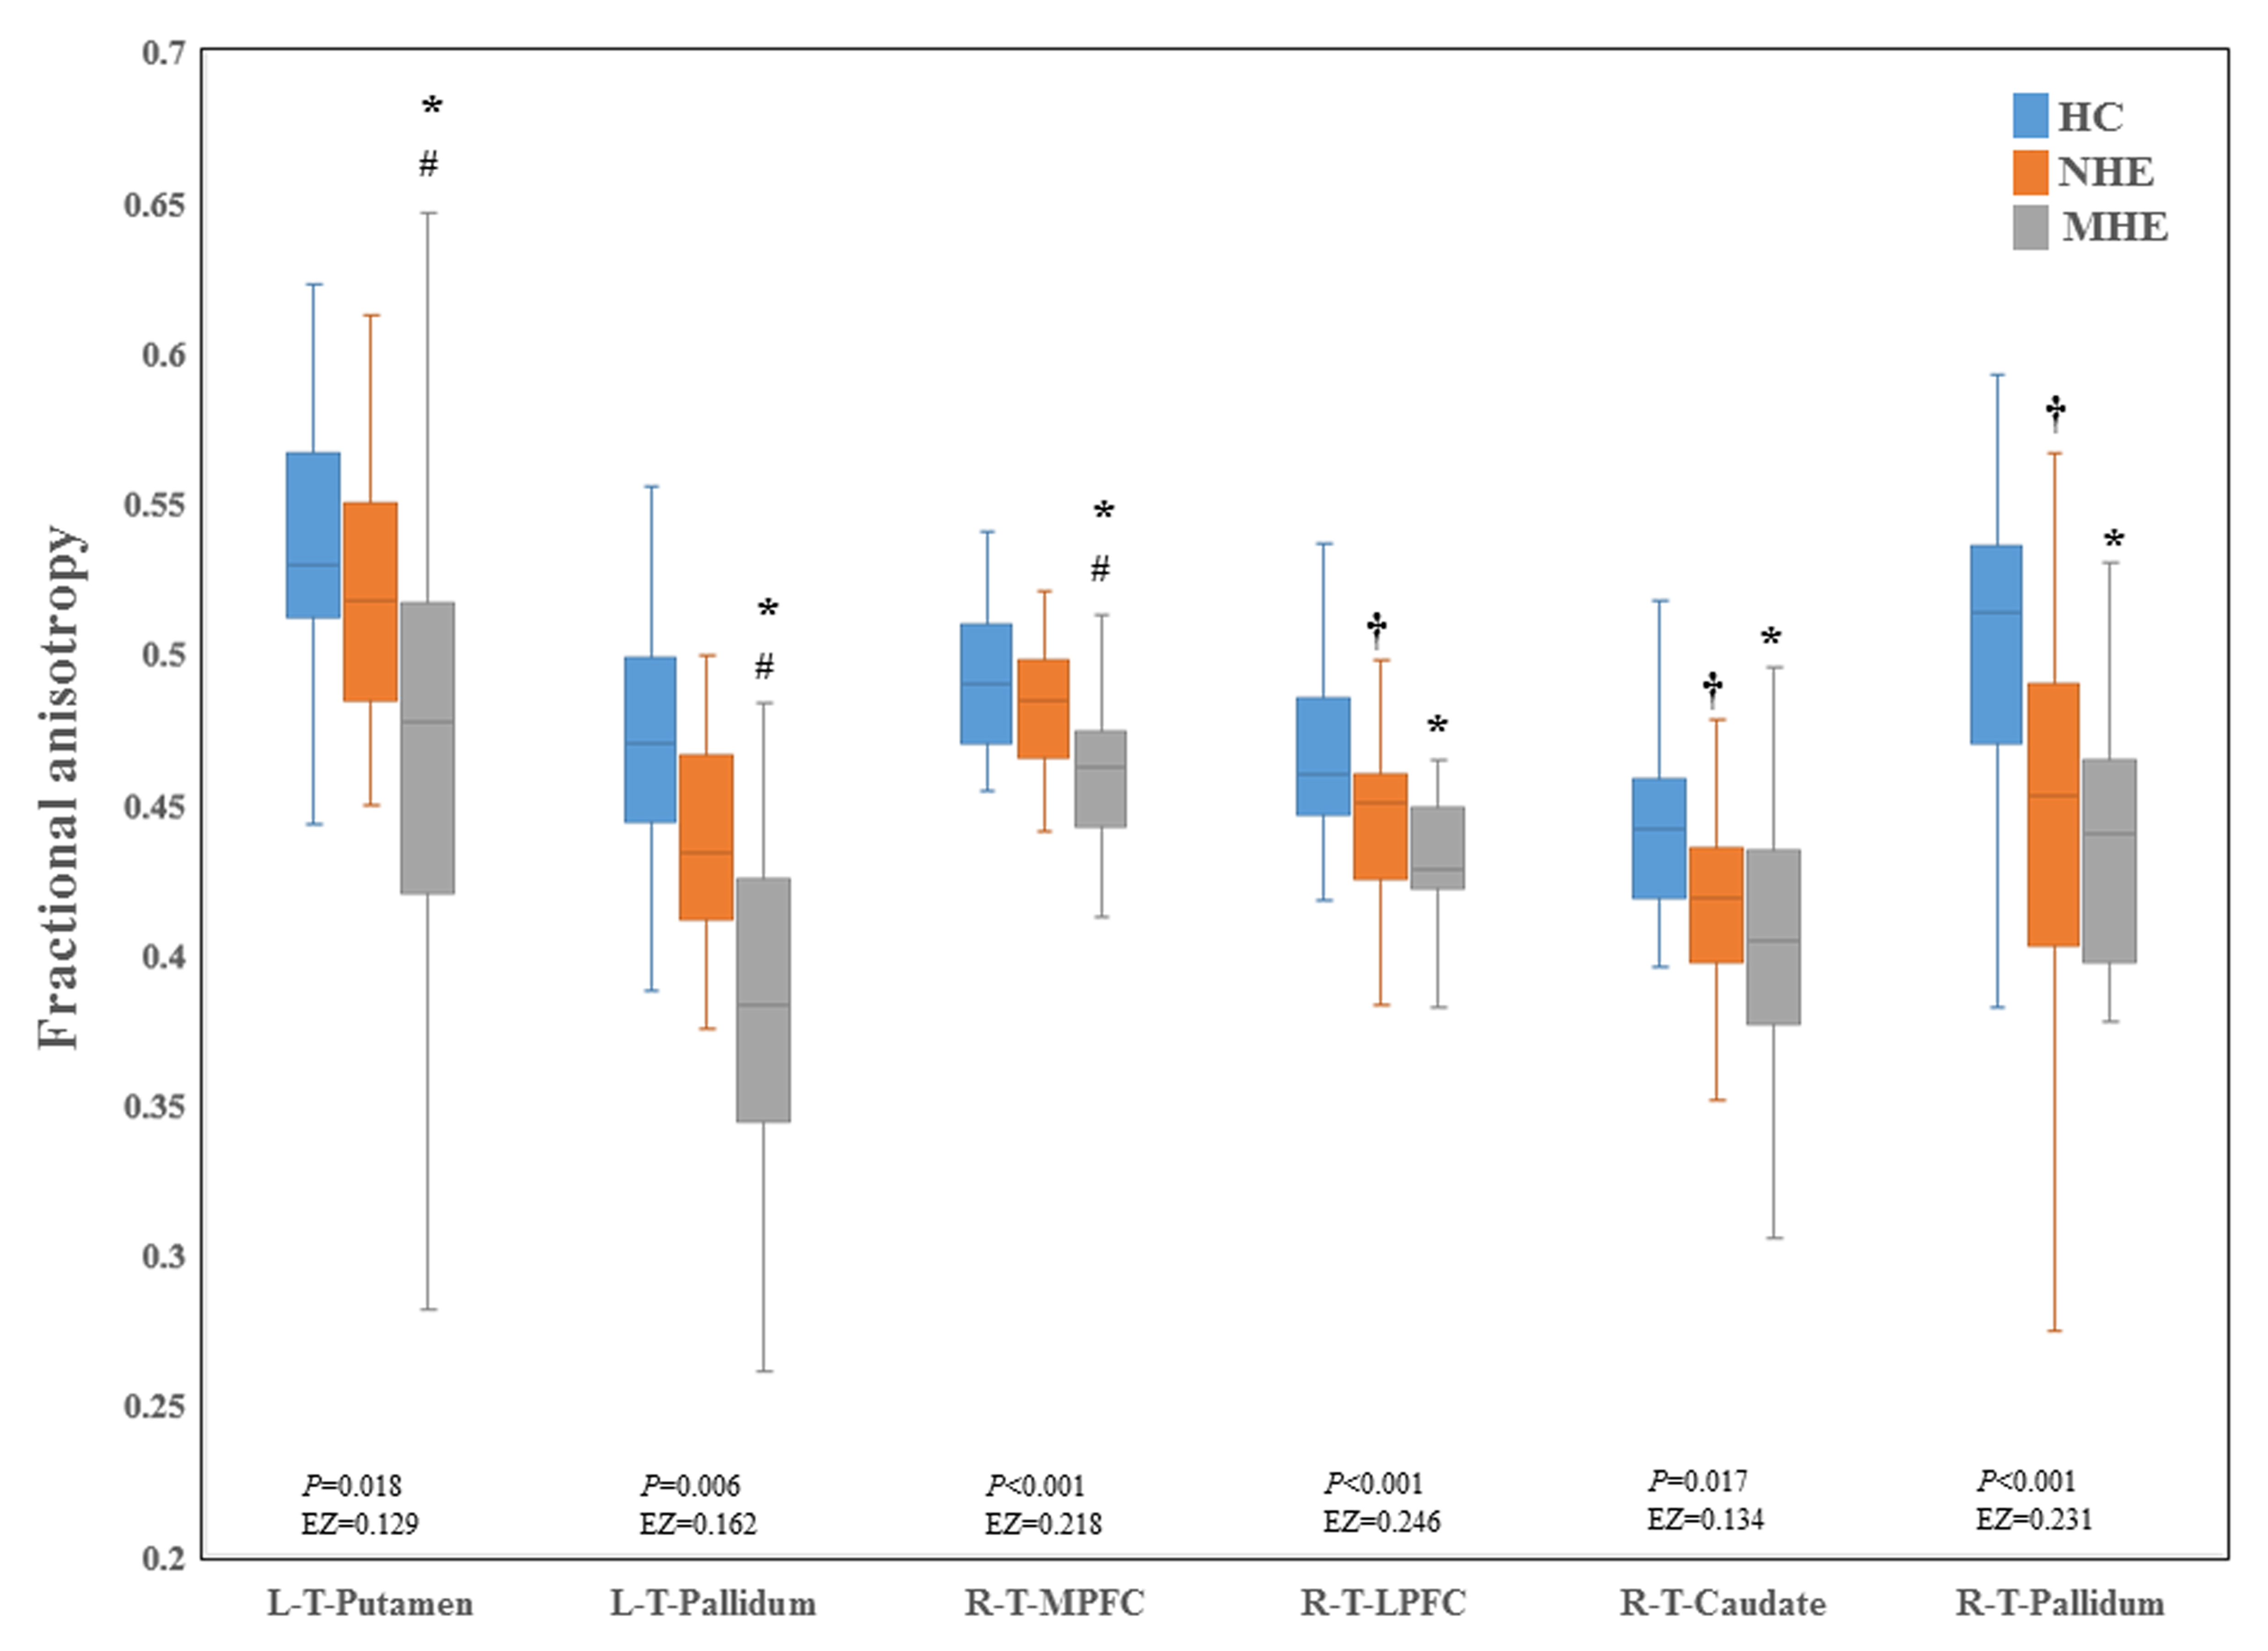
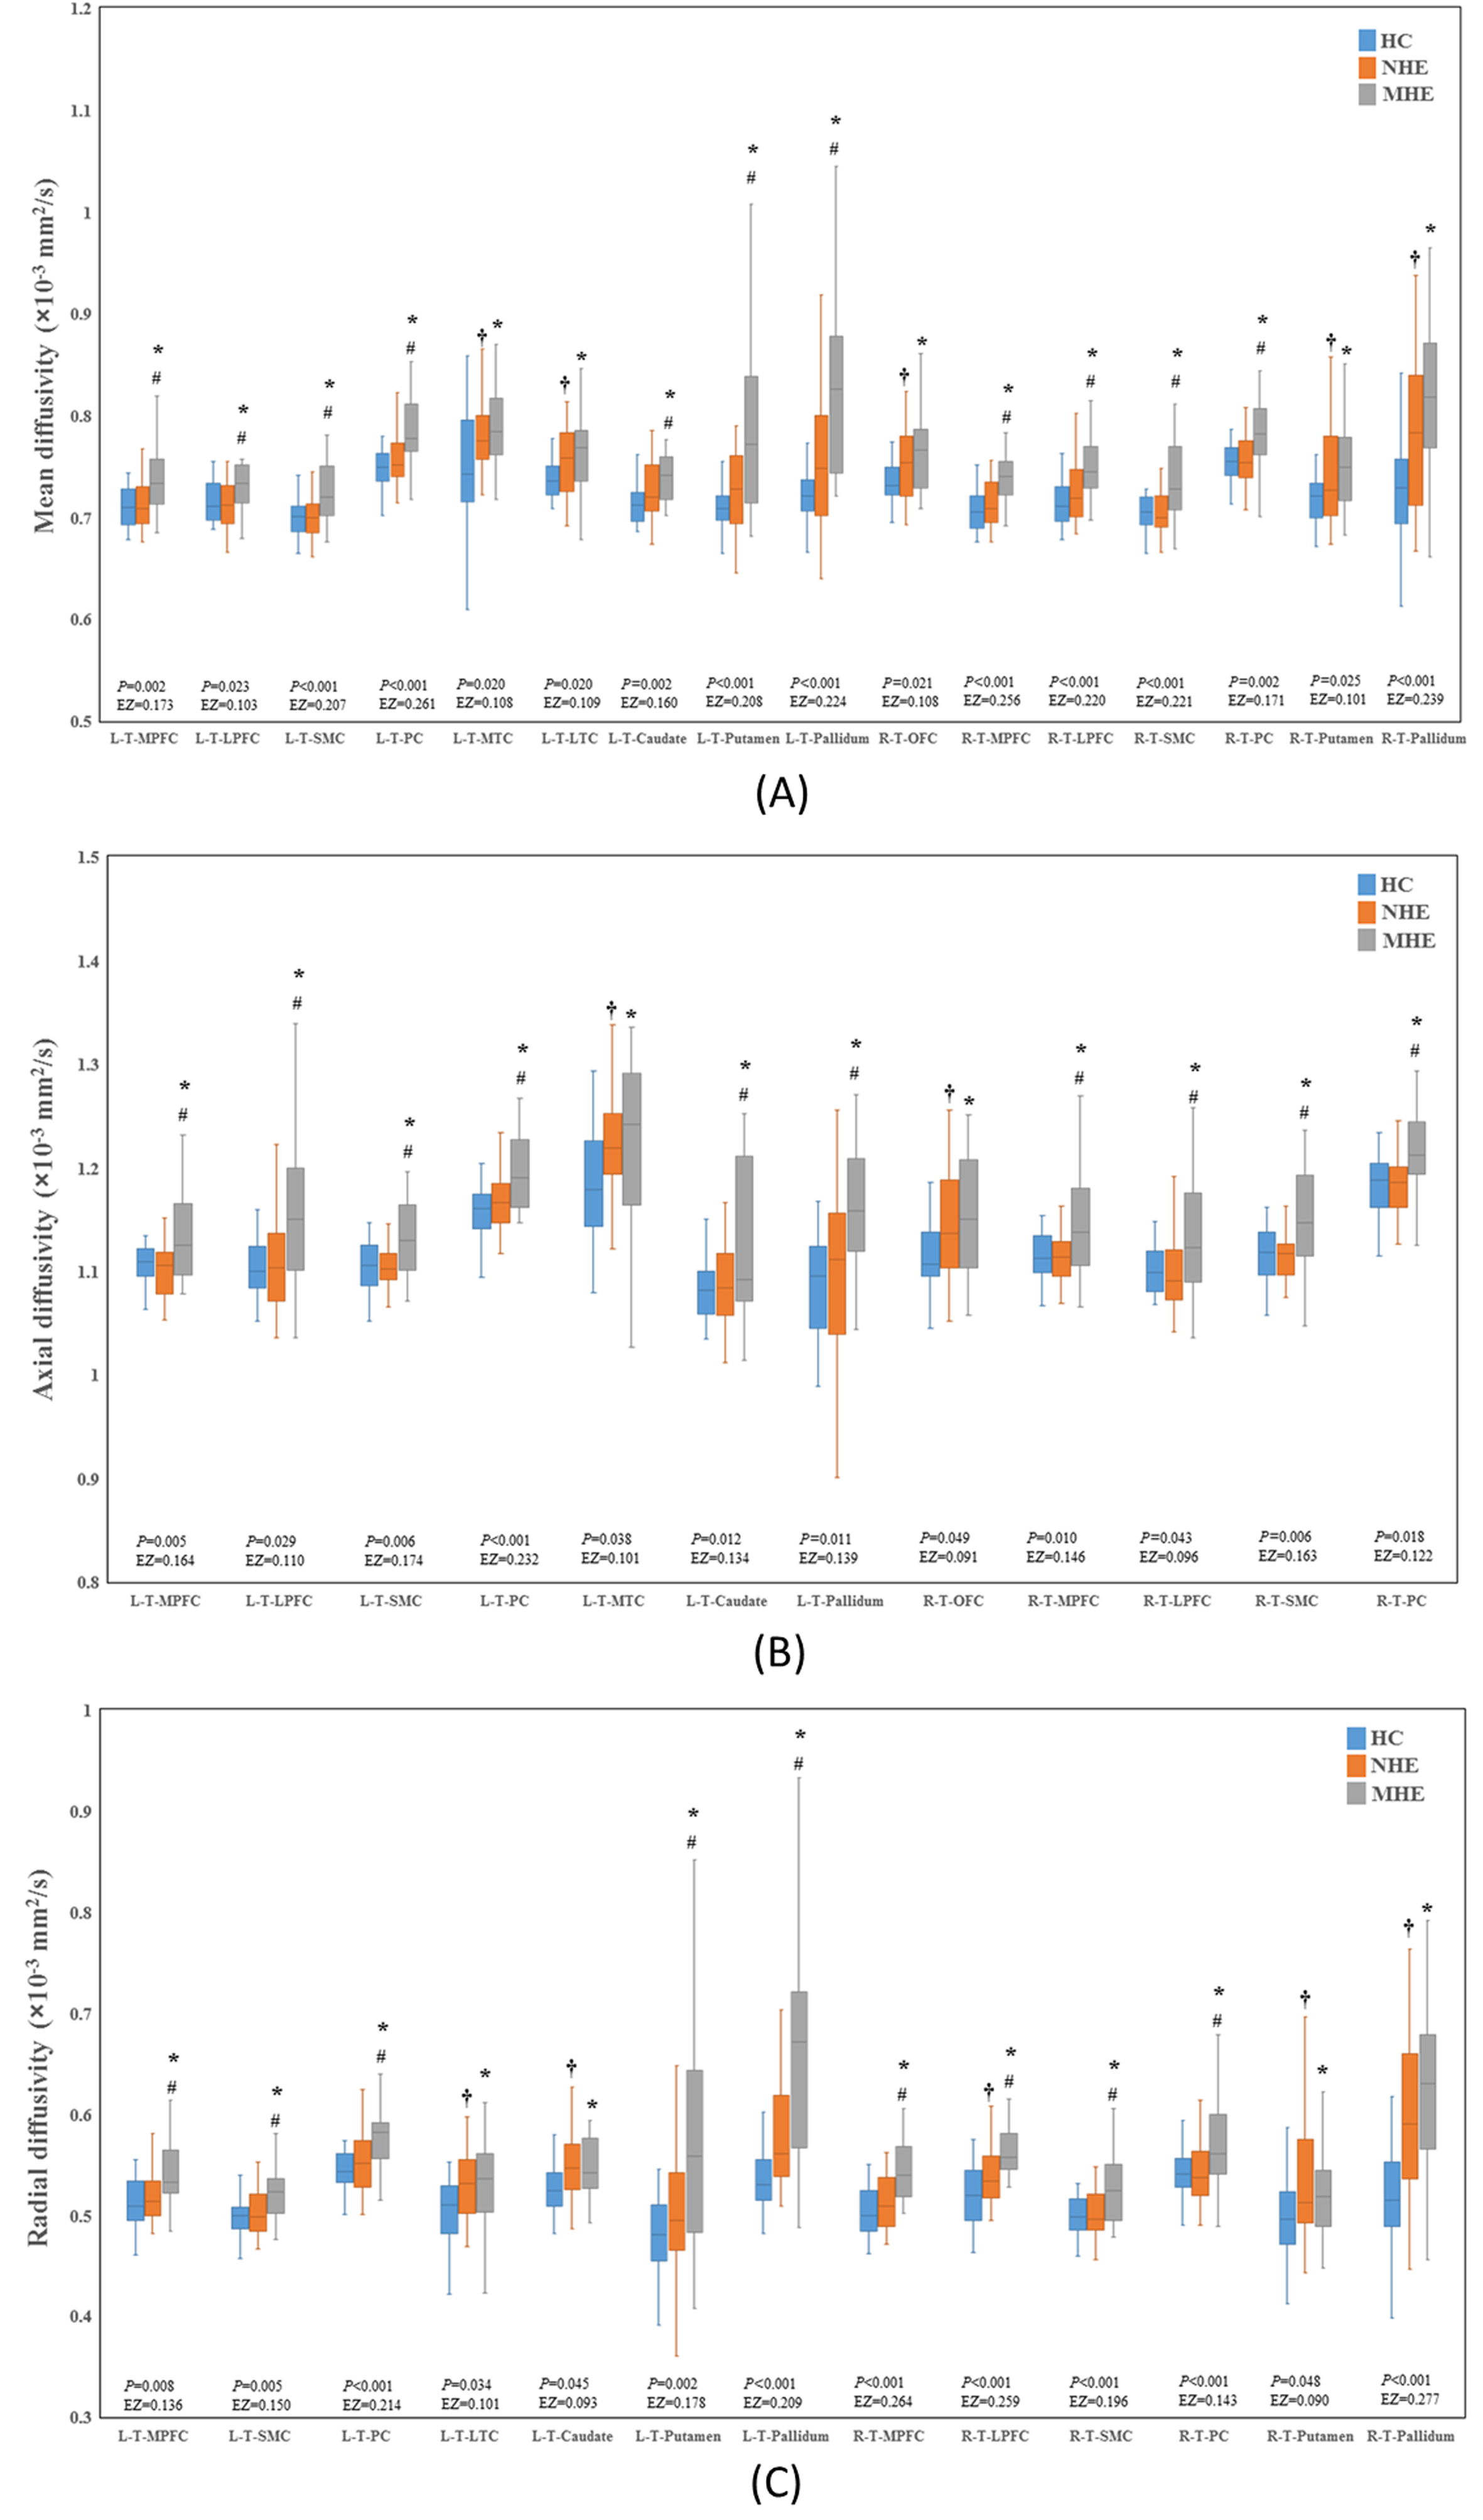
Figure 3 shows CS differences across three groups. Compared with HC, MHE patients had decreased CS in several fibers, including L-T-MPFC, L-T-LPFC, L-T-Putamen, L-T-Hippocampus, R-T-OFC, R-T-Putamen, and R-T-Amygdala. Meanwhile, compared with HC, MHE patients showed decreased FA along the following fiber, including L-T-Putamen, L-T-Pallidum, R-T-MPFC, R-T-LPFC, R-T-Caudate, and R-T-Pallidum (Figure 4). It is noted that, a stepwise reduction of both CS and FA was observed from NHE to MHE.Figure 5-A shows the increased MD in MHE patients , which involved the a set of fibers, including L-T-MPFC, L-T-LPFC, L-T-SMC, L-T-PC, L-T-MTC, L-T-LTC, L-T-Caudate, L-T-Putamen, L-T-Pallidum, R-T-OFC, R-T-MPFC, R-T-LPFC, R-T-SMC, R-T-PC, R-T-Putamen, and R-T-Pallidum. Also, Figures 5-B and 5-C show the AD and RD increment in MHE. The involvement of fibers with increased AD or RD was very similar to that with increased MD. Notably, a progressive change of MD, AD, and RD was observed from NHE to MHE.
Thalamic connectivity abnormalities correlated with patients’ impaired neuropsychological performance.
In machine learining classification analyses, the relatively high accuracy of 0.807 (with sensitivity = 0.866 and specificity = 0.727) was obtained by using the CS index; while the moderate accuracy of 0.711 (with sensitivity = 0.766 and specificity = 0.636) was obtained by using the MD index. The application of FA, AD, and RD metrics did not yield good classification results.
Discussion
A decrease in FA accompanied by an increase in MD, AD and RD have been interpreted as the disruption of both axon and myelin18. On the one hand, loss of axons 19 and impaired axonal integrity(indicated by decreased axial kurtosis) 20 have been noted in cirrhotic patient. On the other hand, demyelination has been also demonstrated to play an important role in the mechanism of MHE 21,22. Taken together, a reduction in FA combined with increased MD, AD and RD may suggest impaired white matter microstructure in MHE, and may contribute to CS alteration. Moreover, the finding of decreased thalamic CS is consistent with previous studies revealing decreased thalamic functional connectivity12.Conclusion
Our results demonstrated the altered thalamic structural connectivity with both cortical and subcortical regions in MHE. The disturbed thalamic connectivity may underlie the mechanism about cognitive deficits in MHE and can serve as biomarker for diagnosis of MHE and monitoring disease progression.Acknowledgements
This study was funded by the grants from the National Natural Science Foundation of China (No.81501450), Fujian Provincial Science Fund for Distinguished Young Scholars (No. 2018J06023), Fujian Provincial Program for Distinguished Young Scholars (No.2017B023), and Fujian Provincial Health Commission Project for Scientific Research Talents (No.2018-ZQN-28).References
1. Dhiman RK, Saraswat VA, Sharma BK, et al. Minimal hepatic encephalopathy: consensus statement of a working party of the Indian National Association for Study of the Liver. J Gastroenterol Hepatol 2010;25:1029-41.
2. Ridola L, Nardelli S, Gioia S, et al. Quality of life in patients with minimal hepatic encephalopathy. World J Gastroenterol 2018;24:5446-5453.
3. Patidar KR, Thacker LR, Wade JB, et al. Covert hepatic encephalopathy is independently associated with poor survival and increased risk of hospitalization. Am J Gastroenterol 2014;109:1757-63.
4. Soffer D, Sherman Y, Tur-Kaspa R, et al. Acquired hepatocerebral degeneration in a liver transplant recipient. Acta Neuropathol 1995;90:107-11.
5. F. Butterworth R. Neuronal cell death in hepatic encephalopathy. Metab Brain Dis 2007;22:309-320.
6. Zhang LJ, Zheng G, Zhang L, et al. Disrupted small world networks in patients without overt hepatic encephalopathy: a resting state fMRI study. Eur J Radiol 2014;83:1890-9.
7. Zheng G, Zhang L, Zhang LJ, et al. Altered modular organization of functional connectivity networks in cirrhotic patients without overt hepatic encephalopathy. Biomed Res Int 2014;2014:727452.
8. Zheng G, Zhang LJ, Zhong J, et al. Cerebral blood flow measured by arterial-spin labeling MRI: a useful biomarker for characterization of minimal hepatic encephalopathy in patients with cirrhosis. Eur J Radiol 2013;82:1981-8.
9. Montoliu C, Gonzalez-Escamilla G, Atienza M, et al. Focal cortical damage parallels cognitive impairment in minimal hepatic encephalopathy. Neuroimage 2012;61:1165-75.
10. Lu CQ, Jiao Y, Meng XP, et al. Structural change of thalamus in cirrhotic patients with or without minimal hepatic encephalopathy and the relationship between thalamus volume and clinical indexes related to cirrhosis. Neuroimage Clin 2018;20:800-807.
11. Chen HJ, Jiang LF, Sun T, et al. Resting-state functional connectivity abnormalities correlate with psychometric hepatic encephalopathy score in cirrhosis. Eur J Radiol 2015;84:2287-95.
12. Qi R, Zhang LJ, Zhong J, et al. Disrupted thalamic resting-state functional connectivity in patients with minimal hepatic encephalopathy. Eur J Radiol 2013;82:850-6.
13. Behrens TE, Johansen-Berg H, Woolrich MW, et al. Non-invasive mapping of connections between human thalamus and cortex using diffusion imaging. Nat Neurosci 2003;6:750-7.
14. Zhang D, Snyder AZ, Shimony JS, et al. Noninvasive functional and structural connectivity mapping of the human thalamocortical system. Cereb Cortex 2010;20:1187-94.
15. Marenco S, Stein JL, Savostyanova AA, et al. Investigation of anatomical thalamo-cortical connectivity and FMRI activation in schizophrenia. Neuropsychopharmacology 2012;37:499-507.
16. Xia S, Li X, Kimball AE, et al. Thalamic shape and connectivity abnormalities in children with attention-deficit/hyperactivity disorder. Psychiatry Res 2012;204:161-7.
17. Behrens TE, Johansen-Berg H, Woolrich MW, et al. Non-invasive mapping of connections between human thalamus and cortex using diffusion imaging. Nat Neurosci 2003;6:750-7.
18. Madden DJ, Bennett IJ, Burzynska A, et al. Diffusion tensor imaging of cerebral white matter integrity in cognitive aging. Biochim Biophys Acta 2012;1822:386-400.
19. Matsusue E. Cerebral cortical and white matter lesions in chronic hepatic encephalopathy MRpathologic correlations. 2005.
20. Chen HJ, Liu PF, Chen QF, et al. Brain Microstructural Abnormalities in Patients With Cirrhosis Without Overt Hepatic Encephalopathy: A Voxel-Based Diffusion Kurtosis Imaging Study. AJR Am J Roentgenol 2017;209:1128-1135.
21. Atluri DK, Prakash R, Mullen KD. Pathogenesis, diagnosis, and treatment of hepatic encephalopathy. J Clin Exp Hepatol 2011;1:77-86.
22. McTigue DM, Tripathi RB. The life, death, and replacement of oligodendrocytes in the adult CNS. J Neurochem 2008;107:1-19.
Figures