1665
Fully Automated Intracranial Vessel Angiogram Segmentation from 4D flow MRI Data in Intracranial Stenosis Patients using Deep Learning1Lurie Children's Hospital of Chicago, Chicago, IL, United States, 2Northwestern University, Chicago, IL, United States
Synopsis
We developed and validated a convolutional neural network for the fully automated 3D segmentation of the cerebral vasculature from 4D flow MRI for rapid flow analysis. Using 53 4D flow MRI scans, including 16 patients with intracranial atherosclerotic disease, we trained and tested our CNN using 10-fold cross validation. We assessed net flow and peak velocities across all of the major arteries and veins of the intracranial vasulature between automated and manually performed analysis. Across all metrics and regions, we found the automated segmentation showed excellent agreement with the manual, while taking a fraction of the time to perform.
Introduction
4D flow MRI provides a comprehensive assessment of hemodynamics through the 3D visualization and quantification of blood flow. Recent studies have shown that quantitative analysis of intracranial blood flow is important for the understanding and management of a wide variety of diseases, such as intracranial atherosclerotic disease (ICAD) [1], intracranial aneurysms [2], and vascular malformations [3]. However, 4D flow MRI data analysis remains complex and requires cumbersome manual processing, especially 3D segmentation. In vascular diseases, the task of segmentation is even more difficult due to the increased velocity spectrum in the data or more complex vascular networks.Therefore, an accurate, automated segmentation algorithm would not only accelerate the process of obtaining hemodynamic quantification but also improve flow analysis reproducibilty and reliability. In this study, we developed and validated a convolutional neural network (CNN) for the fully automated 3D segmentation of the cerebral vasculature from 4D flow MRI data for hemodynamic quantifications.Methods
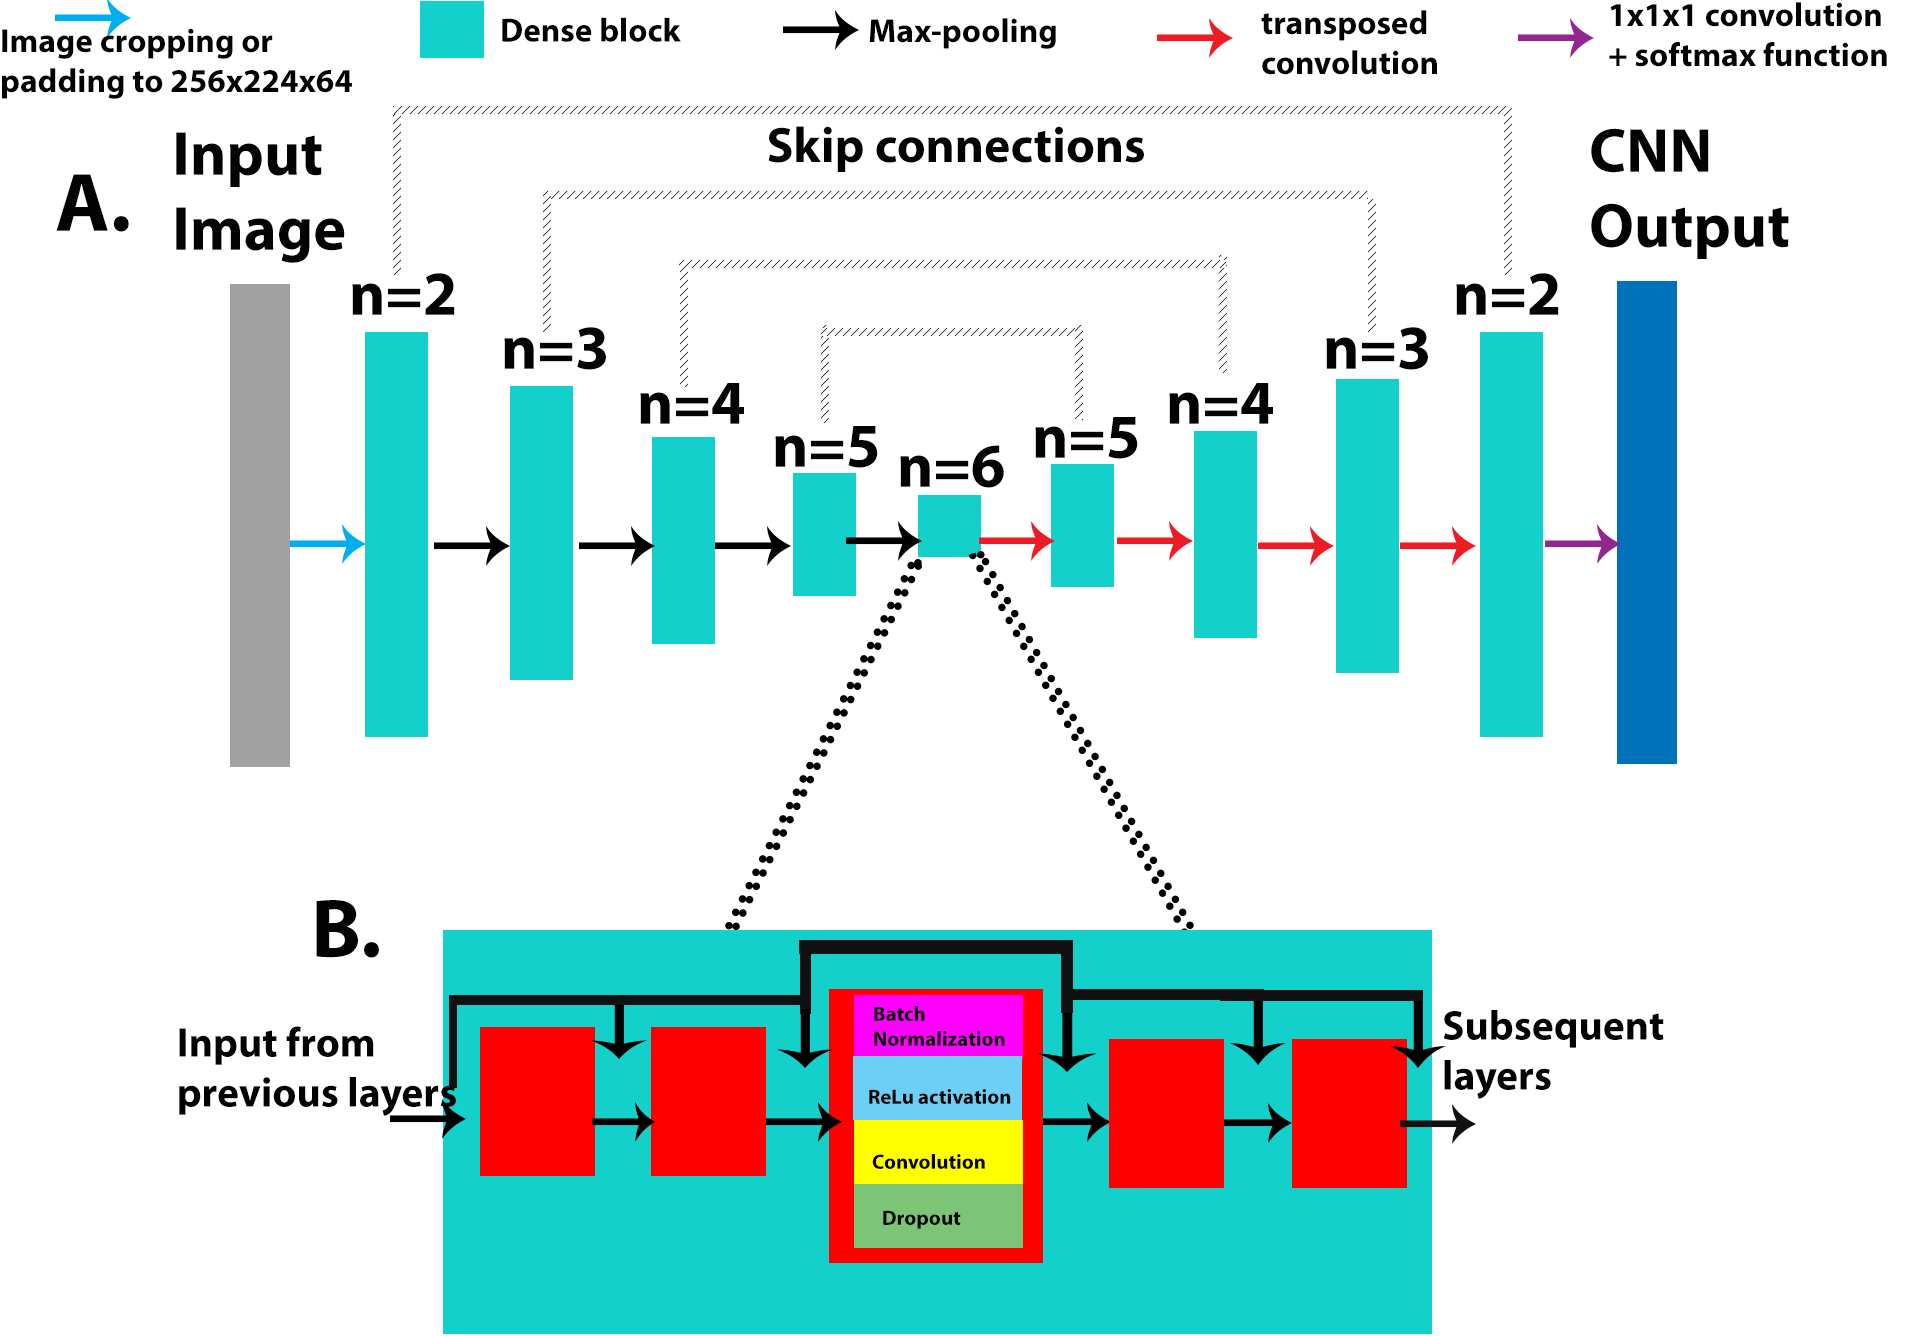
In this retrospective study, we used 53 intracranial 4D Flow scans from 37 healthy control subjects (20 male, 55.8±3.9 years) and 16 ICAD patients (12 male, 61.6±13.7 years, 7 with severe stenosis) acquired on a 3T system (Aera, Siemens, spatial resolution = 0.98-1.2mm3, temporal resolution=42.7-86.8ms, venc=50-60/100-120cm/s). All 4D flow MRI data was preprocessed based on a standard workflow [4] to generate 4D flow MRI derived 3D phase-contrast MR angiograms (PCMRA). The PCMRAs were used as a basis to conduct a manual 3D segmentation of the cerebral vasculature using commercial software (Mimics, Materialise, Belgium). The 3D PC-MRA data were stacked into a 3D array and used as the input for the CNN. The manually obtained 3D segmentations were used as the ground truth when training. A 10-fold cross-validation method was used to assess the performance of the CNN and generate an automated segmentation for each dataset.The CNN used for this study has been described before [5] and uses a 3D Unet architecture, with the DenseNet blocks replacing the convolution layers from the original implementation (Figure 1A) [6, 7]. Each DenseNet block consisted of a series of batch normalization, a linear rectified unit, and 3D convolutions, with the concatenation of feature maps after every convolution layer (Figure 1B). A dropout rate of 0.1 was applied after every convolution layer in order to prevent overfitting and a growth rate (convolution channel size) of 12 was used for all convolution layers in each DenseNet block. An Adam optimizer was used, and the learning rate was kept constant at 0.0001 (Figure 1).
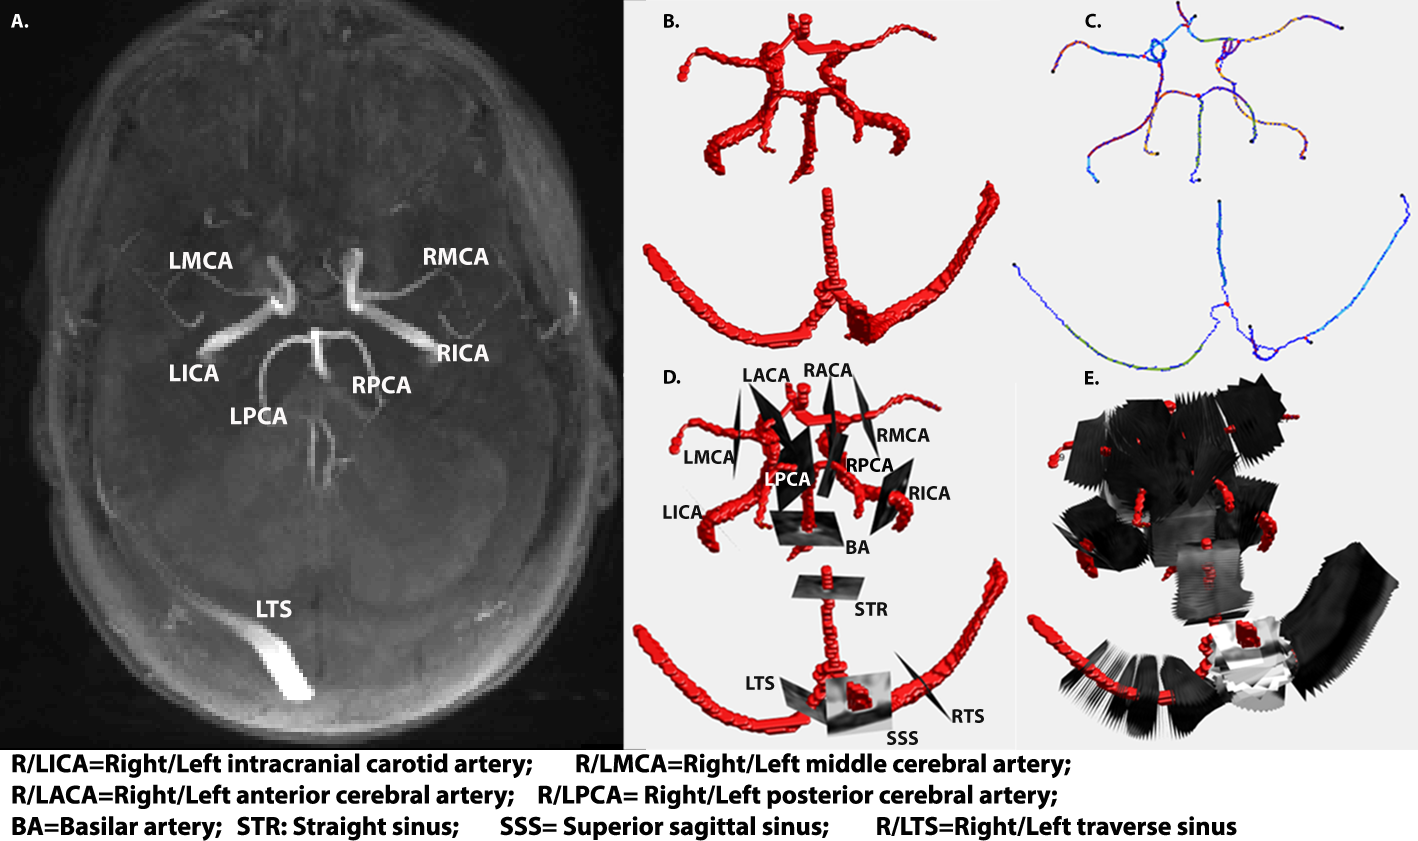
For hemodynamic quantifications, net flow and peak velocity was calculated using a custom tool built in Matlab [1]. Centerlines were generated for all arterial branches and venous sinuses. Perpendicular 2D planes were placed on the centerline set 1mm equidistant from one another (figure 2C, D, E). Net flow and peak velocity were obtained from each plane and the median and interquartile range were reported for each of the arterial branches and veins. The same planes and centerlines were used for both the manual and automated segmentations.
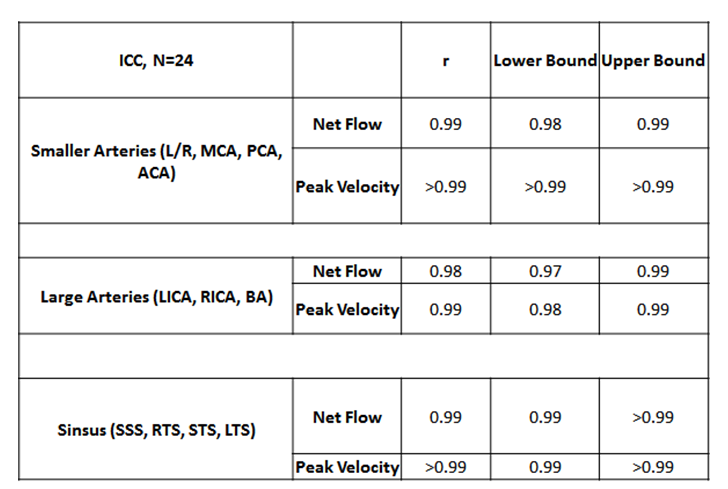
Dice scores were calculated to compare the manual and automated segmentations. Additionally, Bland-Altman and interclass correlations (ICC) were performed on the net flow and peak velocities for N=24 subjects (10 ICAD patients and 14 controls).
Results
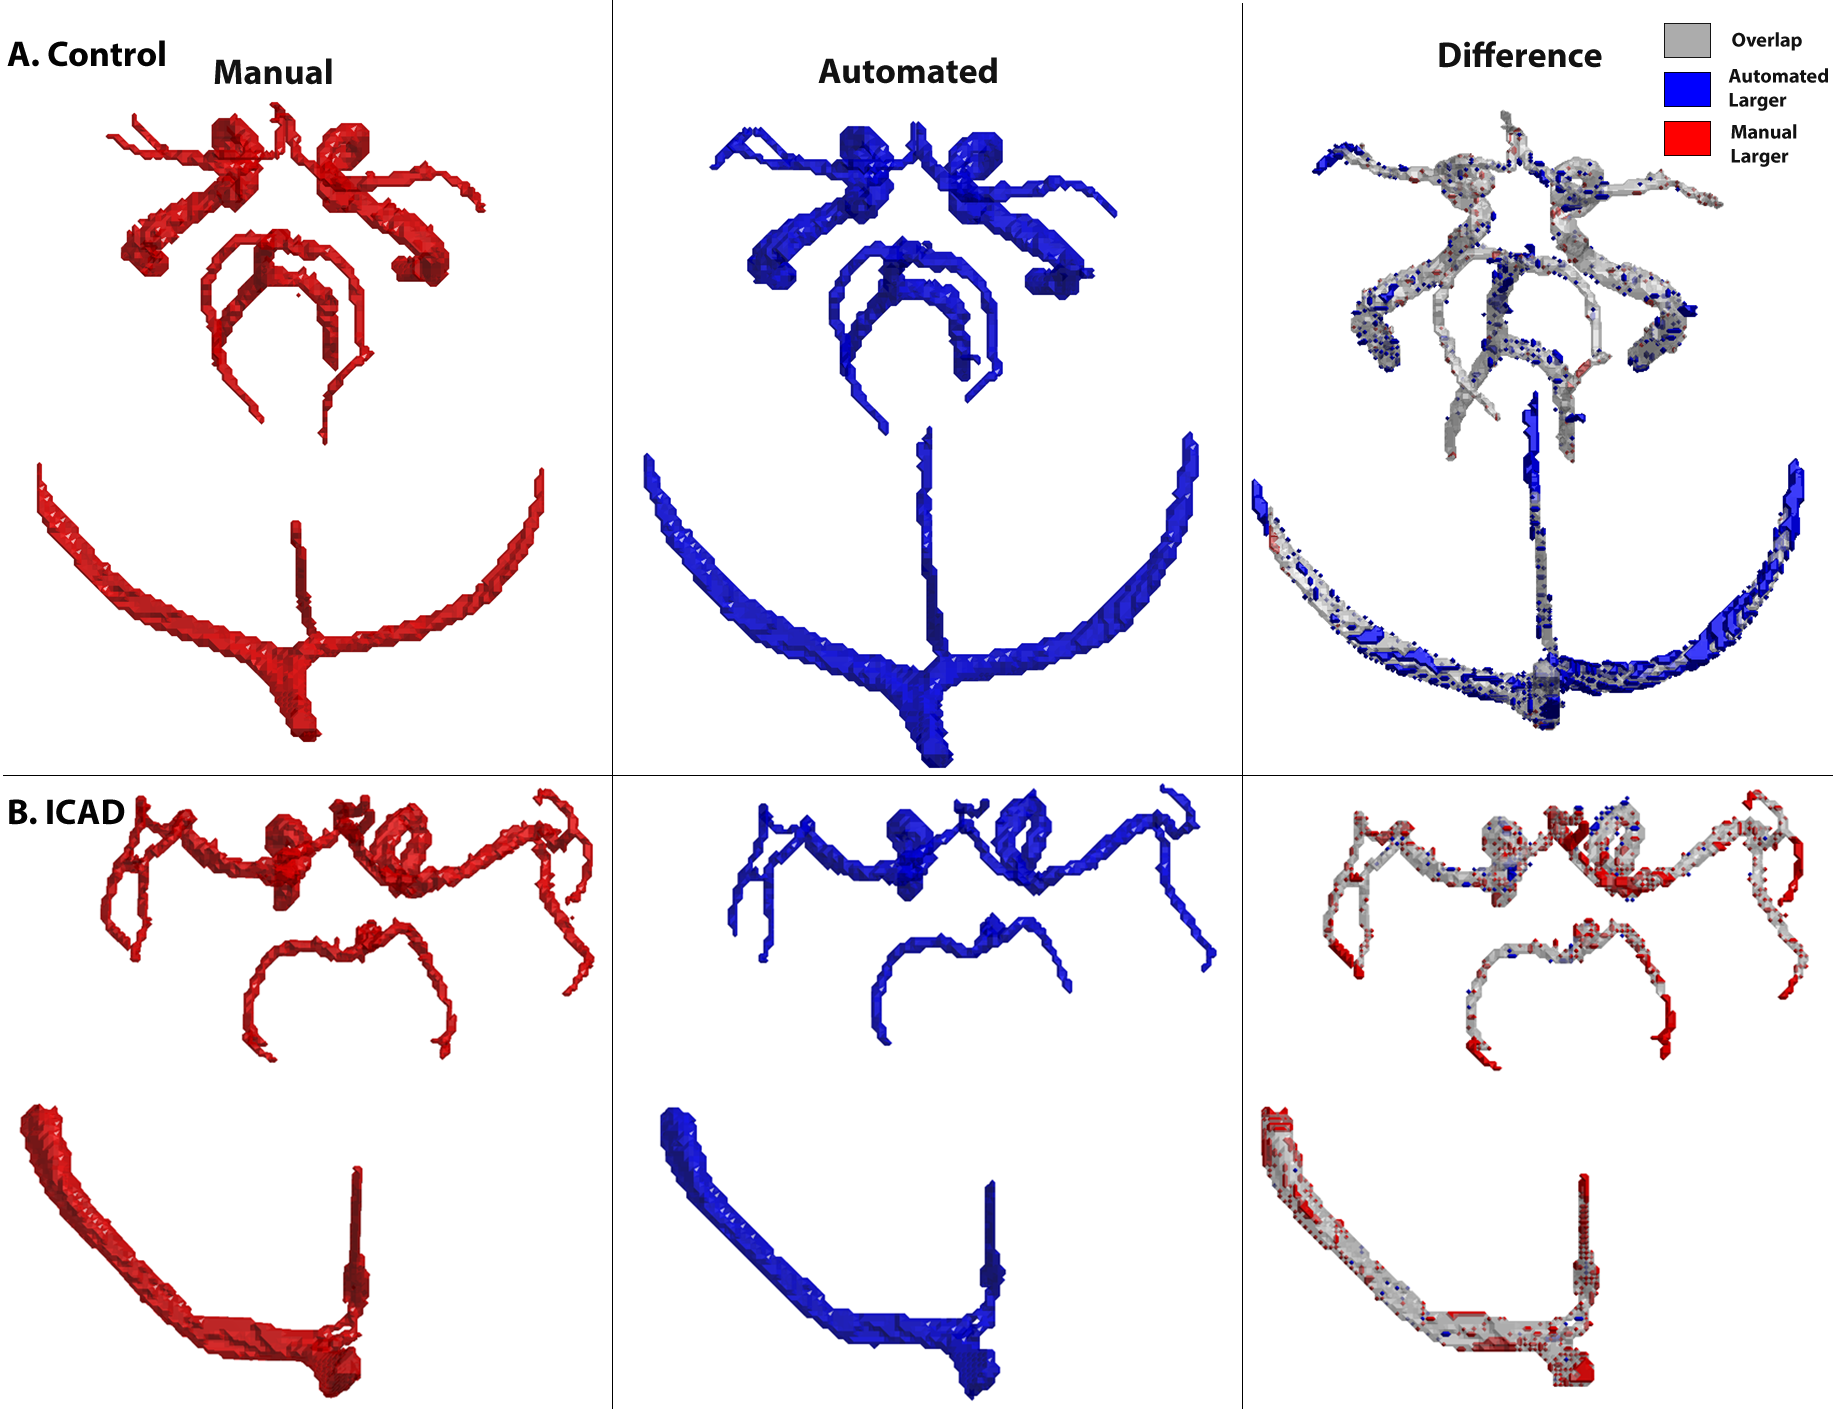
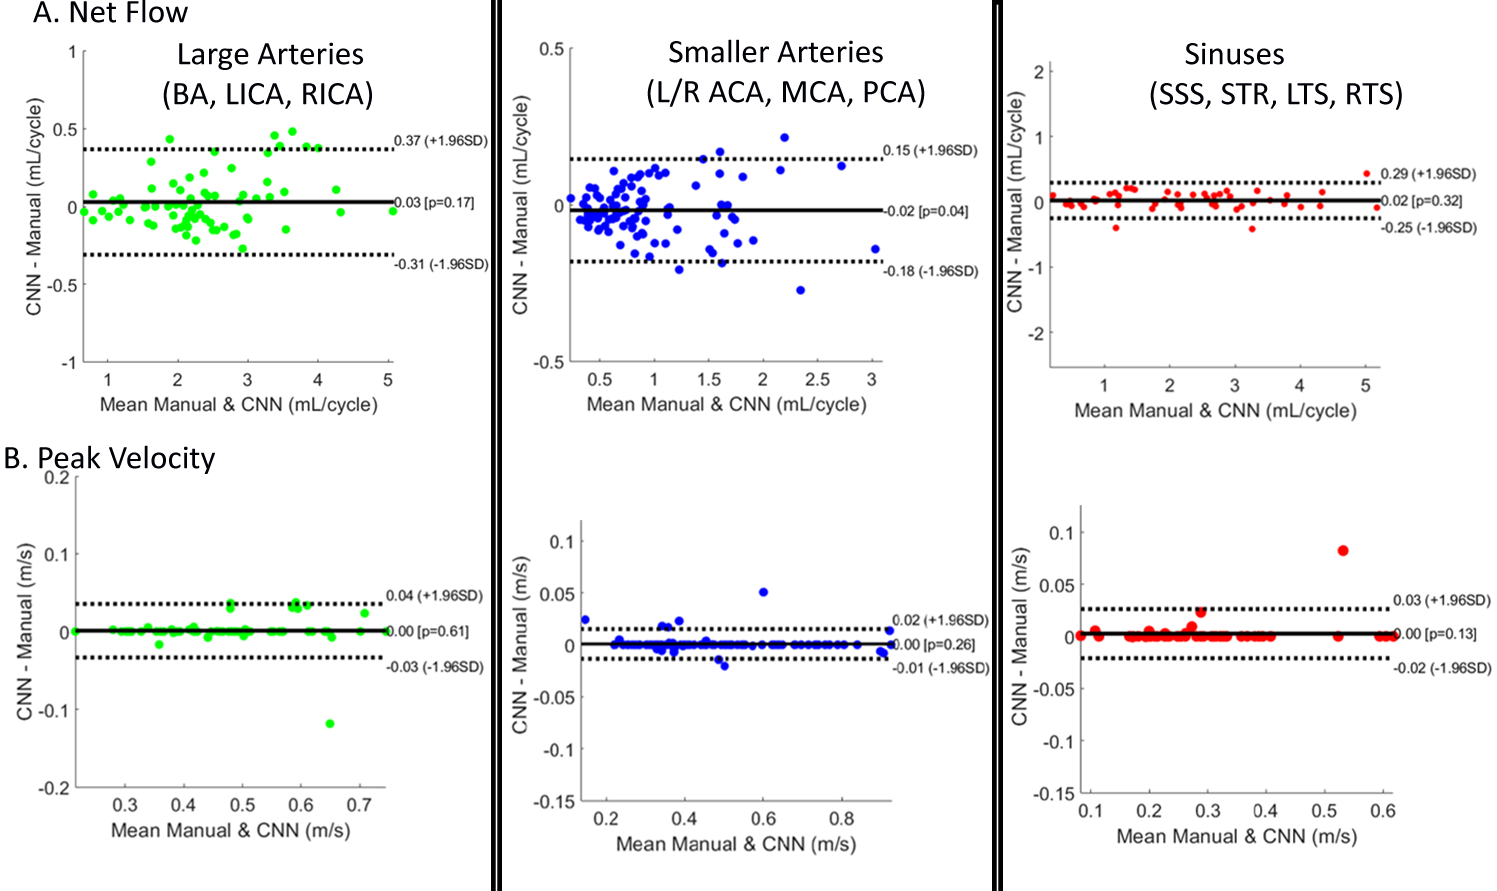
The CNN took 2.16±0.46 seconds to perform one segmentation compared to 10-40 minutes manually. The average Dice score for the entire cohort was 0.82 ± 0.04. Figure 3 provides examples of the manual (red) and automated (blue) segmentations as well as a difference map between them for a control (A) and ICAD patient (B), both obtaining a Dice score of 0.84 and 0.83 respectively. Figure 4 and Table 1 provide the Bland-Altman plots and ICC values for a subgroup of the cohort (N=24) at the large arteries (BA, LICA, RCA), smaller arteries (L/R MCA, PCA, ACA), and veins (SSS, LTS, RTS, STR). The median net flow for the large arteries are manual: 2.26 mL [1.78-2.91], automated: 2.21 mL [1.88-2.89], and for peak velocity, manual: 0.47 m/s [0.38-0.57], automated: 0.48 m/s [0.38-0.57]. For the smaller arteries, the median net flow is manual: 0.84 mL [0.60-1.15], automated: 0.80 mL [0.59-1.13], and median peak velocity is manual: 0.45 m/s [0.34-0.55], automated: 0.45 m/s [0.35-0.55]. And for the sinuses, the median net flow is manual: 2.16mL [1.11-3.03], automated: 2.13 mL [1.15-2.96], and for peak velocity, manual: 0.26 m/s [0.20-0.33], automated: 0.27 m/s [0.20-0.33]. The Bland-Altman plots show a low bias (0-0.3) and moderate limits of agreement (13-15% difference from the mean manual quantifications). For ICC, the correlation between the automated to the manual segmentations showed excellent agreement across all regions (all >0.98).Discussion
We developed a CNN for the fully automated segmentation of the cerebral vasculature from 4D flow MRI, showing strong net flow and peak velocity agreement with manual segmentations. Dice scores were found to be very sensitive to differences in intracranial segmentation as a result of the vasculature being a few voxels wide, providing a small overall area for overlap between the segmentations. Thus Dice scores may not be the best metric to assess segmentation performance in the intracranial vasculature. Future directions of this study include cohort expansion to further explore model performance.Acknowledgements
R01 HL117888
R21NS106696
F30 HL140910
T32 GM815229
AHA 16SDG30420005
References
1. Vali, A., et al., Semi-automated analysis of 4D flow MRI to assess the hemodynamic impact of intracranial atherosclerotic disease. Magn Reson Med, 2019. 82(2): p. 749-762. DOI: 10.1002/mrm.27747.
2. Amili, O., et al., Hemodynamics in a giant intracranial aneurysm characterized by in vitro 4D flow MRI. PLoS One, 2018. 13(1): p. e0188323. DOI: 10.1371/journal.pone.0188323.
3. Aristova, M., et al., Standardized Evaluation of Cerebral Arteriovenous Malformations Using Flow Distribution Network Graphs and Dual-venc 4D Flow MRI. J Magn Reson Imaging, 2019. DOI: 10.1002/jmri.26784.
4. Dyverfeldt, P., et al., 4D flow cardiovascular magnetic resonance consensus statement. J Cardiovasc Magn Reson, 2015. 17: p. 72. DOI: 10.1186/s12968-015-0174-5.
5. Berhane, H., et al., Artificial intelligence-based fully automated 3D segmentation of the aorta from 4D flow MRI. SMRA2019, 2019.
6. Çiçek, Ö., et al. 3D U-Net: Learning Dense Volumetric Segmentation from Sparse Annotation. 2016. Cham: Springer International Publishing.
7. Huang, G., et al., Densely Connected Convolutional Networks. 2017 IEEE Conference on Computer Vision and Pattern Recognition (CVPR), 2017. DOI: 10.1109/cvpr.2017.243.
Figures