1663
Using Arterial Spin Labelling to measure cerebral blood flow during sleep1University of Sussex, Brighton, United Kingdom, 2Department of Neuroscience BSMS, University of Sussex, Brighton, United Kingdom, 3CUBRIC, University of Cardiff, Cardiff, United Kingdom
Synopsis
Cerebral blood flow during awake and pharmacologically induced sleep was investigated with arterial spin labeling imaging in healthy young volunteers. Participants were scanned after a good night sleep and in a separate session after 24h sleep deprivation. Participant received 10mg Zolpidem after the sleep deprivation to maximize sleep in the scanner. There was a significant reduction in cerebral blood flow in the sleep condition compared to awake. The most prominent changes were observed in the Thalamus, cerebellum, posterior cingulate gyrus, these areas stayed significant after family wise error correction at a cluster level.
Introduction
Sleep and sleep-like states are highly conserved across both mammalian and non-mammalian species including Drosophila and roundworms (Caenorhabditis elegans) indicating that sleep is a fundamental biological process [1]. In humans, even modest periods of sleep deprivation can negatively impact cognitive and physical performance and emotion regulation. When chronic, sleep deprivation/ disturbance can increase stress hormones, increase blood pressure and impair immunity and increase the risk of a range of somatic illness [2]. However, despite the primacy of sleep to organism health and survival we are yet to fully understand the metabolic and biophysical changes attributed to it.According to a leading contemporary paradigm in sleep theory, sleep regulation can be subdivided into two interacting processes: 1. Homeostatic process (sleep debt that increases with the time being awake) and 2. Processes controlled by circadian pacemakers (~24h self-sustained oscillator) [3]. The synaptic homeostasis hypothesis proposes that during wakefulness synaptic strengthening occurs due to learning and experience (increased synaptic activity and metabolic need). In contrast, during deep sleep synaptic downscaling occurs with spontaneous neural activity serving to restore cellular homeostasis [4]. According to this theory cerebral metabolic rate and cerebral blood flow (CBF) should be lower during sleep than awake.
In support of this theory, Strømstad et al. used Arterial Spin Labeling (ASL) to show a global increase in cerebral blood flow (rCBF) from morning to evening which subsequently decreased after a night of sleep [5]. These effects were particularly prominent in the bilateral thalamus, hippocampus and amygdala and in the occipital and sensorimotor cortices. Furthermore, they reported that 23h sleep deprivation led to increased CBF in bilateral medial occipital and parietal cortices and decreases in bilateral thalamus [5].
The aim of our current study was to extend these findings and investigate how CBF changes during the early stages of sleep. Of note, though previous studies have investigated CBF changes during sleep using water PET, to our knowledge none have investigated these changes using ASL.
Methods
Nine healthy participants (6 male and 3 female, mean age 23.1± 2.5) were scanned in two separate sessions. In one session participants were instructed to arrive at the imaging centre well rested after a full night’s sleep. In the other, they were required to remain awake all night and were then given Zolpidem 10mg half an hour before the scheduled MRI scan to maximize sleep during the scanning session. Session order was counterbalanced across participants. Participants were asked to avoid caffeinated beverages for 10h prior to each scan. All scans took place between 09:30 and 10:30.During scanning, respiratory and heart rate were continuously monitored using a respiration belt (Biopac) and pulse oxymeter respectively (Nonin 8600FO) and data recorded with Biopac AcqKnowledge 5 software. Participants were also required to maintain light pressure on a button box which served to detect muscle relaxation that occurs at the onset of sleep. Button box responses were recorded and plotted in real time using a custom Matlab code (MathWorks, Natick, Massachusetts, United States).
The MRI session included high-resolution T1-weighted volume (MPRAGE), diffusion MRI (not reported here) and arterial spin labeling with a post-labeling delay (PLD) of 1800 ms and labeling duration of 2000 ms. Relative cerebral blood flow (rCBF) maps were obtained from the average of 40 control/label pairs, and were co-registered with every participant’s MPRAGE. MPRAGE images were segmented in SPM12 to obtain probabilistic maps of grey and white matter and a partial volume correction algorithm [6] was then used to obtain grey matter maps of rCBF. The normalization parameters obtained from the segmentation were then used to warp these maps into MNI space. rCBF maps were then compared between sessions using a paired-sample t-test in SPM12.
Results
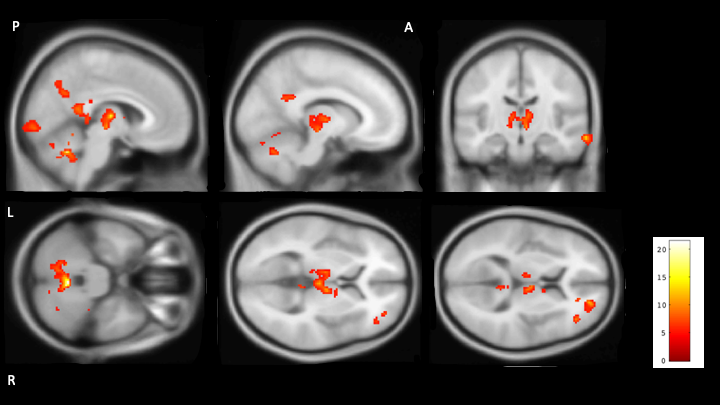
Seven of the nine participants reported sleeping for at least part of the scan. The two who did not report sleep during the scan were therefore excluded from further analysis. Figure 1 shows brain regions with significantly reduced CBF during sleep surviving stringent family wise error correction at p<0.05. Areas showing a significant reduction in CBF during sleep included Thalamus, part of right caudate cerebellum and some cortical areas: middle temporal gyrus, posterior cingulate, precentral gyri, precuneus, frontal and occipital pole.Discussion
We found a decrease in rCBF during early sleep in deep grey matter areas (including the thalamus) as well as the brain stem (not significant after FWE correction) and basal forebrain that are known to be involved in sleep regulation [7]. Furthermore, our findings are in good agreement with the established sleep imaging literature using H2[15]O PET, where sleep is associated with a global as well as local decrease in rCBF in central core structures, basal ganglia, cerebellum and cortical areas ([7, 8, 9, 10, 11].Conclusion
These initial ASL data suggest that ASL may be a sensitive technique for imaging changes in CBF during sleep (sleep onset). Comparable findings to those reported with H2[15]O PET suggest that ASL may be a valuable technique for assessing CBF during sleep.Acknowledgements
No acknowledgement found.References
[1] Zimmerman, J., Naidoo, N., Raizen, D. and Pack, A. (2008). Conservation of sleep: insights from non-mammalian model systems. Trends in Neurosciences, 31(7), pp.371- 376.
[2] Luyster, F., Strollo, P., Zee, P. and Walsh, J. (2012). Sleep: A Health Imperative. Sleep, 35(6), pp.727-734.
[3] Borbély, A., Daan, S., Wirz-Justice, A. and Deboer, T. (2016). The two-process model of sleep regulation: a reappraisal. Journal of Sleep Research, 25(2), pp.131-143.
[4] Tononi, G. and Cirelli, C. (2014). Sleep and the Price of Plasticity: From Synaptic and Cellular Homeostasis to Memory Consolidation and Integration. Neuron, 81(1), pp.12-34.
[5] Strømstad, M., Voldsbekk, I., Bjørnerud, A., Elvsåshagen, T. and Groote, I. (2017). Changes in cerebral blood flow after a day of waking and a night of sleep deprivation. Sleep Medicine, 40, p.e316.
[6] Asllani, I., Borogovac, A. and Brown, T. (2008). Regression algorithm correcting for partial volume effects in arterial spin labeling MRI. Magnetic Resonance in Medicine, 60(6), pp.1362-1371.
[7] Braun, A. R., Balkin, T. J., Wesensten, N. J., Carson, R. E., Varga,M., Baldwin, P., Selbie, S., Belenky, G. and Herscovitch, P.Regional cerebral blood fow throughout the sleep-wake cycle. An H215O PET study. Brain, 1997, 120: 1173-1197.
[8] Hofle, N., Paus, T., Reutens, D., Fiset, P., Gotman, J., Evans, A. C.and Jones, B. E. Regional cerebral blood flow changes as a function of delta and spindle activity during slow wave sleep in humans. J. Neurosci., 1997, 17: 4800-4808.
[9] Maquet, P., Degueldre, C., Delfiore, G., Aerts, J., Peters, J. M., Luxen , A. and Franck, G. Functional neuroanatomy of human slow wave sleep. J. Neurosci., 1997, 17: 2807-2812.
[10] Andersson, J. L. R., Onoe, H., Hetta, J., Lidstrom, K., Valind, S., Lilja, A., Sundin, A., Fasth, K. J., Westerberg, G., Broman, J. E.,Watanabe, Y. and Langstrom, B. Brain networks affected by synchronized sleep visualized by positron emission tomography. J. Cereb. Blood Flow Metab., 1998, 18: 701-715.
[11] Kajimura, N., Uchiyama, M., Takayama, Y., Uchida, S., Uema, T.,Kato, M., Sekimoto, M., Watanabe, T., Nakajima, T., Horikoshi,S., Ogawa, K., Nishikawa, M., Hiroki, M., Kudo, Y., Matsuda,H., Okawa, M. and Takahashi, K. Activity of midbrain reticular formation and neocortex during the progression of human non-rapid eye movement sleep. J. Neurosci., 1999, 19: 10065-10073.
Figures