1661
Toward the hemodynamic analysis of Moyamoya disease using ultra-fast DCE-MRI by GRASP1Human Brain Research Center, Graduate School of Medicine, Kyoto University, Kyoto, Japan, 2Department of Diagnostic Imaging and Nuclear Medicine, Kyoto University, Kyoto, Japan, 3Department of Neurosurgery, Kyoto University, Kyoto, Japan
Synopsis
One subject with Moyamoya disease was scanned with radial vibe sequence. GRASP reconstruction was performed using different number of spokes/frame. ROI-based analysis performed to compare the maximum slope for each ROI placed in the vessels showed that the faster imaging gave the larger slope, but the blurring at the corner of TIC is seen at the higher temporal resolution. By using images with 5 spokes/frame, voxel-by-voxel analysis could create the arrival map and the maximum slope map.
Introduction
Moyamoya disease (MMD) is one of the life-threatening vascular disease for both young subjects and aged subjects, which is characterized by a progressive constriction at the level of the circle of Willis. As a result, small arteries that compensate for the insufficient arterial supply (“Moyamoya” arteries) will develop. Discrepancy in visualization of the vasculature in MR imaging of MMD is seen between non-contrast enhanced time-of-flight (TOF) MRI and contrast-enhanced(CE)-MRI. Since TOF depends its contrast on the inflow of the blood, it cannot depict all of the small vessels that takes relatively a long time to travel. On the other hand, CE-MRI results in the enhancement of not only arteries but also vessels, which makes evaluation of the intracranial arteries difficult. Dynamic contrast-enhanced (DCE)-MRI could overcome shortcomings of both techniques. However, depiction of the Moyamoya arteries require high resolution imaging, which is challenging for DCE-MRI. Recently, Golden angle RAdial Sparse Parallel (GRASP) MRI has shown its ability to achieve both high spatial and high temporal imaging in the abdomen(1)(2) and the heart(3). By taking advantage of sophisticated sampling strategy using golden angle increment in k-space, GRASP enabled retrospective reconstruction with arbitrary temporal resolution(1). The purpose of this study was to evaluate its ability to characterize hemodynamics of Moyamoya disease. We compared images with different temporal resolution and evaluated its ability to depict changes in arterial and venous signal intensity over time using ROI-based and pixel-by-pixel based analysis.Methods: Experiments
Under the IRB approval, one subject with Moyamoya disease (31y.o, male) was scanned. Acquisition parameter for the radial vibe sequence was as follows. TR/TE(ms)=3.25/1.53, FA(degree)=6, BW(Hz/pixel)=890, FOV=270x270, base resolution=256, number of slices=52, slice thickness= 1mm, voxel size=1.1x1.1x1mm. Acquisition time=1min37sec with number of spokes=600. The subject was scanned with clinical 3T scanner (Skyra, Siemens, Erlangen, Germany) equipped with 32-channel head array coil. Radial vibe sequence preceded approximately 10 seconds before the administration of the contrast agent. The radial vibe sequence and image reconstruction program were provided from New York University based on C2P contract.Methods: Post-processing
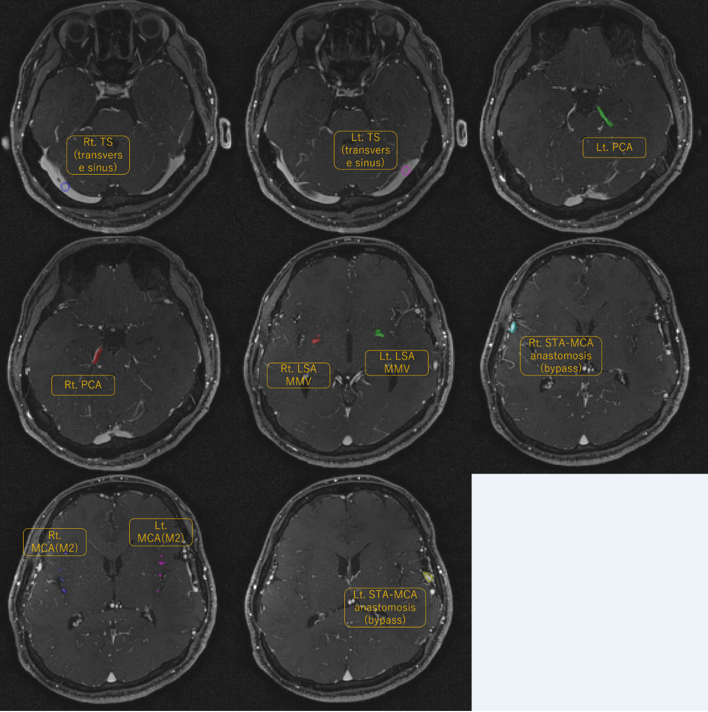
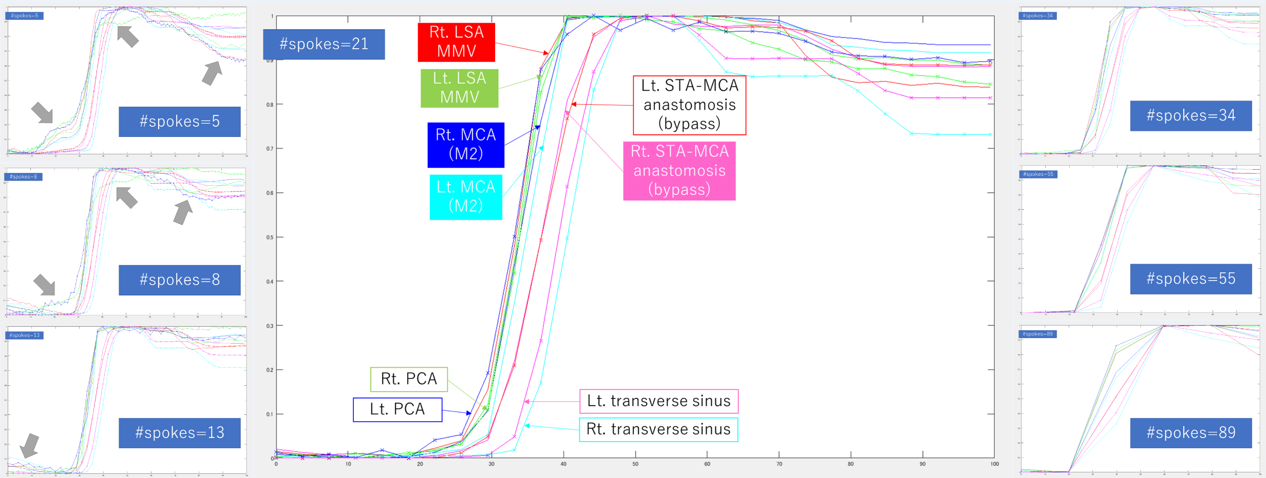
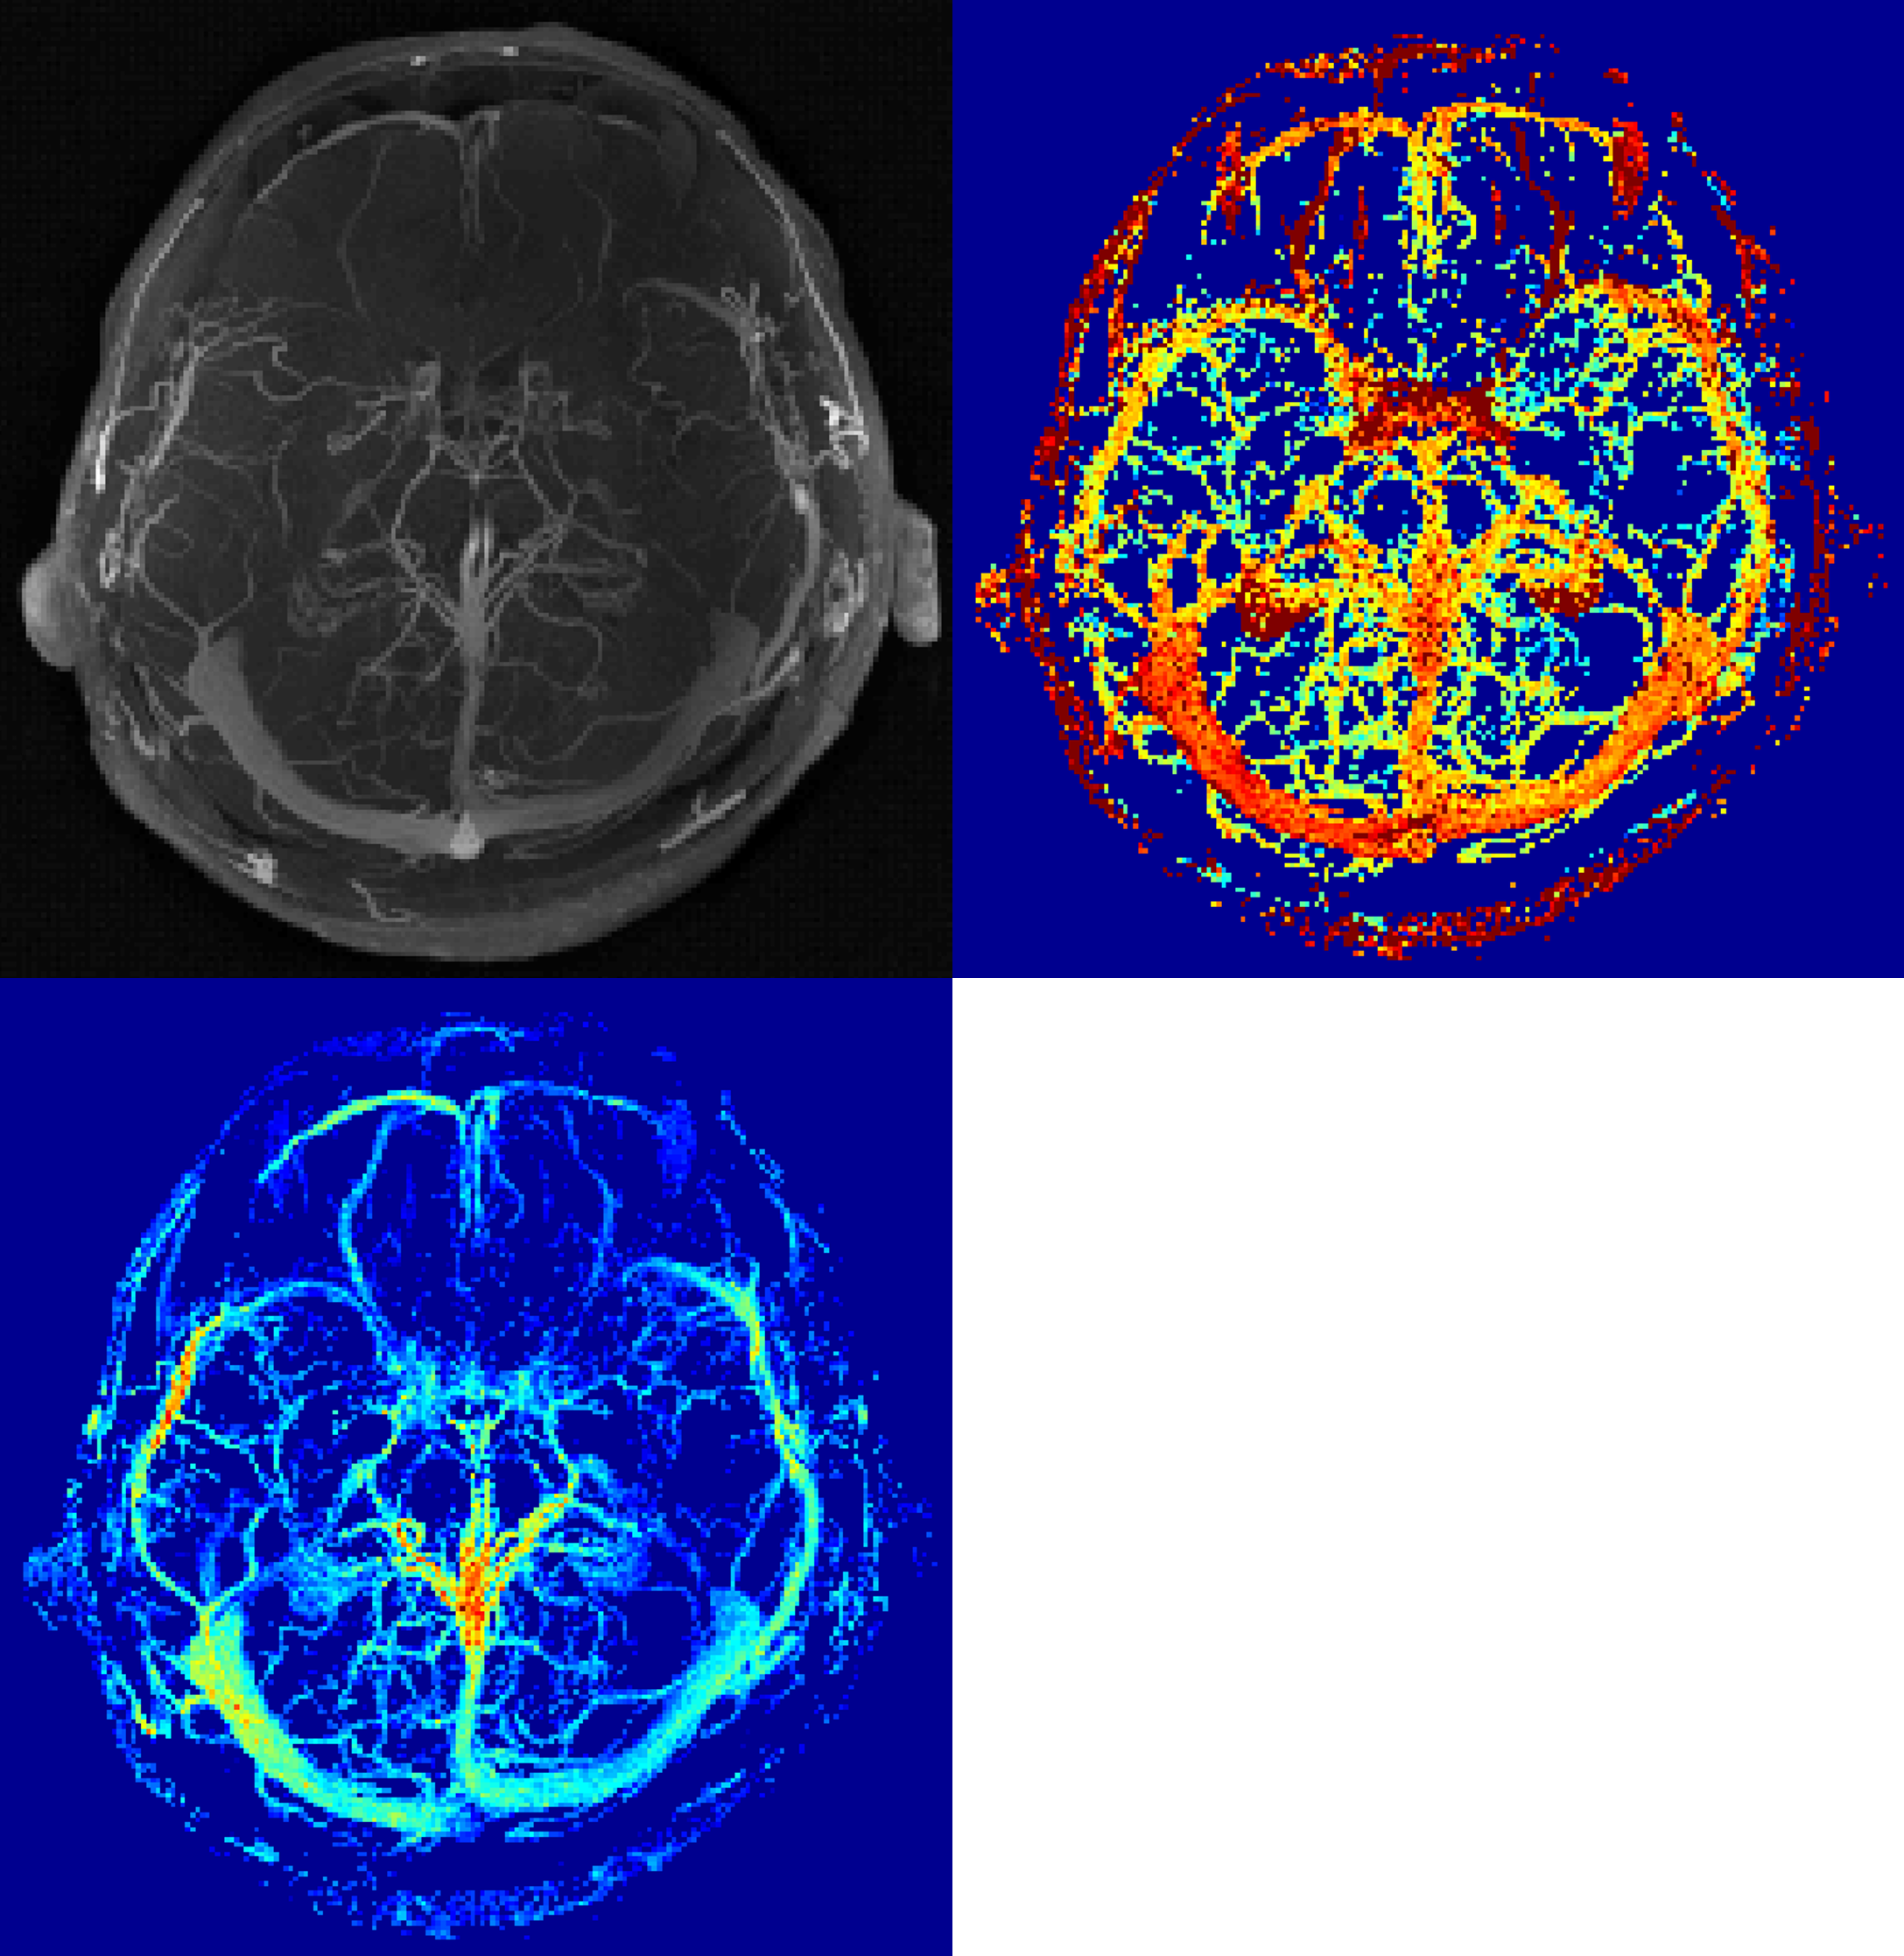
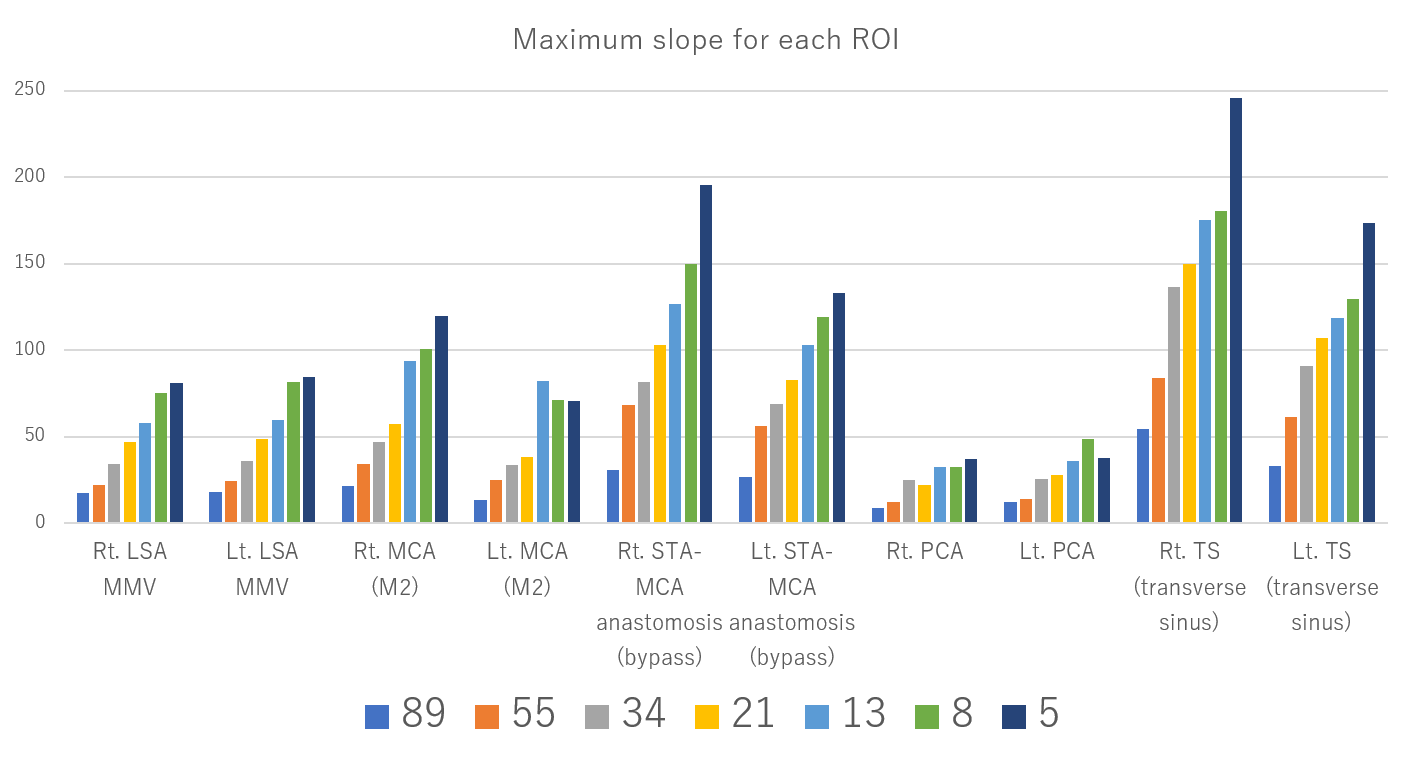
Images were reconstructed by using an offline reconstruction program in conjunction with Yarra framework(4). Temporal resolution of the reconstructed DCE-MRI was controlled by using a varying number of spokes. The number of spokes were chosen based on the Fibonacci number (i.e. 5,8,13,21,34,55,89). After the reconstruction, dicom images were processed with an in-house script using Matlab (Mathworks, Nattick, MA). ROI was placed at the main vessels (Figure1). As an ROI-based analysis, mean values for each ROI was taken for each time frame (Figure 2), and the maximum value of the slope (difference of the signal intensity for the adjacent time frame) was taken as the quantitative value to reflect the degree of arterial inflow for each ROI at each time frame. Maximum value of the slope (maximum slope) was compared for each temporal resolution. If the maximum slope reached plateau with respect to the increased temporal resolution, it was considered to reach sufficient temporal resolution to depict arterial vascular supply profile. Possible distortion of the signal in the temporal timeframe due to the compressed sensing (CS) reconstruction was also evaluated. As a voxel-based analysis, slope map and the arrival map were created (Figure 4). Four-dimensional images reconstructed with 8 spokes/frame was used for this analysis. Similar to the ROI-based analysis, slope map was calculated based on the maximum slope in each voxel. To create the arrival map, consecutive 10 frames of the 3D-volume (before arrival of the contrast media) was averaged over time and considered as a baseline image. In addition, the signals in the volume was averaged over the volume to obtain the global average baseline. Voxels those showed more than 2x enhancement compared with the baseline signal AND voxels those showed more than 2x signal of the global average baseline in the later phase was extracted as a candidate for the vascular voxel. For those voxels, maximum slope and its timepoint was used to calculate the initial timepoint to start being enhanced. For simplicity and for robustness, approximation of the linear increase in the enhancement curve was used (Figure 4).Results & Discussion
The result of the maximum slope for each temporal resolution was summarized in Figure 3. To the best of our knowledge, there is no previous report of applying GRASP for Moyamoya disease. As can be expected, the maximum slope increased as the number of spokes per each time frame decreased. The data from images with the number of spokes=5 resulted in the highest maximum slope for most of the vessels. However, time course data for each ROI showed blurring at the corner of the TIC (figure 2). This might be due to the over-regularization of the CS reconstruction. Therefore, optimization of the hyper-parameter for CS will be conducted in future study. On the other hand, voxel-by-voxel analysis using 5 spokes/frame could create (peak) slope map and arrival map by taking advantage of the very high temporal resolution (figure 4). Since we took the data at the maximum slope, blurring of the TIC seen in the ROI-based analysis is expected to have minimal effect.Conclusion
DCE-MRI with GRASP could depict the differences in the time course in the vessels in Moyamoya disease.Acknowledgements
We appreciate Dr. Kai Tobias Block for providing us radial-VIBE sequence and GRASP reconstruction code.References
1. Feng L, Grimm R, Block KT, Chandarana H, Kim S, Xu J, Axel L, Sodickson DK, Otazo R: Golden-angle radial sparse parallel MRI: combination of compressed sensing, parallel imaging, and golden-angle radial sampling for fast and flexible dynamic volumetric MRI. Magn Reson Med 2014;72:707-717
2. Chandarana H, Feng L, Block TK, Rosenkrantz AB, Lim RP, Babb JS, Sodickson DK, Otazo R: Free-breathing contrast-enhanced multiphase MRI of the liver using a combination of compressed sensing, parallel imaging, and golden-angle radial sampling. Invest Radiol 2013;48:10-16
3. Feng L, Axel L, Chandarana H, Block KT, Sodickson DK, Otazo R: XD-GRASP: Golden-angle radial MRI with reconstruction of extra motion-state dimensions using compressed sensing. Magn Reson Med 2016;75:775-788
4. Block KT, Sodickson DK. Yarra: An Open Software Framework for Clinical Evaluation of Reconstruction Prototypes. In ISMRM Workshop on Data Sampling and Image Reconstruction. Sedona, USA,
Figures