1652
One-stop-shop Carotid Pulse Wave Velocity (cPWV) Using a Single-slice 2D Phase-Contrast MRI1USC Stevens Neuroimaging and Informatics Institute, Keck School of Medicine, University of Southern California, Los Angeles, CA, United States, 2Department of Neurology, University of Southern California, Los Angeles, CA, United States, 3Siemens Medical Solutions USA Inc., Los Angeles, CA, United States
Synopsis
The association between increased cerebrovascular risk factors induced arterial stiffness, and age-related neurodegenerative disorders has been demonstrated in multiple studies. In this study, we evaluated the utility of single-slice two–dimensional (2D) phase-contrast MRI (PC-MRI) to assess arterial stiffness by calculating the carotid pulse wave velocity (cPWV) along the common carotid artery (CCA) and internal carotid arteries (ICA) within a single two-minute scan. Our results demonstrated the feasibility of cPWV measurement using single-slice 2D PC-MRI and indicated a positive correlation between cPWV and arterial damping factor. 2D PC-MRI-measured cPWV holds potential as biomarker to quantify age-related alterations in arterial stiffness.
Introduction
As a surrogate marker of arterial stiffness, elevated pulse wave velocity (PWV) is thought to be an important characteristic of vascular aging/dysfunction in neurodegenerative disorders such as Alzheimer’s disease and dementia1,2,3. While the utility of carotid-femoral PWV in quantifying central vascular compliance has been studied in various cardiovascular disorders, PWV measurement of cerebral arteries has not been investigated extensively. A few studies attempted to assess cerebroarterial PWV by collecting PC-MRI data at two arterial sites. However, the cardiac variations between separate scans and strict requirements for coil placement have limited the application of these techniques4. In this study, we proposed an alternative approach to assess carotid PWV (cPWV) by simultaneously acquiring flow velocity waveforms along the common carotid artery (CCA) and the internal carotid artery (ICA) using single-slice 2D PC-MRI within a single scan.Methods
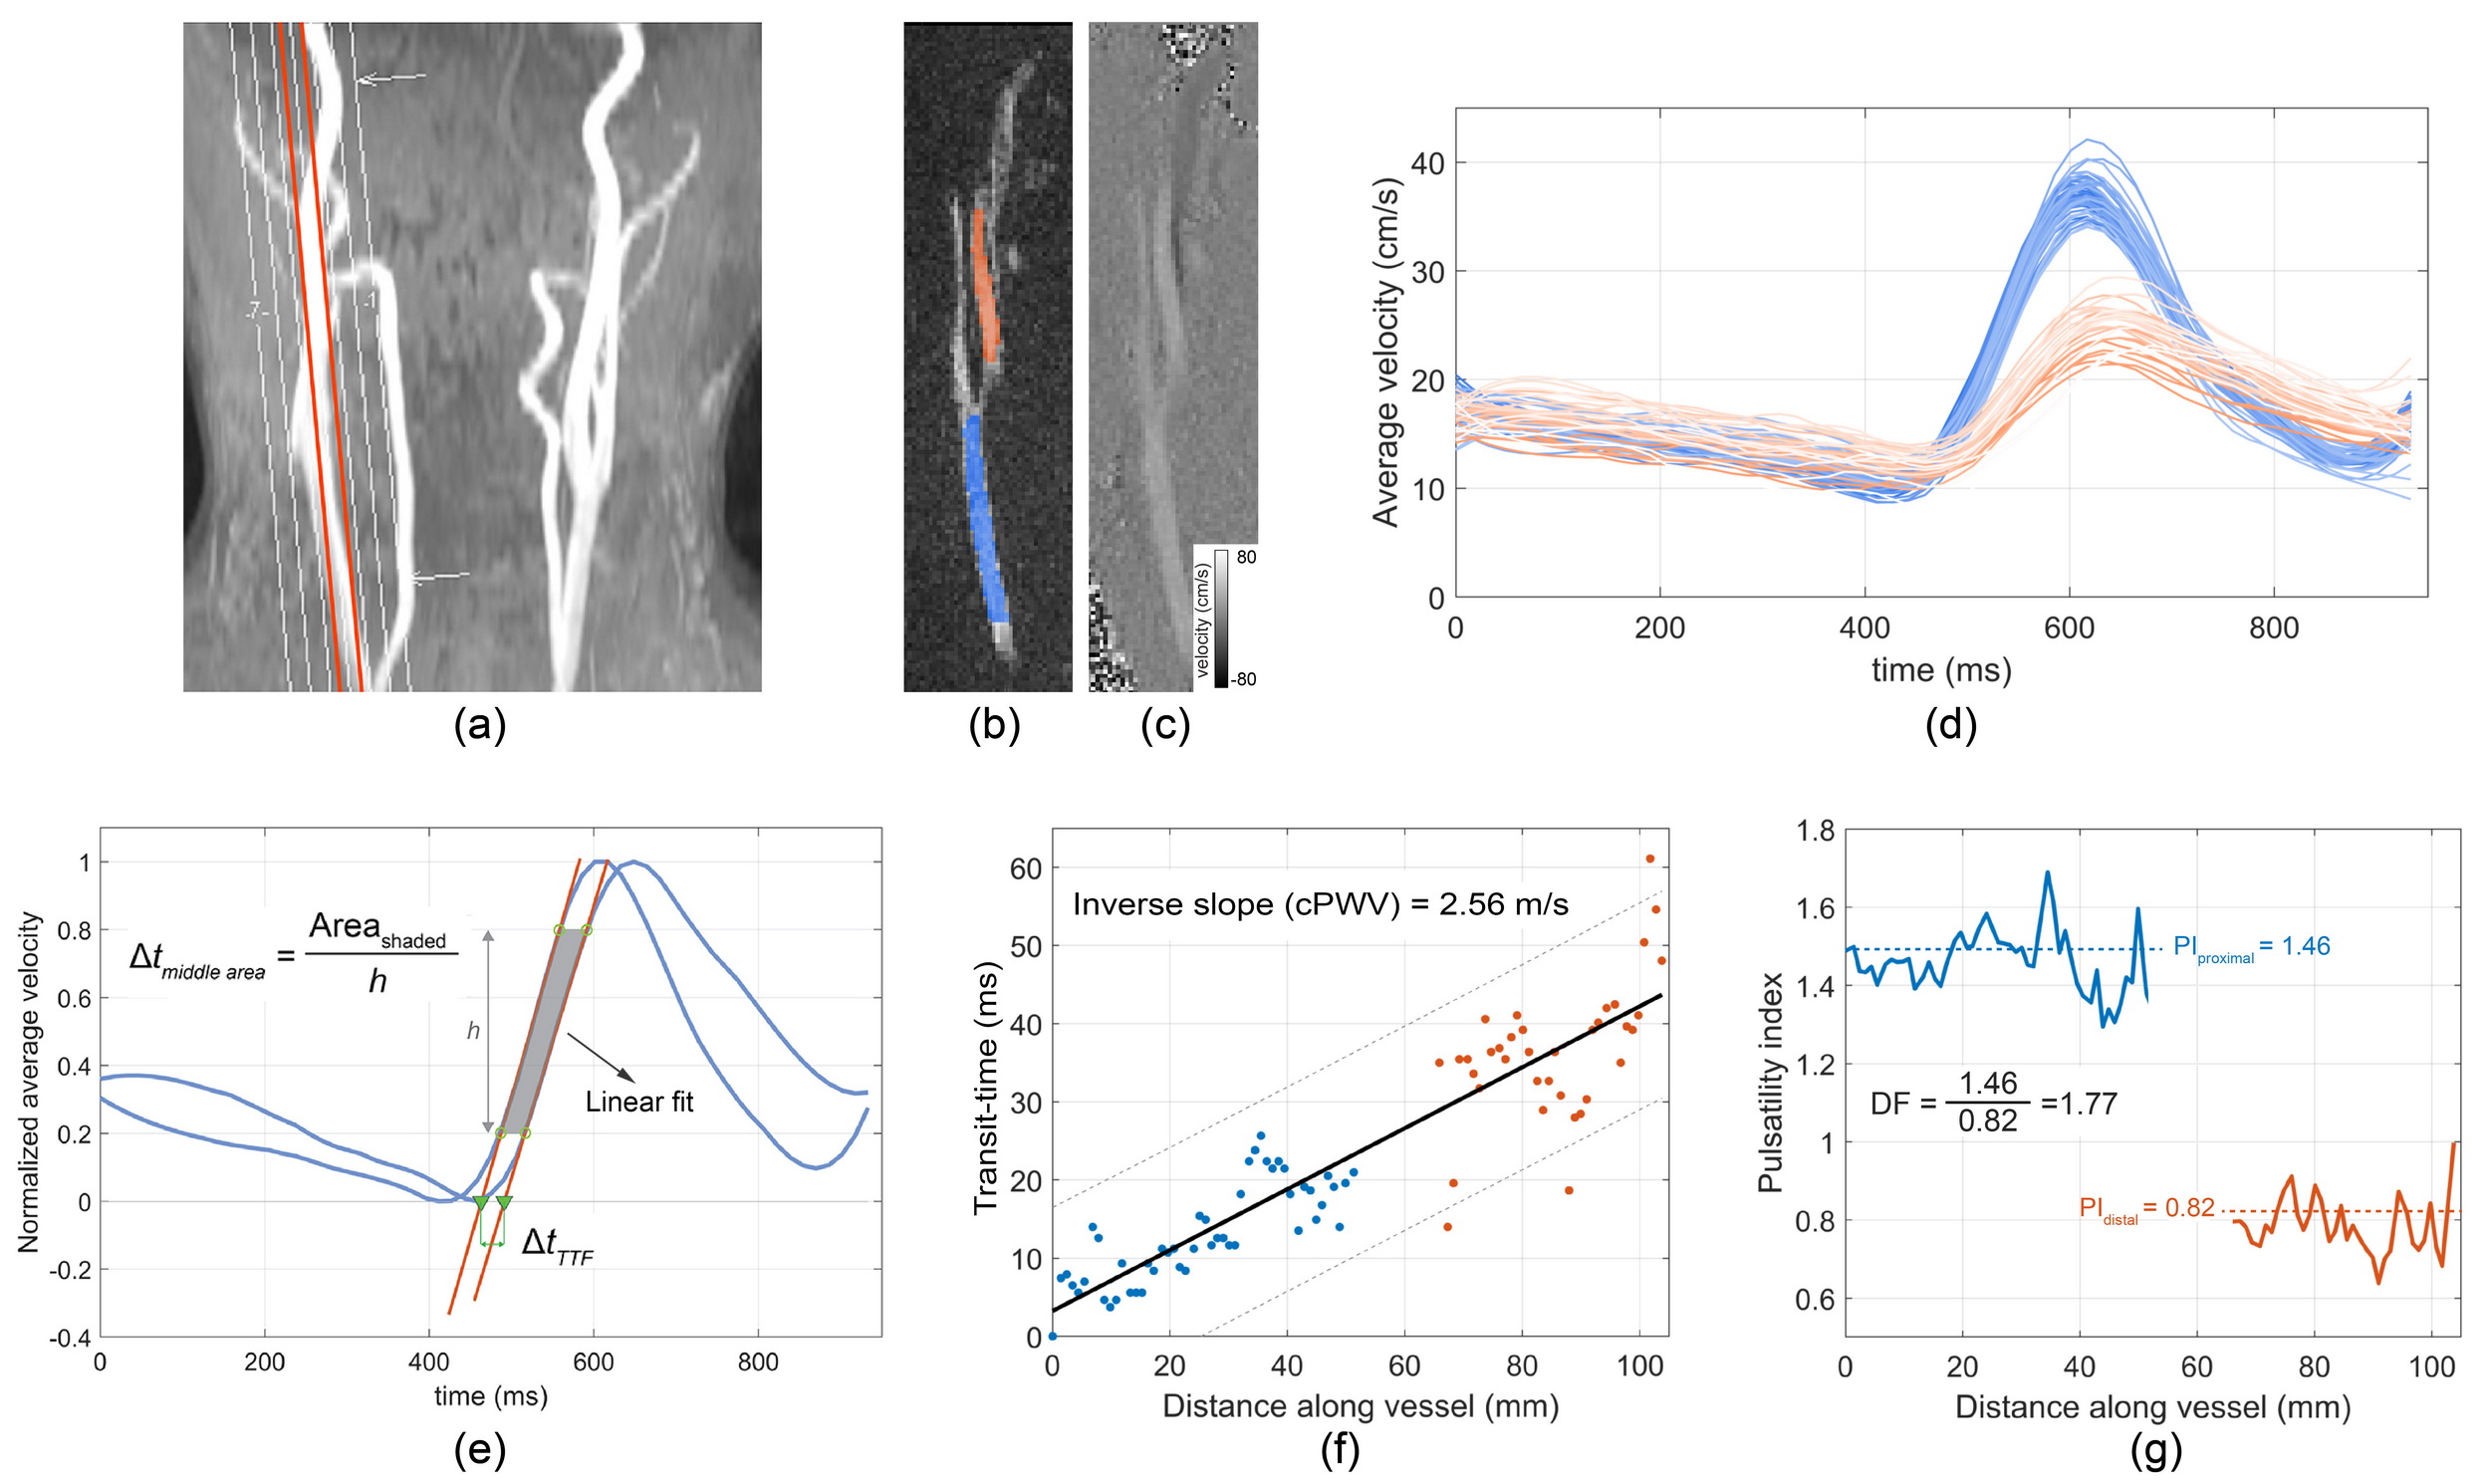
Participants and MR Imaging: Nine healthy individuals (one female) aged between 23 and 75 years (35±15 years) were recruited in this study. MRI experiments were performed on a Siemens Prisma 3T Scanner using 20-channel head/neck coil.One-stop-shop cPWV: Using the 3D MR angiograms obtained from the quick (2 minutes) time-of-flight scan, an oblique sagittal slice was selected to cover the majority of CCA-ICA segment while avoiding overlaps with other vessels (Figure 1a). A single-slice ECG retrospective-gated 2D PC-MRI with a single in-plane velocity encoding (CCA to ICC) was used to simultaneously acquire flow velocity waveforms in CCA and ICC as shown in Figure 1b-d (resolution=1.0×1.0×4.0 mm3, VENC=80 cm/s, TE/TR=4.32/14.22 ms, TA=2min). Time-resolved three-dimensional PC-MRI (4D Flow) measurement was carried out with the same vessel coverage as that in the 2D PC-MRI and was used to calculate reference cPWV (resolution=1.0×1.0×5.0 mm3, TP/IP VENC=80/25 cm/s, TE/TR=2.64/10.44 ms, TA=12min).
cPWV calculation: cPWV calculations were carried out using an internally developed software written in MATLAB. First, the magnitude image was used to generate a region of interest (ROI) mask (figure 1-b) and to measure the vessel length through automatic tracing of the path along the midline of the ROI. Averaged velocity waveforms at different axial locations in the ROI were calculated and were smoothed using a Savitsky–Golay filter (Figure 1-d). Following normalization, the transit-time between waveforms were calculated using time–to–foot (TTF) and middle area (MA) techniques5,6 (Figure 1-e). cPWV was expressed as the inverse slope of a line fitted to the transit-time vs. distance along the vessel (Figure 1-f). For MA technique, three different upslope fitting ranges were chosen and studied. Additionally, the arterial dampening factor (DF) was calculated as the ratio of the proximal (ICA) pulsatility index (PI) to the distal (ICA) PI, where PI was defined as PI=(Qmax-Qmin)/Qmean with Qmean being the mean flow rate (Figure 1-f).
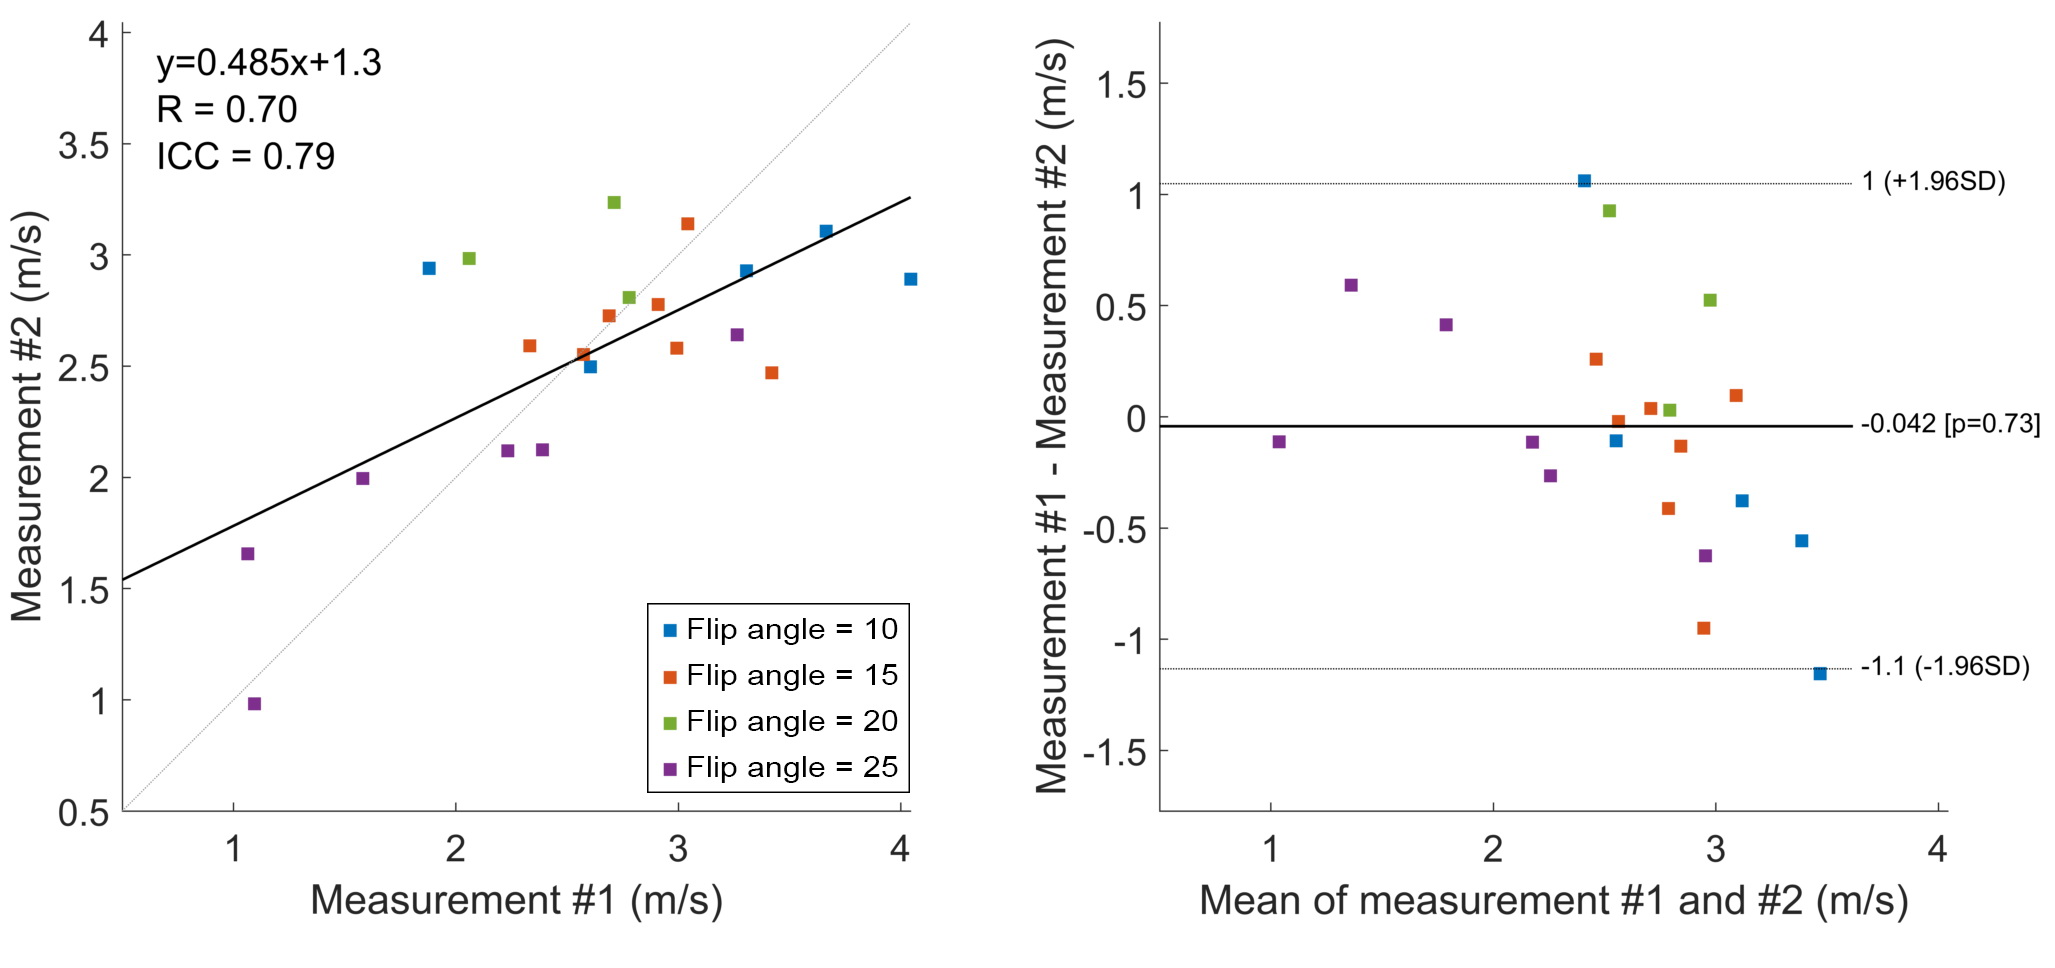
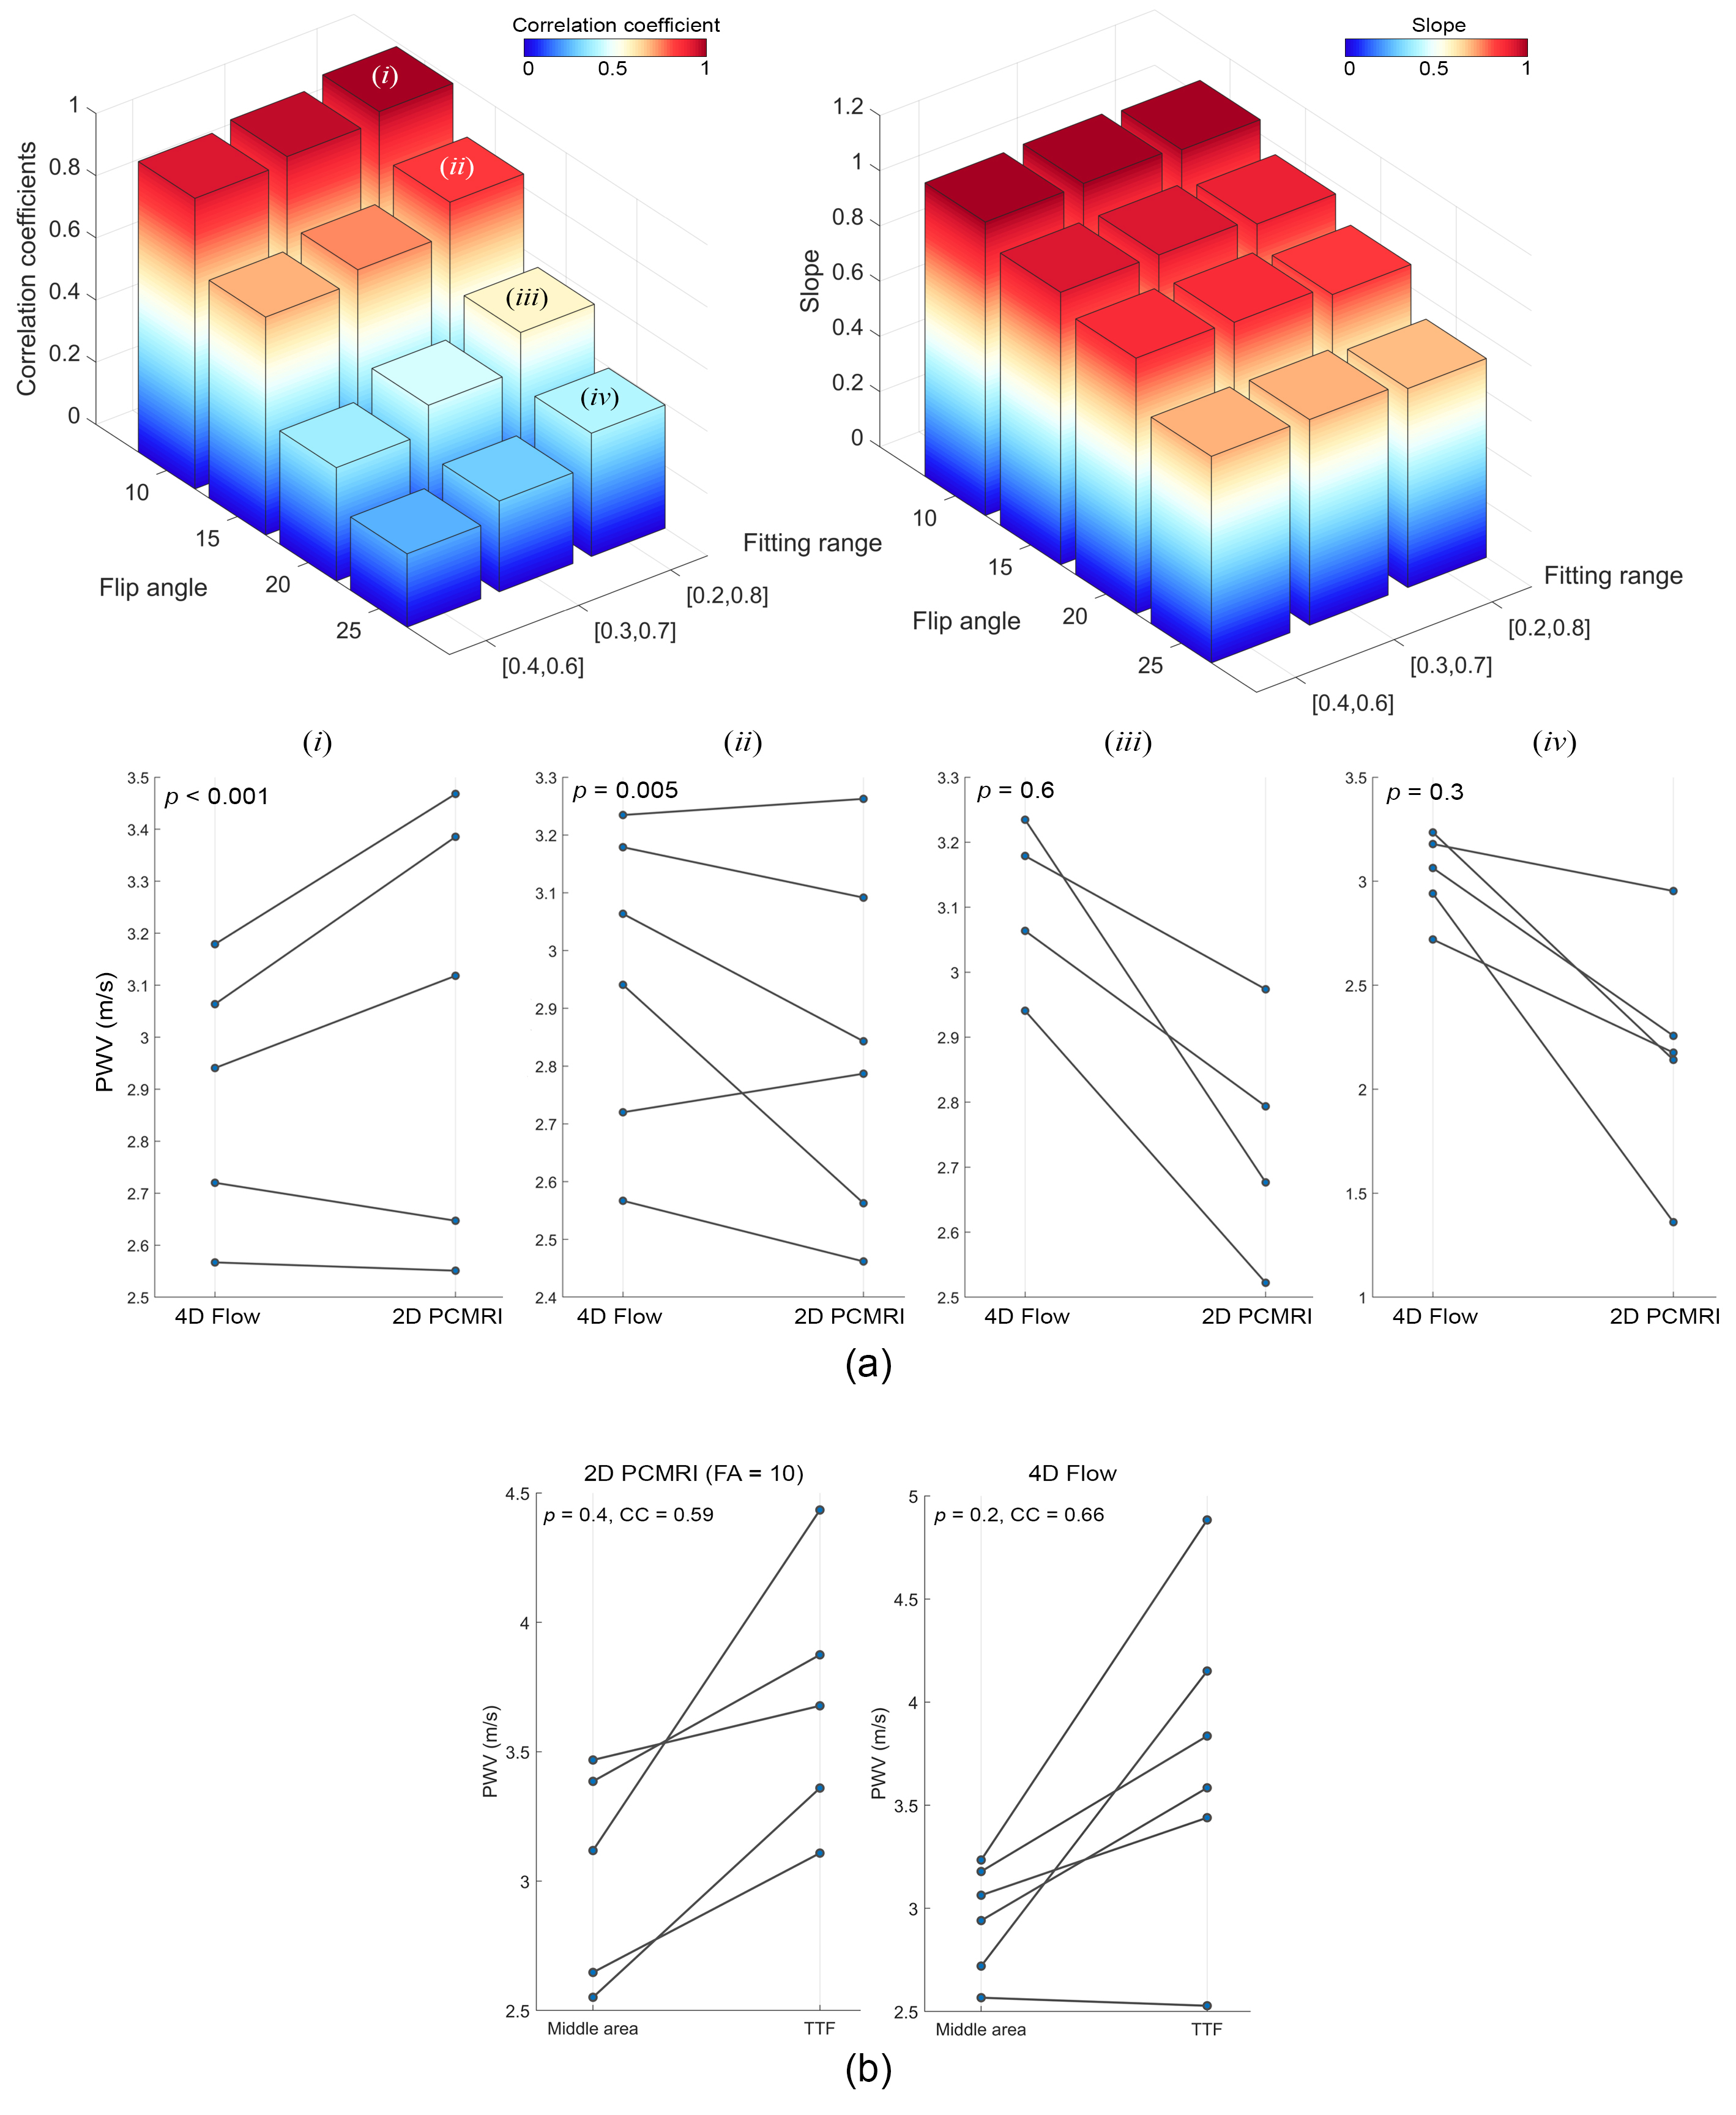
The test-retest repeatability of 2D PC-MRI–measured cPWV was assessed using Bland–Altman analysis from six participants. To investigate the potential in-plane flow saturation effects on PWV measurement, we applied different FAs (FA=10,15,20,25°) in 2D PC-MRI and compared the PWV measurements with the reference PWV from 4D Flow.
Results
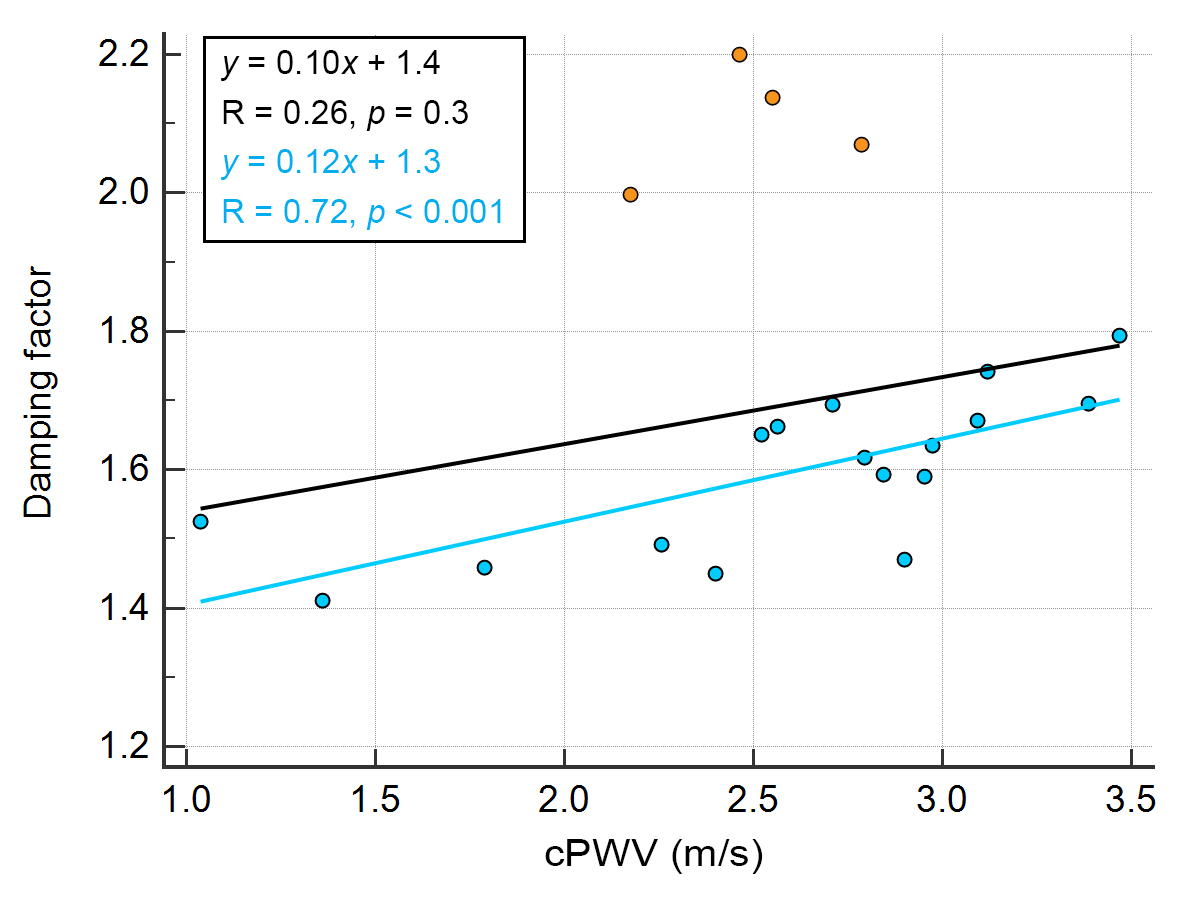
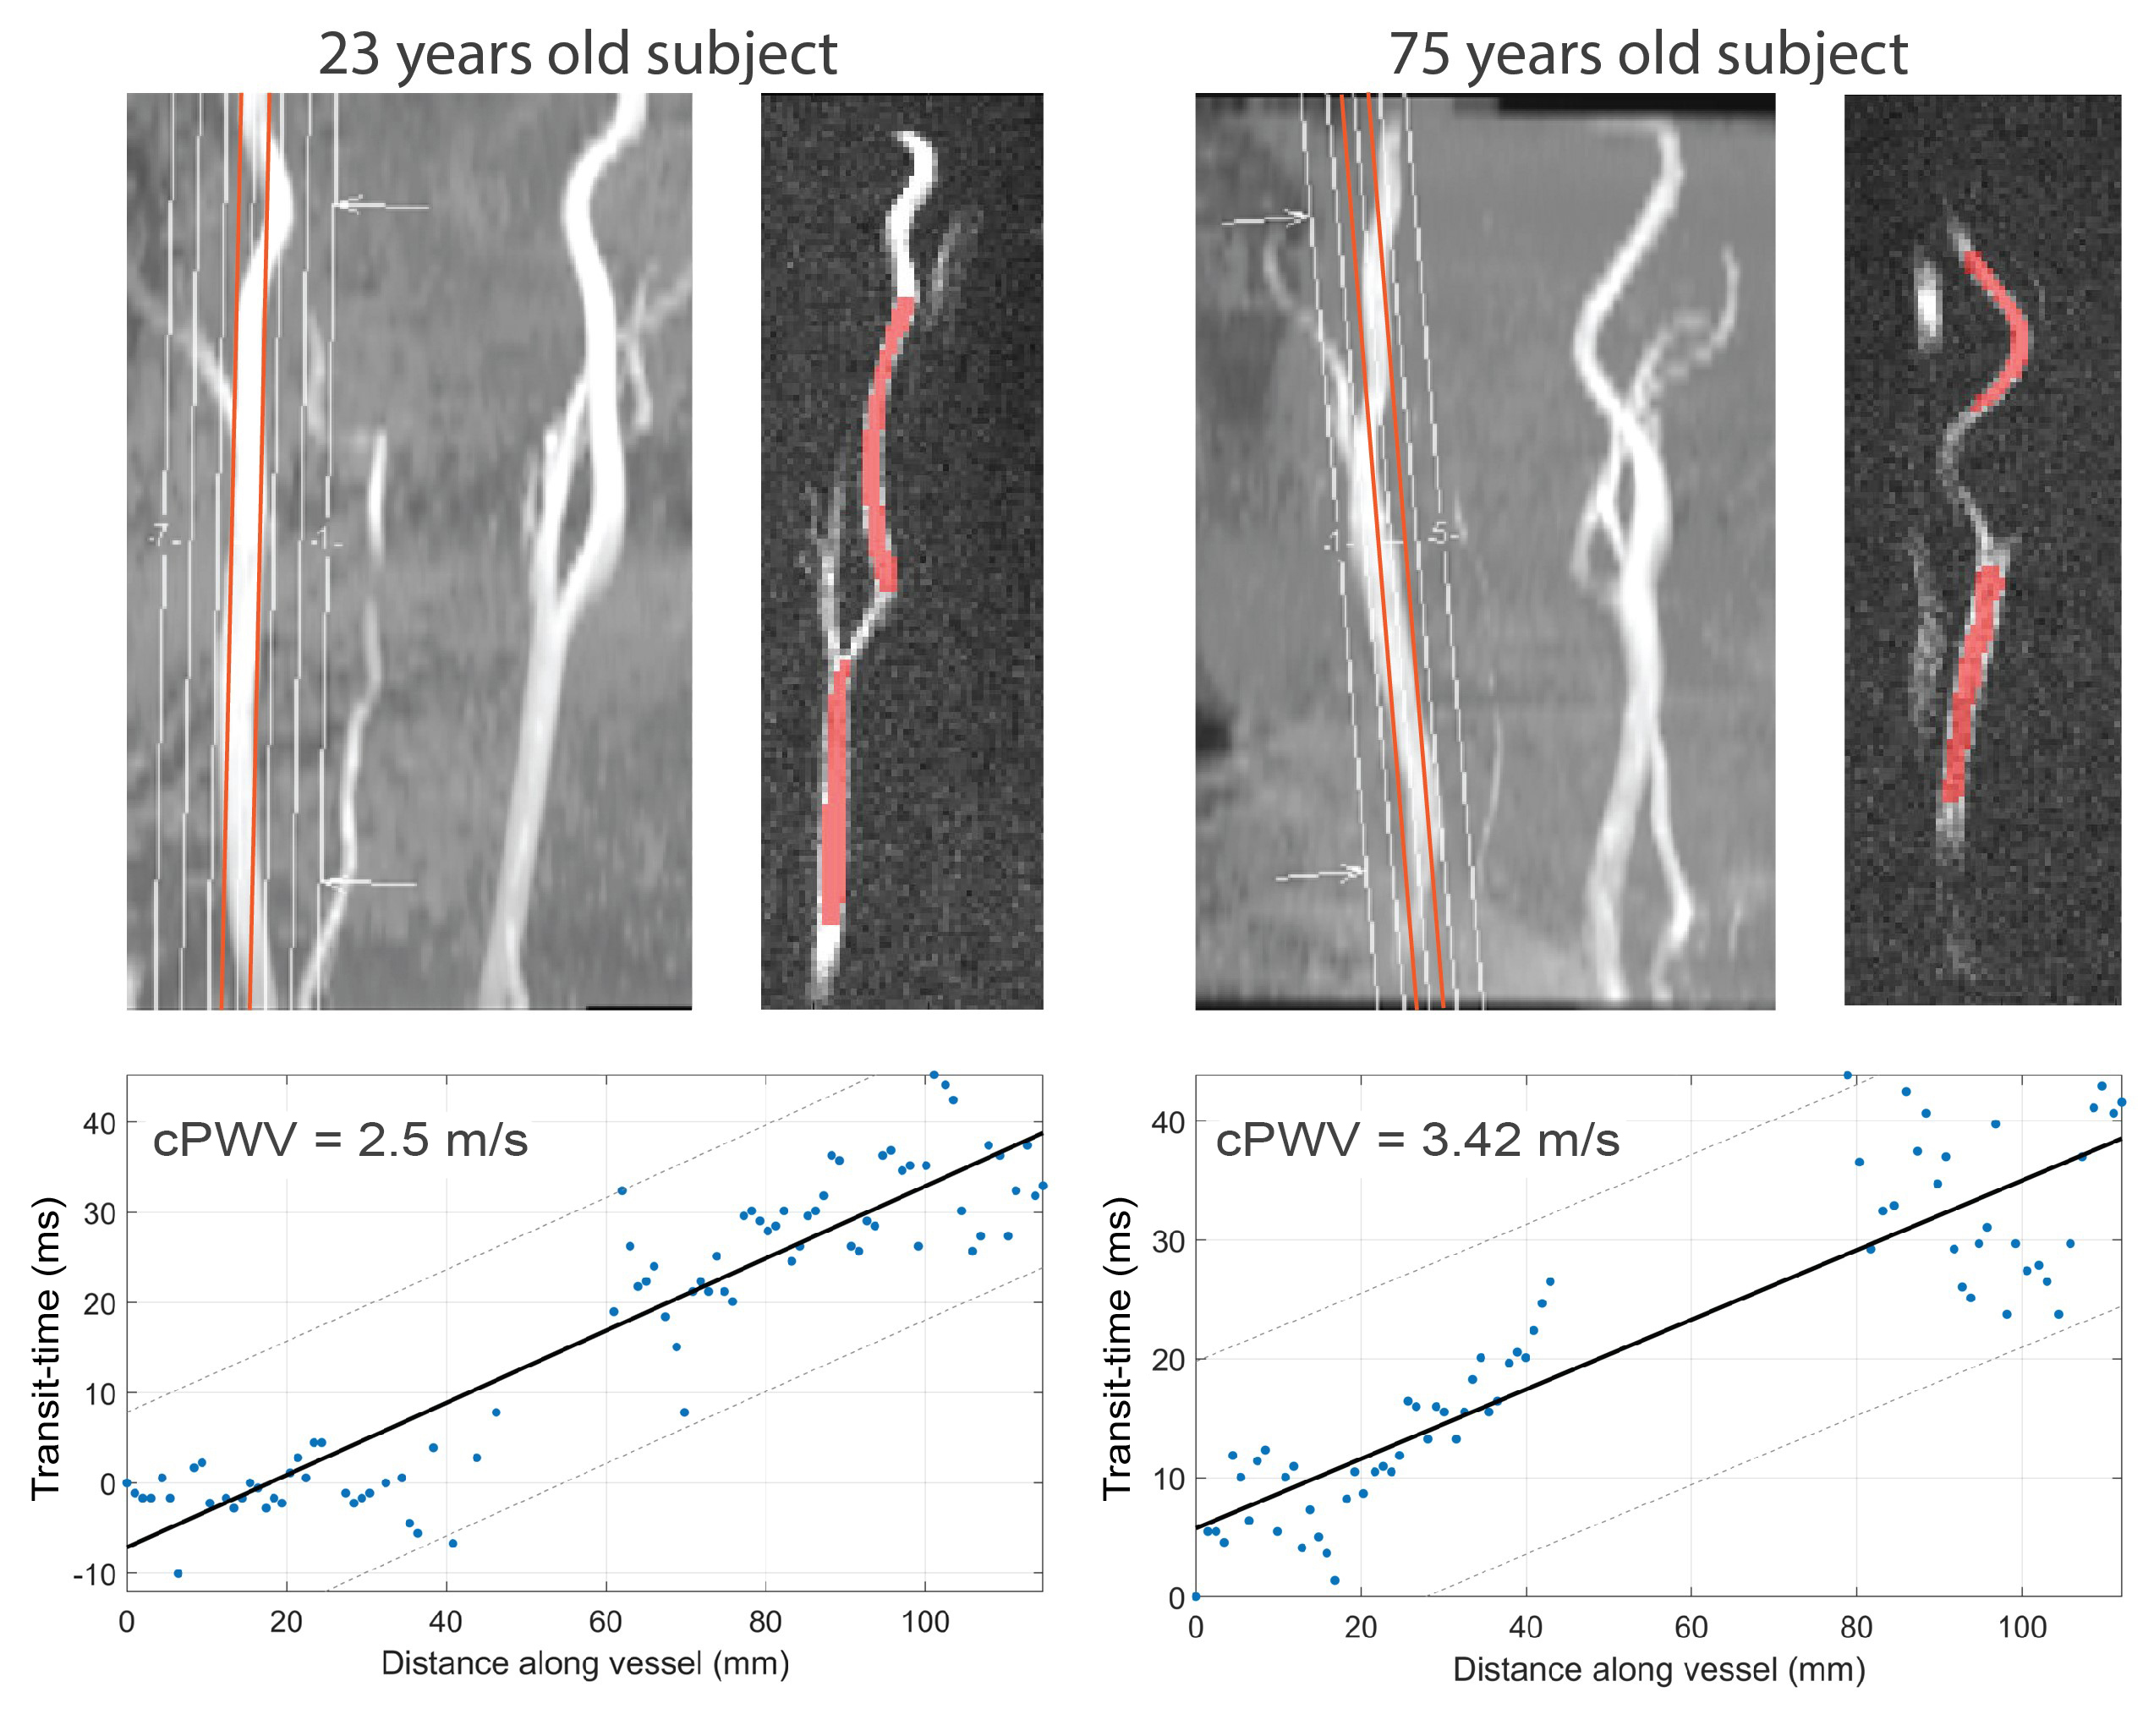
The correlation coefficient and ICC between repeated PWV measurements were 0.7 and 0.79, respectively, indicating good test-retest reproducibility (Figure 2). cPWV with FA of 10° with the upslope fitting range of [0.2, 0.8] showed the highest correlation coefficient and slope of the linear regression with 4D Flow–measured cPWV values (Figure 3-a). cPWV values obtained using TTF method were markedly larger than the ones obtained using MA method (Figure 3-b). cPWV and DF were highly correlated after excluding four outlier points from two subjects who presented extremely high DF values when using higher FAs (Figure 4). Comparison of the youngest (23 y/o) and the oldest (75 y/o) individuals among our participants revealed a substantially larger cPWV in the older subject (Figure 5).Discussion
The results of this pilot study suggest the feasibility of one-stop-shop cPWV approach to derive the propagation time and vessel length from a single 2D PC-MRI scan. The reliability of PC-MRI–measured cPWV was well demonstrated through the test-retest scans and comparison with 4D Flow measurements. Compared to 4D Flow, the proposed approach offers much shorter scan time without sophisticated postprocessing. The stronger correlation of cPWV between 2D PC-MRI and 4D Flow at smaller FAs could be attributed to the reduced in-plane flow saturation effects and the resulting increase in SNR. The discrepancy observed between PWV values calculated using TTF and MA transit-time quantification techniques is in agreement with previous reports7 and highlights the need for a more detailed analysis to evaluate the impact of various MR sequence parameters and post-processing techniques on PWV quantification. Future studies using flow phantoms with known PWV can lead to a more comprehensive picture of the MRI-based PWV calculation accuracy. Our preliminary data also show that cPWV is highly correlated with arterial DF–another biomarker of arterial stiffness8 and that cPWV tends to be larger in older subjects, suggesting that single-slice PC-MRI–measured cPWV could be a potential imaging marker to assess cerebrovascular stiffness in aging and neurodegenerative diseases.Conclusion
This study demonstrated the feasibility of carotid PWV measurement using single-slice 2D PC-MRI, which could hold potential as a biomarker of age-related alterations in cerebral arteries.Acknowledgements
This work is supported by grants of NIH K25-AG056594 and AHA 16SDG29630013.References
1. Callaghan, F., Geddes, L., Babbs, C.F. & Bourland, J. Relationship between pulse-wave velocity and arterial elasticity. Medical and Biological Engineering and Computing 24, 248-254 (1986).
2. Gorelick, P., et al. American Heart Association Stroke Council, Council on Epidemiology and Prevention, Council on Cardiovascular Nursing, Council on Cardiovascular Radiology and Intervention, and Council on Cardiovascular Surgery and Anesthesia. Vascular contributions to cognitive impairment and dementia: a statement for healthcare professionals from the american heart association/american stroke association. Stroke 42, 2672-2713 (2011).
3. Shen, L., et al. Relationship between pulse wave velocity and carotid atherosclerosis in geriatric people. Cerebrovascular Diseases 32, 16-20 (2011).
4. Rodgers, Z., et al. Carotid pulse wave velocity quantification with non-gated, velocity-encoded projections. in Proc. Intl. Soc. Mag. Reson. Med 21 (2013).
5. Dogui, A., et al. Measurement of aortic arch pulse wave velocity in cardiovascular MR: comparison of transit time estimators and description of a new approach. Journal of Magnetic Resonance Imaging 33, 1321-1329 (2011).
6. Chiu, Y.C., Arand, P.W., Shroff, S.G., Feldman, T. & Carroll, J.D. Determination of pulse wave velocities with computerized algorithms. American heart journal 121, 1460-1470 (1991).
7. Ruesink, T., Medero, R., Rutkowski, D. & Roldán-Alzate, A. In vitro validation of 4D flow MRI for local pulse wave velocity estimation. Cardiovascular engineering and technology 9, 674-687 (2018).
8. Schnerr, R.S., et al. Pulsatility of Lenticulostriate Arteries Assessed by 7 Tesla Flow MRI—Measurement, Reproducibility, and Applicability to Aging Effect. Front Physiol 8, 961 (2017).
Figures