1651
Measuring blood velocity pulsations in tortuous lenticulostriate arteries:1D versus 3D velocity-encoded imaging at 7T1Department of Radiology and Nuclear Medicine, Maastricht University Medical Center, Maastricht, Netherlands, 2School for Mental Health and Neuroscience, Maastricht University, Maastricht, Netherlands, 3Department of Electrical Engineering, Eindhoven University of Technology, Eindhoven, Netherlands, 4Department of Neurology, Maastricht University Medical Center, Maastricht, Netherlands, 5Cardiovascular Research Institute Maastricht, Maastricht University, Maastricht, Netherlands
Synopsis
Recently developed 2D phase-contrast sequences showed the feasibility of measuring the small lenticulostriate arteries with 7T MRI. However, these vessels are known to be tortuous, and their tortuosity generally increases with aging and in vascular disease. Therefore, we aimed to measure the blood flow velocity not only in one direction, but in three directions, to capture all three velocity components. We found significant components for the other two, less conventional, velocity directions, which resulted in a lower pulsatility index and peak acceleration when comparing to the 1D measurements.
Introduction
The lenticulostriate arteries (LSA) perforate the deep brain tissue, which makes the surrounding brain tissue particular susceptible for damage caused by an increased pulsatility1. An increased blood flow pulsatility may be the result of the decreased dampening of the blood flow pulse, due to the stiffening of the vessel wall, as often observed in normal aging and vascular disease2. Phase contrast (PC) MRI at 7T enables visualization of and measuring the blood velocity in these small cerebral vessels. Previous studies found an increased pulsatility due to aging and cerebral small vessel disease (cSVD)3,4. Often only one slice is acquired because of limited scan time. However, it is known that the tortuosity of the LSAs increases with hypertension and aging5. Therefore, it may not be sufficient to use PC MRI in only one direction, since the blood velocity profile will not be captured fully6. Therefore, the aims of this study were (i) to measure the blood flow velocity for tortuous LSAs in three directions, and (ii) to compare these measures between young and elderly subjects.Methods
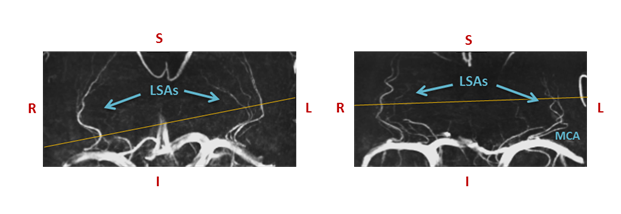
Subjects: 4 young (20-30 years,3 males) and 4 elderly adults (62-78 years,3 males) were included.MRI acquisition: Images were acquired with a 7T MRI system (Magnetom, Siemens Healthineers, Erlangen, Germany) with a 32-channel phased-array head coil. For depiction of the branching and trajectories of the LSAs, a Time-Of-Flight angiogram (Fig.1) was acquired (TR/TE=15.0/5.1ms, flip angle=18⁰, cubic voxel size=0.31mm,bandwidth=78Hz/pixel, and field-of-view=135x180mm). Maximum intensity projections were calculated for the geometrical planning of the velocity-sensitive slice. To resolve the blood flow velocity over the cardiac cycle, a prospectively gated 2D PC sequence (TR/TE=50-70/4-5ms, FA=26⁰, pixel-size=0.31x0.31mm, slice thickness 2.6mm, and bandwidth=181-280Hz/pixel) was applied, which was planned perpendicular to the spatial trajectories of as many LSAs as possible. This sequence was performed for three orthogonal velocity-sensitive gradient directions at the same slice position and angulation, with a scan duration of approximately 4 minutes each, to obtain three-directional flow velocity profiles. For the first velocity encoding(venc) direction, along the vessel axis, the venc was set to 30 cm/s. For the other two directions, anterior-posterior and right-left, the venc was set to 20 cm/s to increase the sensitivity to the corresponding velocity components, as these were expected to be smaller. The bandwidth, TR and TE were chosen as low as possible, however high enough to ensure a minimum of 16 cardiac phases were obtained, with visually sufficient signal-to-noise.
Image analysis: The analysis of the 1D measurement was performed for the through-plane velocity component of the maximum blood flow velocity, for which the strongest velocity component was expected. All detectable vessels were analyzed, and corrected for aliasing. To correct for noise, only the vessels with a higher mean velocity value than 2 cm/s were taken into account for the analysis. For the 3D velocity analysis, the maximum blood flow velocity in each direction was calculated, and combined to calculate the total velocity vector, using the square root of the sum of squares of each individual component. The pulsatility index (PI) was calculated using Gosling’s equation: $$$PI=\frac{v_{max}-v_{min}}{v_{mean}} $$$, where v is velocity7. The peak acceleration was calculated using: $$$PA=a_{max+}+a_{max-}$$$, where amax+ and amax- are the absolute value of the minimum and maximum slope of the velocity in the wave form, respectively8.
Statistics: To compare the 1D and 3D results for the blood flow velocity characteristics, a Wilcoxon signed-rank test was performed. The significance level was p=0.05. The PI and PA derived from velocity components in three directions was compared between the two age groups with a non-parametric Mann-Whitney U-test.
Results
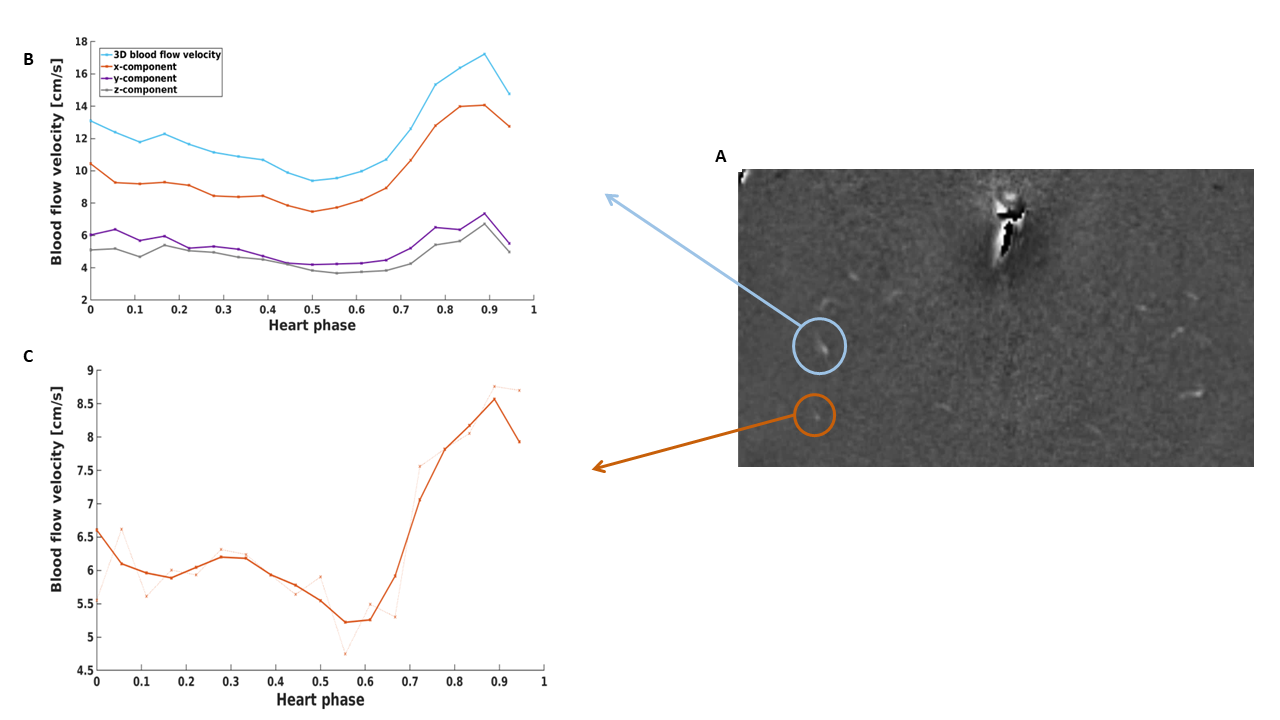
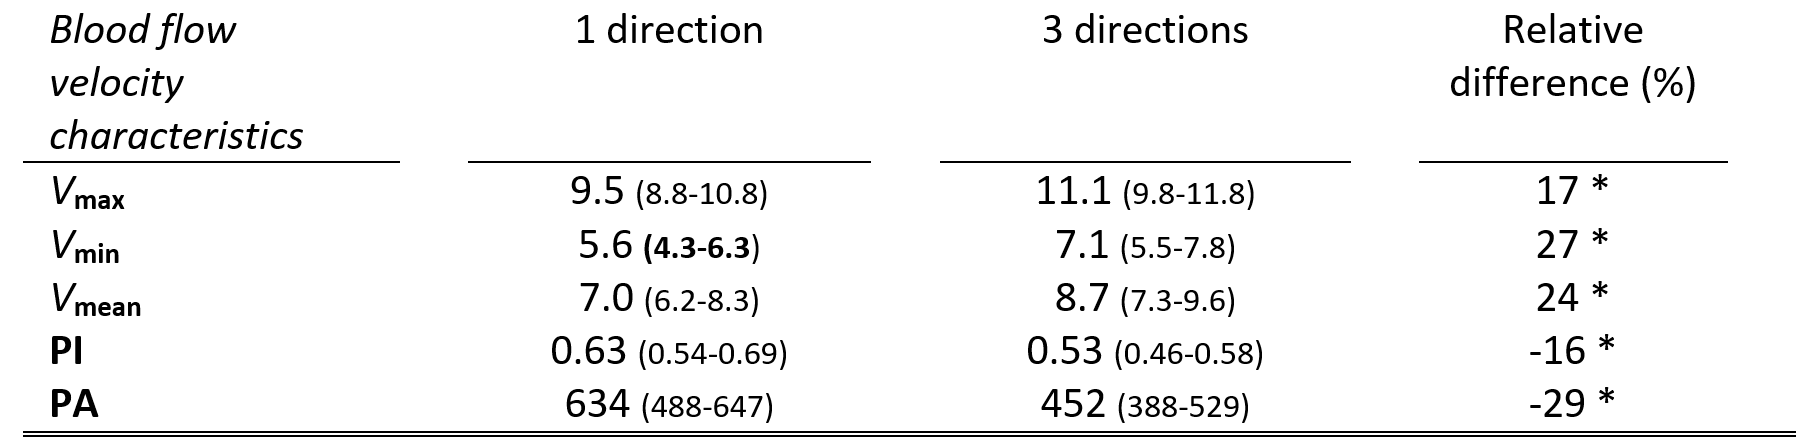
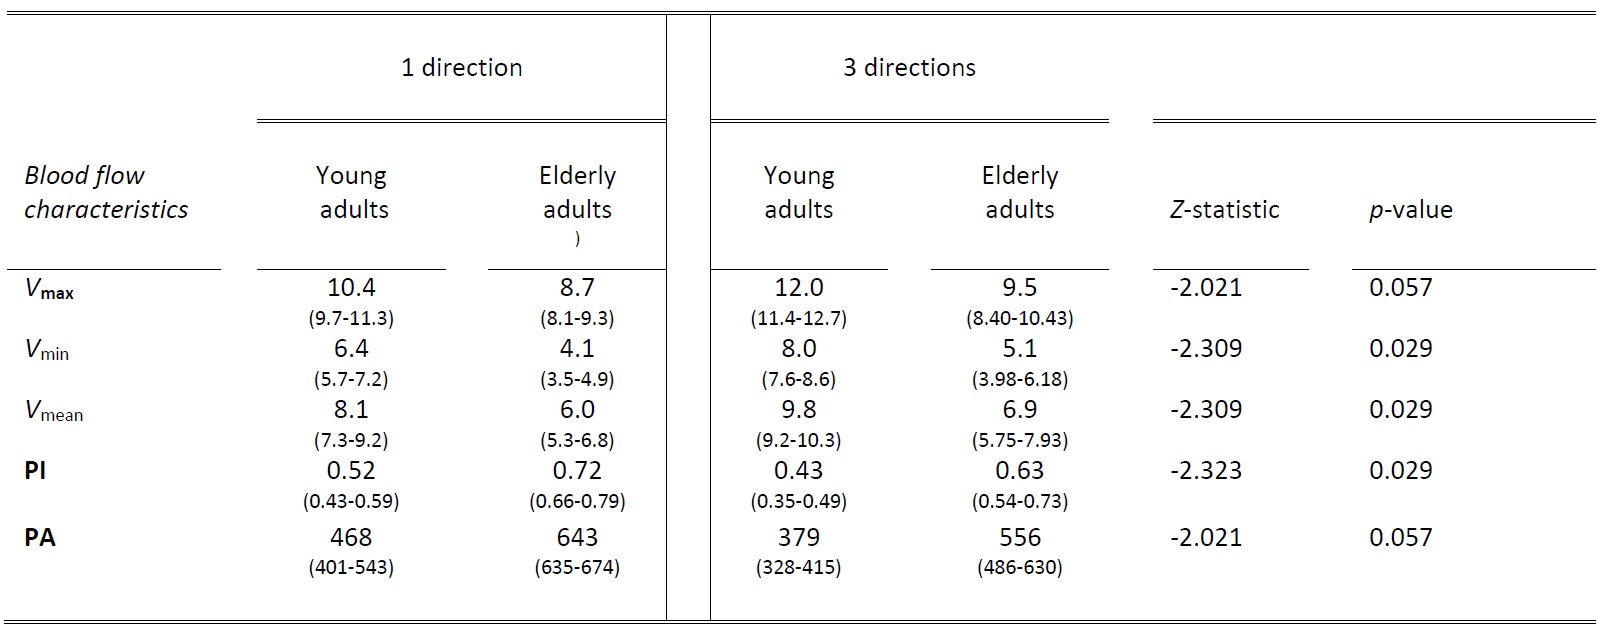
Figure 2 shows an example of the resulting 1D and 3D waveforms.A lower PI and PA was found for the 3D measurements compared to the 1D measurements (Table 1). The mean, maximum and minimum blood flow velocity were systematically highest for the 3D variant. In elderly adults higher (3D) PI and PA values were obtained compared to the young adults (Table 2). Here, lower mean, maximum and minimum blood flow velocity was found in elderly compared to young adults.
Discussion
The 3D measurements yield (approximately 20%) higher values for the blood flow velocity magnitude than the single component obtained from a 1D measurement. This implies that when only measuring 1D blood flow velocity, not the full 3D velocity vector is captured, and the magnitude of the velocity is underestimated. The results show that the PI decreases when measuring in 3 directions.Furthermore, this study supports previous findings in which a higher PI in aging subjects was found4. Similarly, a higher PA value was found as well for elderly adults, which was expected from the results of a previous study in patients with cSVD8. We are currently including hypertensive patients, in which we perform 3D measurements, as hypertension is known to increase the tortuosity of the small vessels.
Conclusion
This study demonstrated the feasibility of measuring 3D blood flow velocity components in the LSA with PC MRI at 7T. We demonstrated that it is important not the neglect the different velocity directions when analyzing the blood flow velocity through small tortuous arteries. Moreover, decreasing effect on blood flow velocity and increasing effect on pulsatility was demonstrated with age.Acknowledgements
No acknowledgement found.References
1Pantoni L. Cerebral small vessel disease: from pathogenesis and clinical characteristics to therapeutic challenges. Lancet Neurol. 2010; 9(7), 689–701
2Kang C, Park C, Soobin Lee D, et al. Velocity measurement of microvessels using phase-contrast magnetic resonance angiography at 7 tesla MRI: Velocity Measurement of Microvessels. Magn. Reson. Med. 2016; 75(4), 1640–1646
3Schnerr R, Jansen J, Uludag K, et al. Pulsatility of Lenticulostriate Arteries Assessed by 7 Tesla Flow MRI—Measurement, Reproducibility, and Applicability to Aging Effect. Front. Physiol. 2017, 8:961.
4Geurts L, Zwanenburg J, Klijn C, et al. Higher Pulsatility in Cerebral Perforating Arteries in patients With Small Vessel Disease Related Stroke, a 7T MRI Study. Stroke. 2019; 50, 62-68
5Ma S, Sarabi M, Yan L, et al. Characterization of Lenticulostriate Arteries with High Resolution Black-blood T1-weighted Turbo Spin Echo with Variable Flip Angles at 3 and 7 Tesla. NeuroImage. 2019; 199, 14-193
6Schubert T, Bieri O, Pansini M, et al. Peak Velocity Measurements in Tortuous Arteries With Phase Contrast Magnetic Resonance Imaging: The Effect of Multidirectional Velocity Encoding. Inv. Rad. 2014; 49(4), 189-194
7Gosling R, King D. Arterial assessment by Doppler-shiftultrasound. Proc. R. Soc. Med. 1974; 67; 447–449
8Fisse A, Puescel J, Deppe M, et al. TCD-Profiling Using AVERAGE. A New Technique to Evaluate Transcranial Doppler Ultrasound Flow Spectra of Subjects with Cerebral Small Vessel Disease. Cerebrovasc. Dis. 2016; 41; 50-59
Figures