1647
The Capability of Contrast-enhanced T1-weighted MR Imaging for Quantifying Ivy Sign in Moyamoya Disease: compared with FLAIR1The First Medical Center of Chinese PLA General Hospital, Beijing, China, 2The Fifth Medical Center of Chinese PLA General Hospital, Beijing, China
Synopsis
Previous study has reported superiority of contrast-enhanced T1-weighted MR (CEMR) imaging compared with FLAIR for depicting ivy sign in Moyamoya disease (MMD), but no quantitative comparison of both scoring modalities was performed. In this study, we found better consistency between CEMR and DSA, higher ability of CEMR to differentiate severity of MCA stenosis, as well as higher specificity of CEMR compared with FLAIR. Our study proposed that for chronic cerebrovascular disease like MMD, CEMR might be more appropriate in assessing leptomeningeal collaterals.
Introduction
Moyamoya disease (MMD) is characterized by chronic progressive stenosis of the terminal portion of circle of Willis, with abnormally formed vascular network at the base of the brain1. As a major collateral pathway, leptomeningeal collateral vessels play an important role in maintaining cerebral perfusion and could be visualized as "ivy sign" on MR images in MMD. This sign could be seen on contrast-enhanced MR (CEMR) images as leptomeningeal enhancement and FLAIR images as arterial high signal intensity. Although former study has compared the capacity of depicting ivy sign between CEMR and FLAIR images, no quantitative assessments was performed2. The purpose of this study is to compare the capability of these two scoring methods for assessing leptomeningeal collaterals using DSA as reference.Methods
FLAIR and CEMR imaging were performed in 44 patients diagnosed MMD by DSA (18 men, 26 women; mean age, 40.63 ± 13.60 years) as parts of preoperative evaluation for possible surgery. Ivy sign was assessed on both FLAIR and CEMR images according to Alberta Stroke Program Early CT Score (ASPECTS)3. In accordance with ASPECTS, the territory supplied by middle cerebral artery (MCA) is divided into 6 regions (M1-M6). Each region was scored based on the prominence of ivy sign (0-2 point scale, 0 indicated an absence of ivy sign in each region; 1 indicated the presence of ivy sign was less than half of each region; 2 indicated the presence of ivy sign was larger than half of each region). The total score of ivy sign was calculated as the sum of 6 regions on both FLAIR (FLAIR vascular hyperintensity, FVH) and CEMR images (CEMR scores, CEMRs)4. Quantitative assessment of leptomeningeal collaterals on DSA was performed according to the method proposed by Liu et al.5. Suzuki stage was also recorded. Clinically, the modified Rankin Scale (mRS) for each patient before surgery was recorded within 1 week of the MR imaging study. In addition, whether a definite cerebral infarction existed was determined by combination of DWI, T2-weighted and FLAIR imaging. Statistically, Spearman correlation was performed to evaluate the consistency of FVH, CEMRs and DSA, mRS. Kruskal-Wallis one-way ANOVA and post-hoc analysis was performed on FVH and CEMRs for differentiating normal MCA (nMCA), MCA with stenosis (sMCA) and MCA with occlusion (oMCA). ROC analysis and McNemar's test were performed to compare the area under curve (AUC), sensitivity and specificity of FVH and CEMRs for identifying cerebral infarction.Results
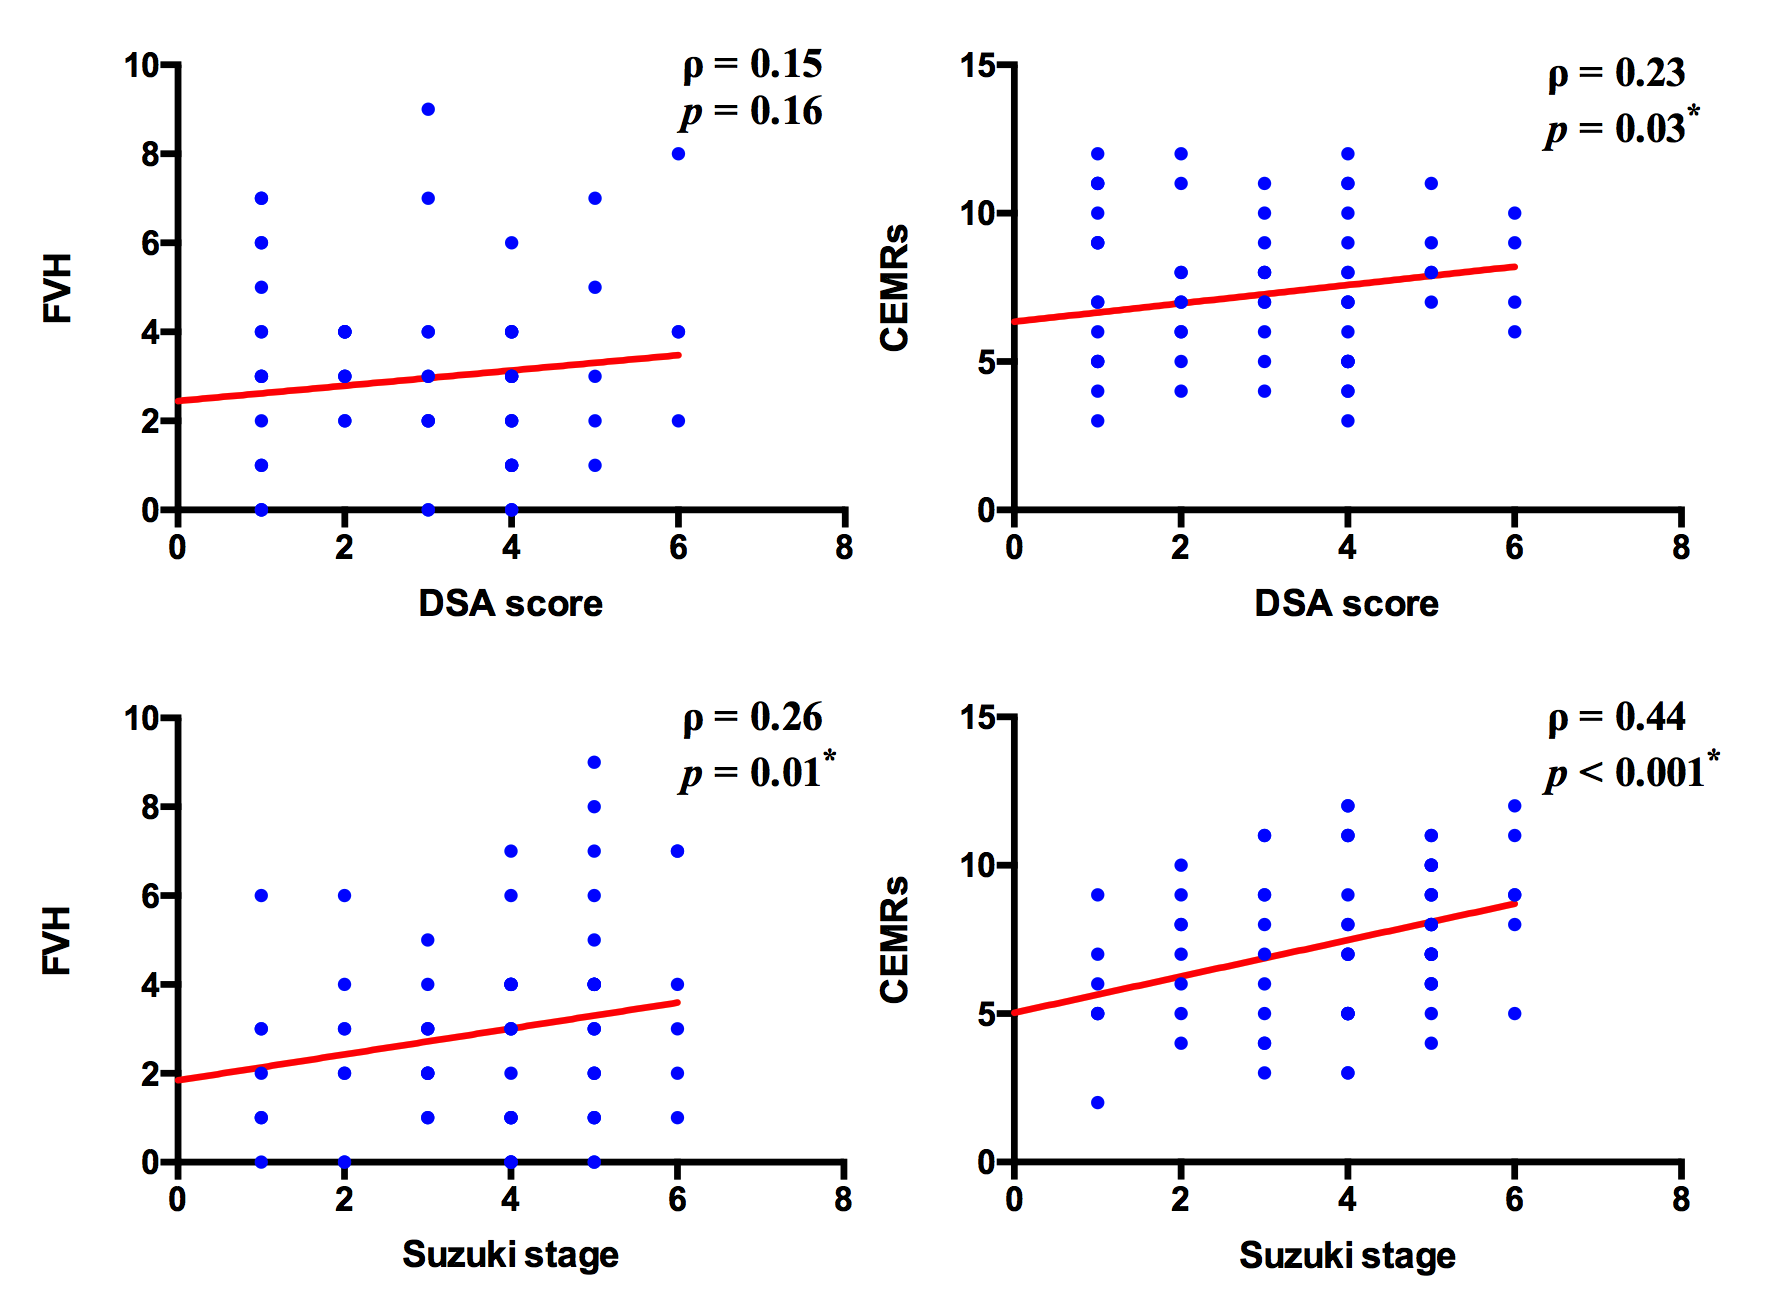
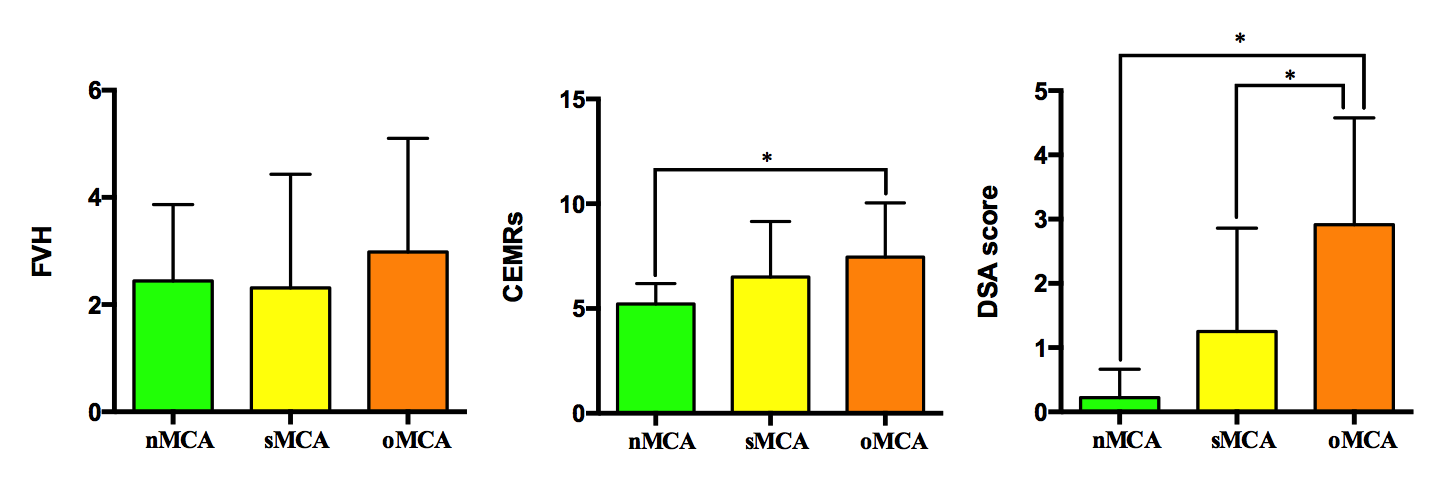
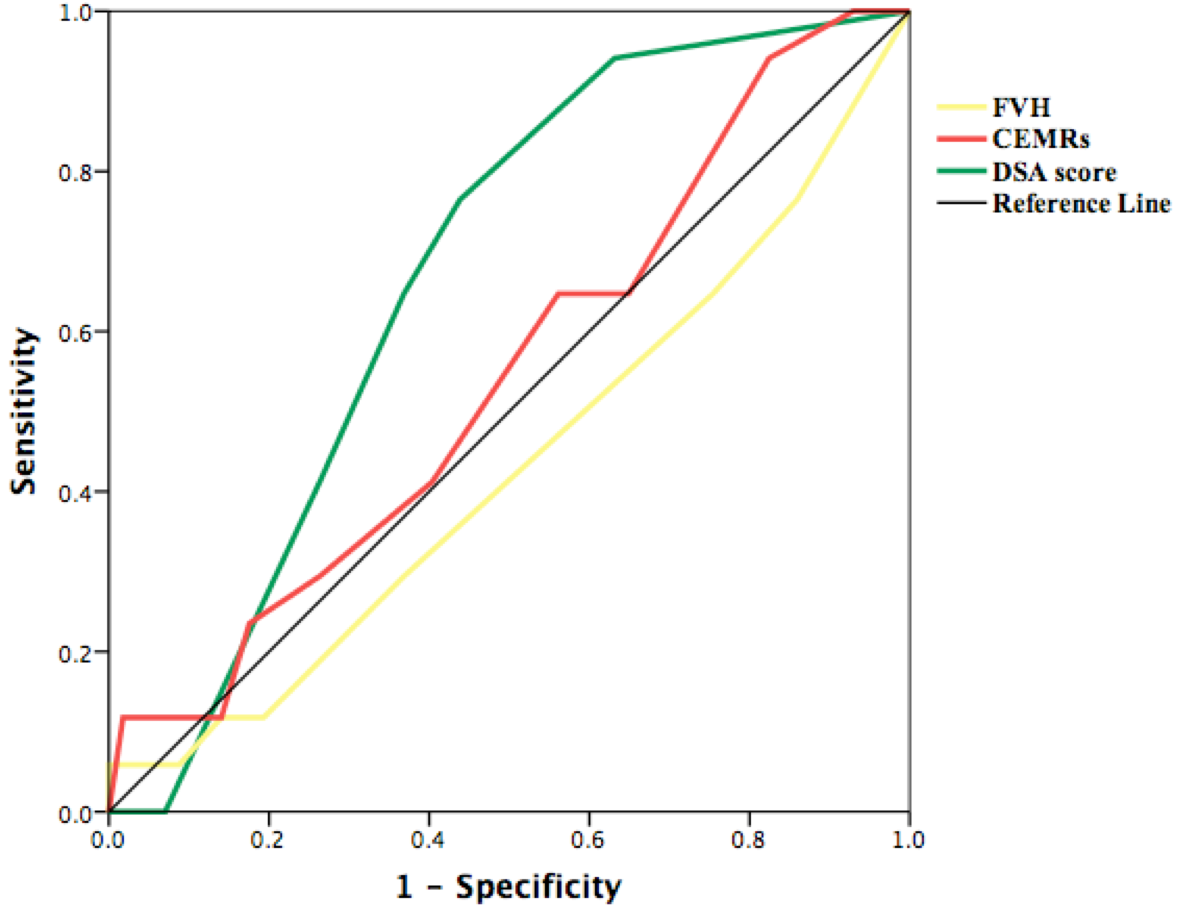
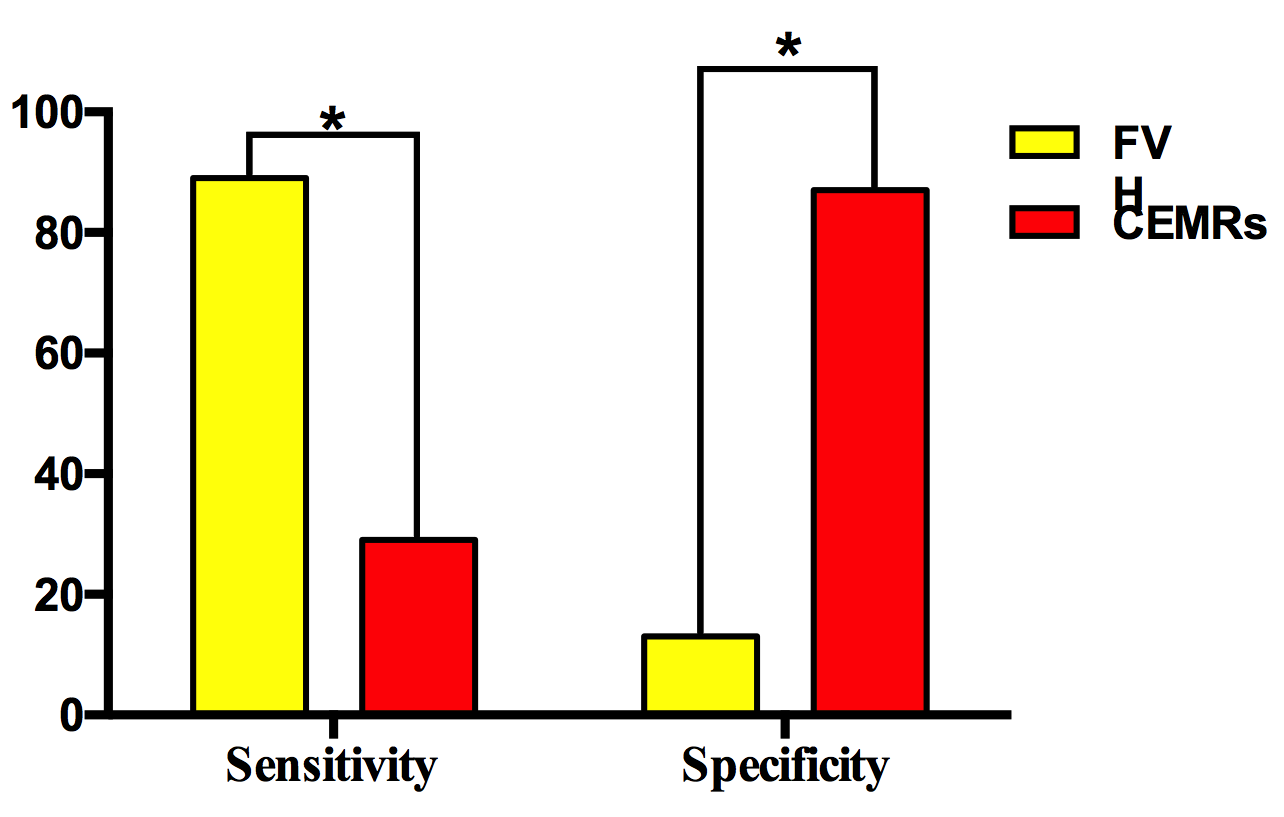
A total of 86 hemispheres were included into analysis (cerebral infarction of 2 hemispheres were too severe to evaluate ivy sign and were excluded from this study). Mean FVH score was 2.80 ± 2.06, mean CEMRs was 7.05 ± 2.56 and mean DSA score was 2.31 ± 1.84. Spearman analysis showed significant correlation between CEMRs and DSA score, but no significant correlation was found between FVH and DSA score (Fig.1). Moreover, there was significant correlation between both FVH, CEMRs and Suzuki stage (Fig.1) with higher correlation coefficient of CEMRs. To test the capacity of FVH and CEMRs differentiating nMCA, sMCA and oMCA, Kruskal-Wallis analysis revealed better ability of CEMRs instead of FVH (FVH, H = 1.61, p = 0.45; CEMRs, H = 7.86, p = 0.02; DSA, H = 25.31, p < 0.001). Post-hoc analysis revealed significant difference between nMCA and oMCA as for CEMRs, significant difference between nMCA and oMCA, sMCA and oMCA as for DSA score (Fig.2). Clinically, no significant correlation was found between ivy sign scores and mRS (FVH, ρ = 0.15, p = 0.18; CEMRs, ρ = 0.17, p = 0.13; DSA, ρ = 0.08, p = 0.48). ROC analysis found that only AUC of DSA scores showed significant results (Fig.3). With regard to sensitivity and specificity of FVH and CEMRs, statistical analysis showed that sensitivity of FVH was 89%, specificity was 29%. Sensitivity of CEMRs was 12.5%, specificity was 87%. McNemar's test showed significant difference of sensitivity between FVH and CEMRs, as well as significant difference of specificity (Fig.4).Discussion
In this study, we found that CEMR was superior to FLAIR for quantifying the extent of leptomeningeal collaterals and reflecting arterial stenosis. It has been reported the marked leptomeningeal enhancement was attributed to engorged pial vessels with thickened arachnoid membranes and edema, while the presence of FVH was widely considered as a result of slow collateral flow2, 6. Different from acute ischemic stroke of which FVH was widely studied, the leptomeningeal collaterals of MMD were formed through a relatively long duration. Such longer formed collaterals might be less sensitive to FVH since the slow collateral flow might not be obvious like acute ischemic stroke. Our results supporting this hypothesis to some extent that FVH was inferior to CEMR to evaluate leptomeningeal collaterals in MMD concerning both accuracy and robustness. However, there were no significant correlation between both scoring modalities and mRS, suggesting scoring of leptomeningeal collaterals could not independently reflect clinical severity.Conclusion
In this study, we quantitatively assessed the capability of CEMR for scoring ivy sign compared with FLAIR in MMD. We found that in a chronic cerebrovascular disease like MMD, CEMR might be more reliable for assessing leptomeningeal collateralsAcknowledgements
None.References
1.Research Committee on the Pathology and Treatment of Spontaneous Occlusion of the Circle of Willis; Health Labour Sciences Research Grant for Research on Measures for Infractable Diseases. Guidelines for diagnosis and treatment of moyamoya disease (spontaneous occlusion of the circle of Willis). Neurol Med Chir (Tokyo), 2012. 52(5): p. 245-66.
2.HK Yoon, Shin HJ and Chang YW, "Ivy sign" in childhood moyamoya disease: depiction on FLAIR and contrast-enhanced T1-weighted MR images. Radiology, 2002. 223(2): p. 384-9.
3.PA Barber, AM Demchuk, J Zhang, et al., Validity and reliability of a quantitative computed tomography score in predicting outcome of hyperacute stroke before thrombolytic therapy. ASPECTS Study Group. Alberta Stroke Programme Early CT Score. Lancet, 2000. 355(9216): p. 1670-4.
4.YK Kaku, N Iihara, N Nakajima, et al., The leptomeningeal ivy sign on fluid-attenuated inversion recovery images in moyamoya disease: positron emission tomography study. Cerebrovasc Dis, 2013. 36(1): p. 19-25.
5.ZW Liu, C Han, F Zhao, et al., Collateral Circulation in Moyamoya Disease: A New Grading System. Stroke, 2019. 50(10): p. 2708-2715.
6.WJ Shang, , HB Chen, LM Shu, et al., The Association between FLAIR Vascular Hyperintensity and Stroke Outcome Varies with Time from Onset. AJNR Am J Neuroradiol, 2019. 40(8): p. 1317-1322.
Figures