1641
Cerebral perfusion and oxygen extraction are similar in sickle cell disease patients with hemoglobin SS and hemoglobin S-thalassemia phenotypes1Department of Radiology, Vanderbilt University Medical Center, Nashville, TN, United States, 2Department of Pediatrics, Division of Pediatric Neurology, Vanderbilt University Medical Center, Nashville, TN, United States, 3Department of Neurology, Vanderbilt University Medical Center, Nashville, TN, United States, 4Department of Pediatrics, Vanderbilt-Meharry Center for Excellence in Sickle Cell Disease, Vanderbilt University Medical Center, Nashville, TN, United States, 5Department of Internal Medicine, Division of Hematology/Oncology, Vanderbilt University Medical Center, Nashville, TN, United States, 6Department of Psychiatry, Vanderbilt University Medical Center, Nashville, TN, United States
Synopsis
Sickle cell disease (SCD) comprises multiple sickle phenotypes, yet it is assumed that most phenotypes have similar cerebral hemo-metabolic impact, despite differing hematological characteristics. Here, patients (n=120) with the two most common phenotypes, hemoglobin (Hb)-SS and HbSβ0-thalassemia, were evaluated using anatomical, cerebral blood flow (CBF)-weighted, and oxygen extraction fraction (OEF)-weighted 3T MRI. Results suggest that while CBF depends closely on hematocrit, SCD phenotype does not discriminate either CBF or OEF and anatomical findings of prior infarct and vasculopathy were not significantly different between groups. These findings are consistent with HbSβ0 and HbSS phenotypes having similar impact on cerebral hemo-metabolic dysfunction.
Introduction
Sickle cell disease (SCD) represents a group of genetically well-characterized hemoglobinopathies affecting more than 20 million individuals worldwide. The most common variant is sickle cell anemia (SCA) characterized by the presence of hemoglobin (Hb)-S (HbSS), although a less common but still frequently observed SCD phenotype is sickle beta-thalassemia null (HbSβ0) Limited evidence suggest that HbSS and HbSβ0 may not confer the same risk of neurological injury1, however this possibility has been difficult to evaluate owing to limited availability of H215O PET tracers and associated invasive measures of cerebral blood flow (CBF) and oxygen extraction fraction (OEF). In individuals with SCD, CBF increases to maintain oxygen delivery to tissue despite reduced oxygen carrying capacity; an effect that is associated with autoregulatory changes in cerebral arterioles and reduced cerebrovascular reserve capacity2. If this compensatory mechanism is insufficient to counterbalance reduced oxygen carrying capacity from anemia, or under vasculopathy, OEF can increase3, or, cerebral metabolic rate of oxygen consumption may reduce4. However, these studies have not considered phenotypes, and it is therefore unknown whether cerebral hemo-metabolic relationships differ with hemoglobinopathy variant. Here, we use multi-modal non-invasive MRI to evaluate CBF and OEF in patients with SCD and evaluate the dependence of these parameters for the first time on standard indicators of disease severity and hemoglobin phenotype.Methods
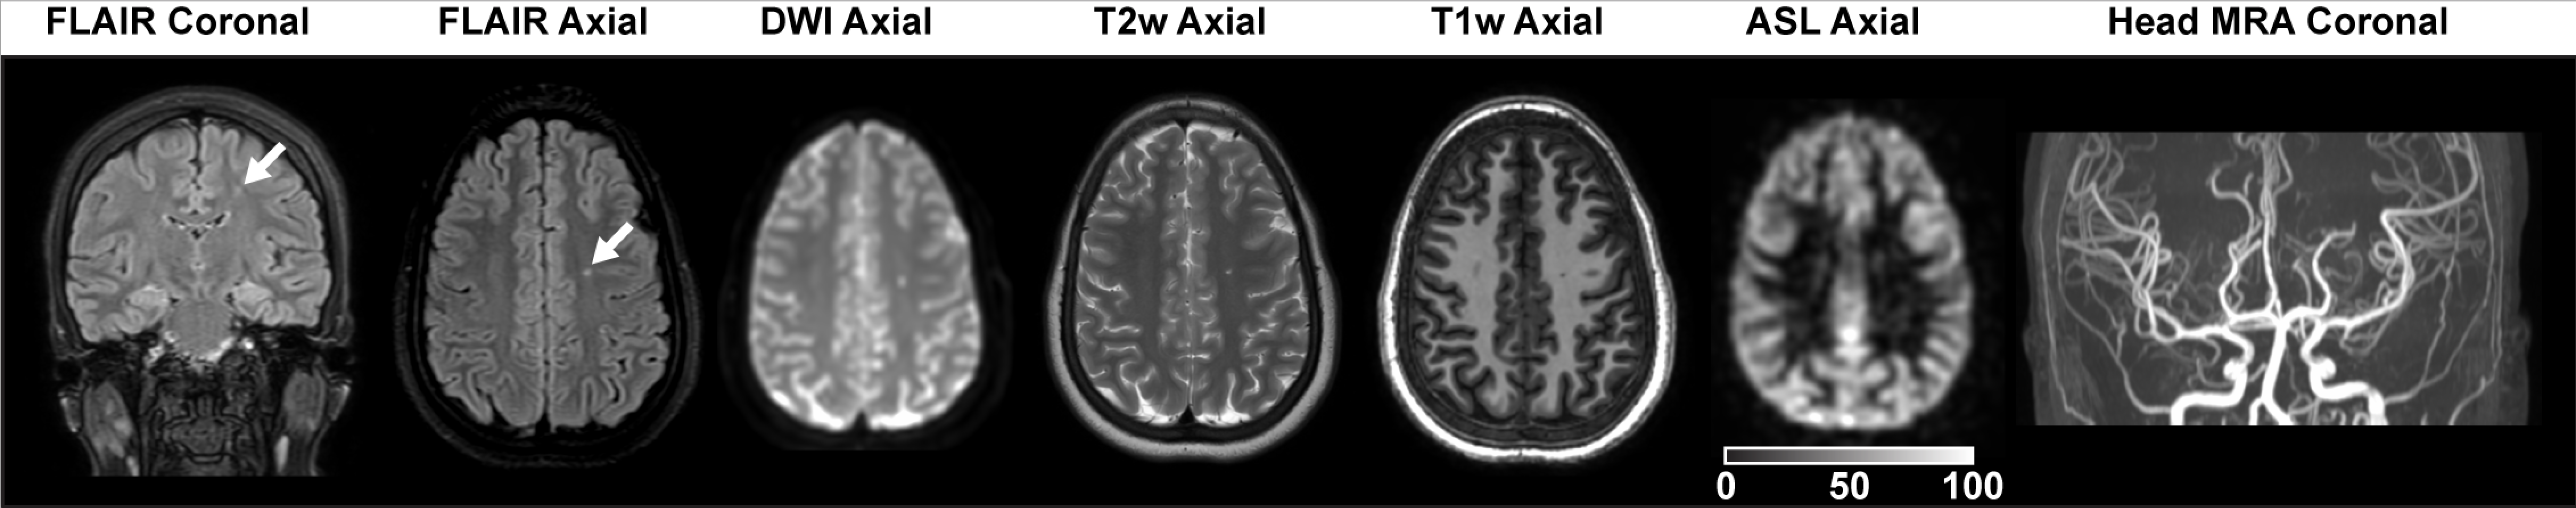
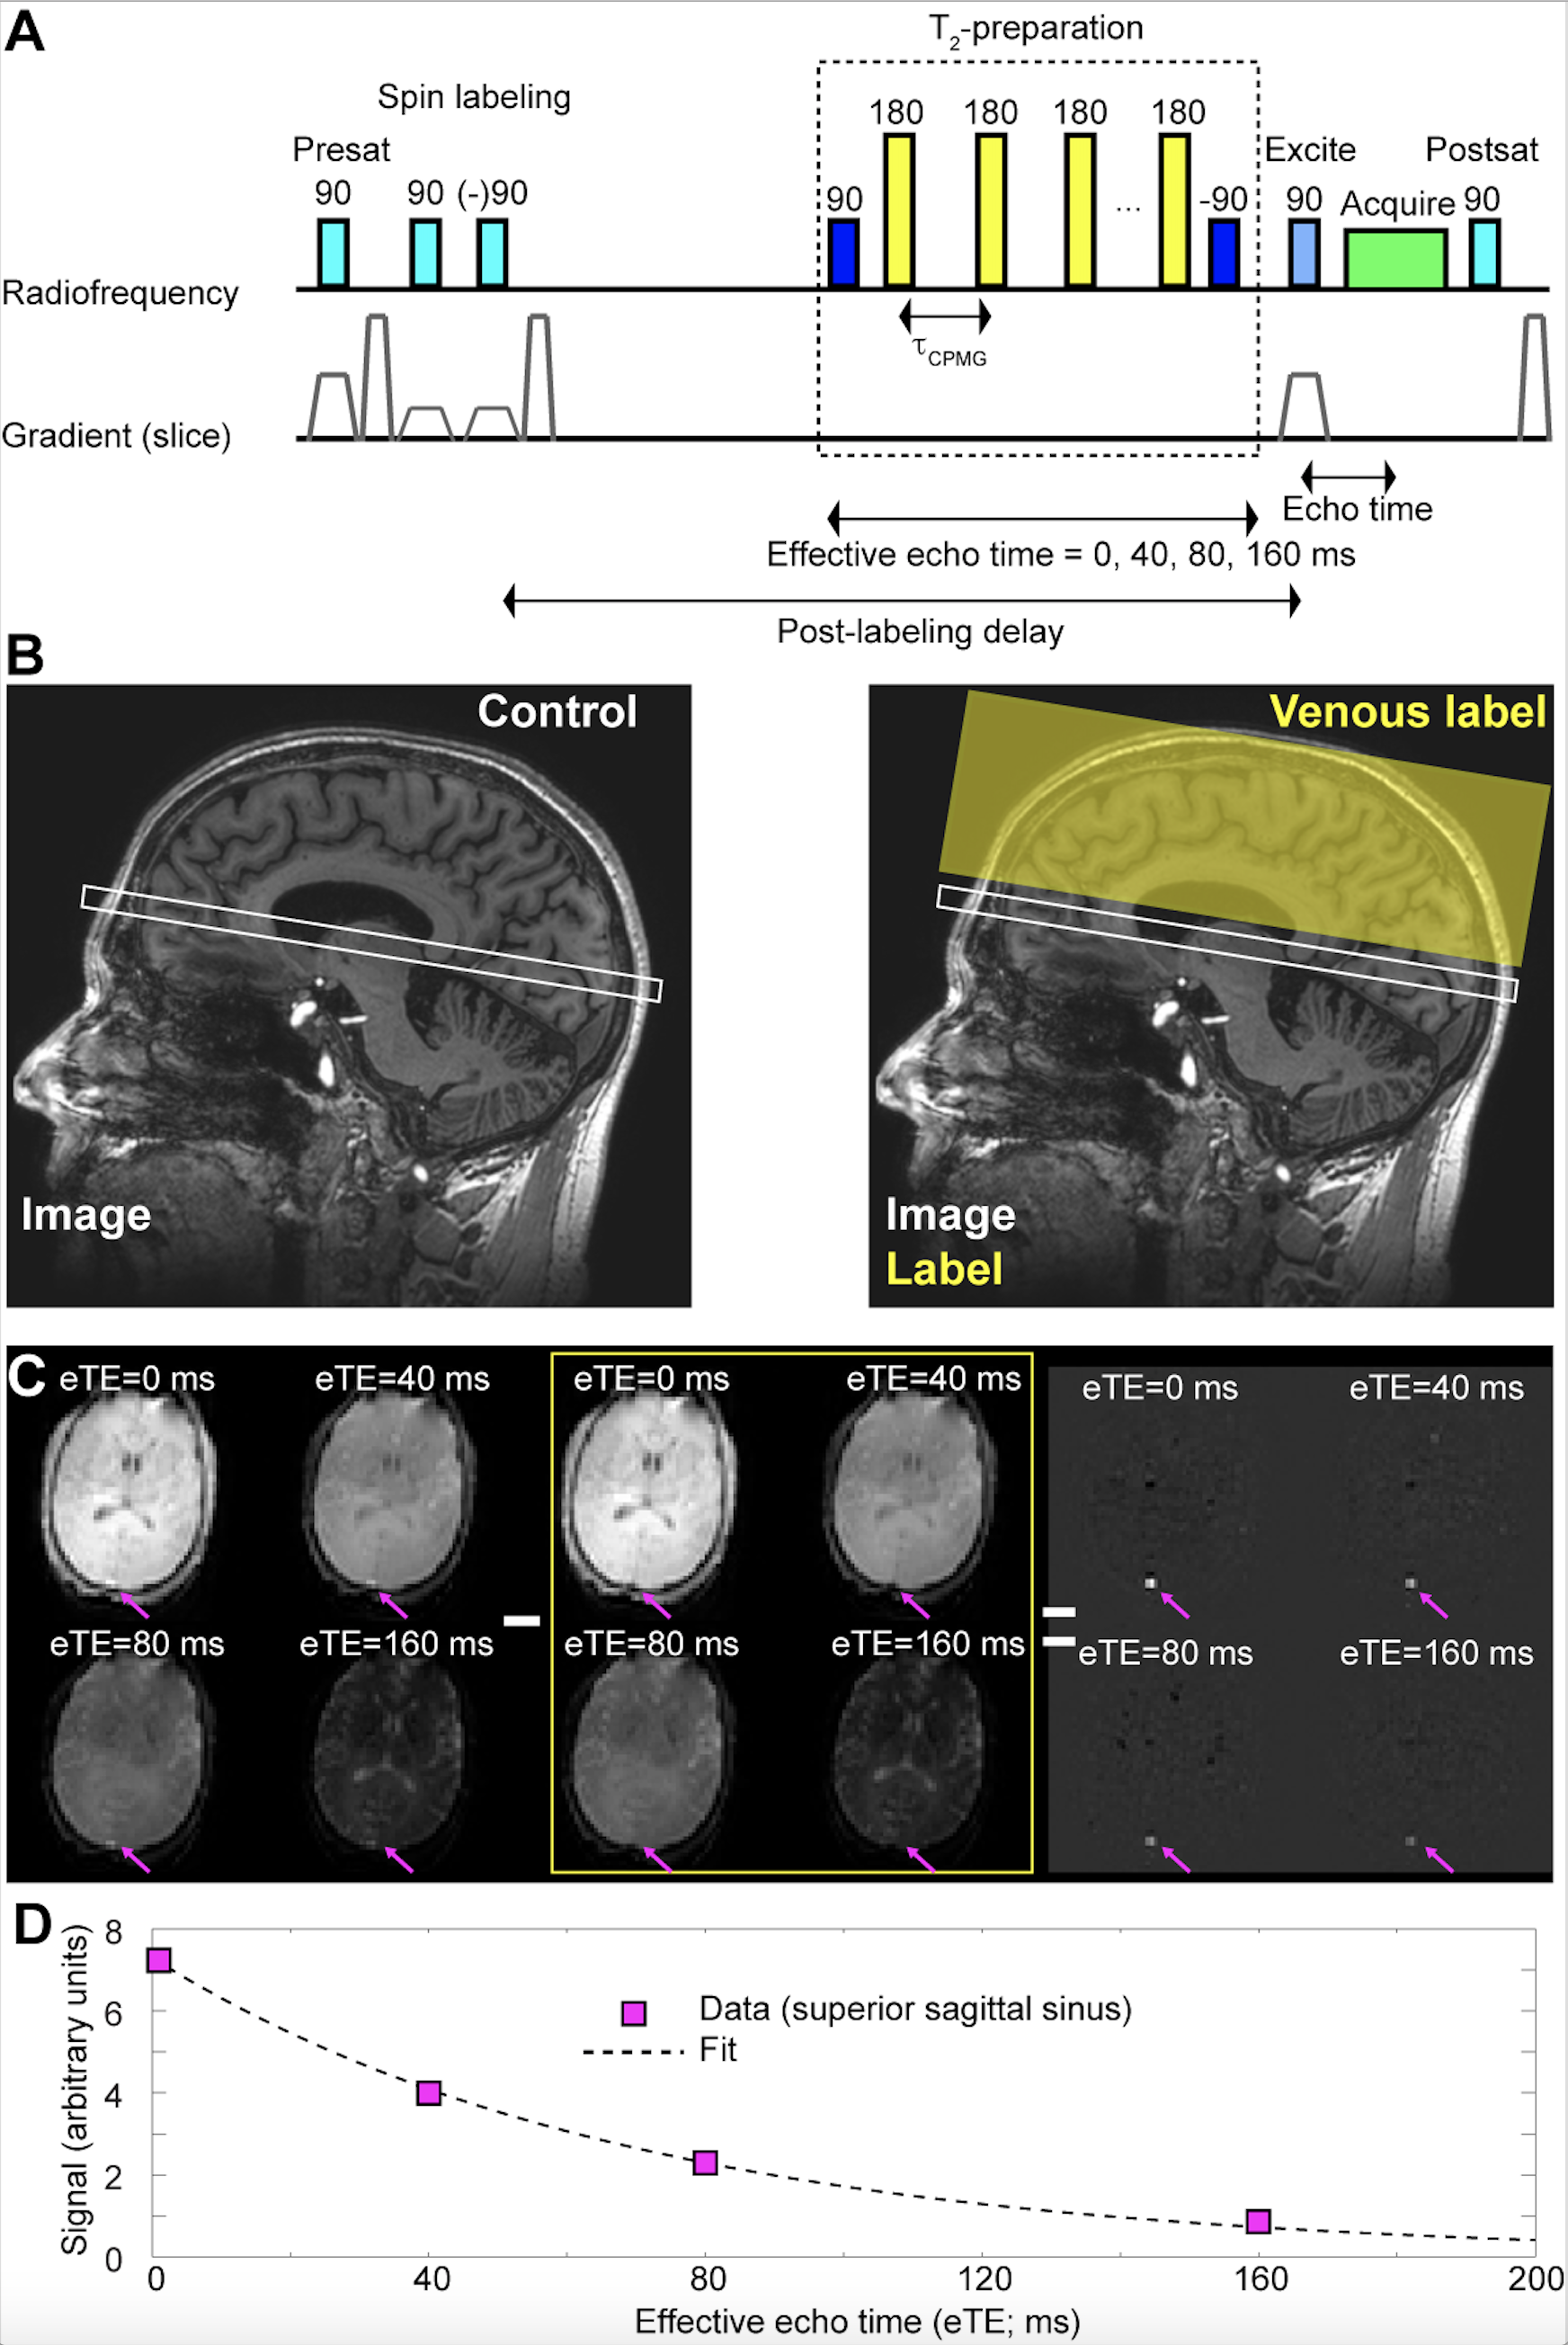
All volunteers (n=120; phenotype HbSS or HbSβ0; age=6-40 years) were recruited sequentially from a comprehensive SCD clinic and provided informed, written consent. Hemoglobinopathy was determined by high performance liquid chromatography. Standard MRI (T1-weighted, T2-weighted, T2-weighted FLAIR in two planes, diffusion weighted imaging) and intracranial and cervical angiography (MRA) were performed at 3.0T (Philips Healthcare, Best, The Netherlands) (Figure 1). To evaluate hemo-metabolic information, pseudo-continuous arterial spin labeling (pCASL; labeling duration=1900 ms; spatial resolution=3x3x7 mm3) for CBF determination and T2-relaxation-under-spin-tagging (TRUST; effective echo times = 0, 40, 80, 160 ms; tCPMG=10 ms) for OEF determination were applied (Figure 2). Hemoglobin was measured within seven days of the scan from venipuncture; physiological monitoring (In Vivo Research, Inc., Orlando, FL, USA) included arterial oxygenation saturation via pulse oximetry, heart rate, and blood pressure.Cervical and major intracranial vessels for each participant were assessed for vasculopathy. FLAIR and T1-weighted MRI were evaluated for infarct determination by two board-certified neuroradiologists. Gray matter CBF was quantified from pCASL data utilizing a two-compartment model that accounts for differences between blood and tissue relaxation times, with subject-specific arterial blood longitudinal relaxation times (T1) based on measured hematocrit and labeling efficiency of 0.72 as previously quantified . For OEF quantification, T2 values from TRUST‐MRI were converted to venous oxygen saturation (Yv). Due to participants having different hemoglobin phenotypes and different hemoglobin calibration curves being available, OEF is reported using a HbSS model4, HbAA model6, and bovine blood model7. Two separate linear regressions were performed, which utilized either CBF or OEF as the dependent variable and candidate variables determined from bivariate analysis as explanatory variables: (i) age (ii) sex, (iii) hematocrit, and (iv) hemoglobin phenotype. In regression analyses, two-sided p-values, 95% confidence intervals, and t-statistics are reported, with common significance criteria two-sided p<0.05.
Results
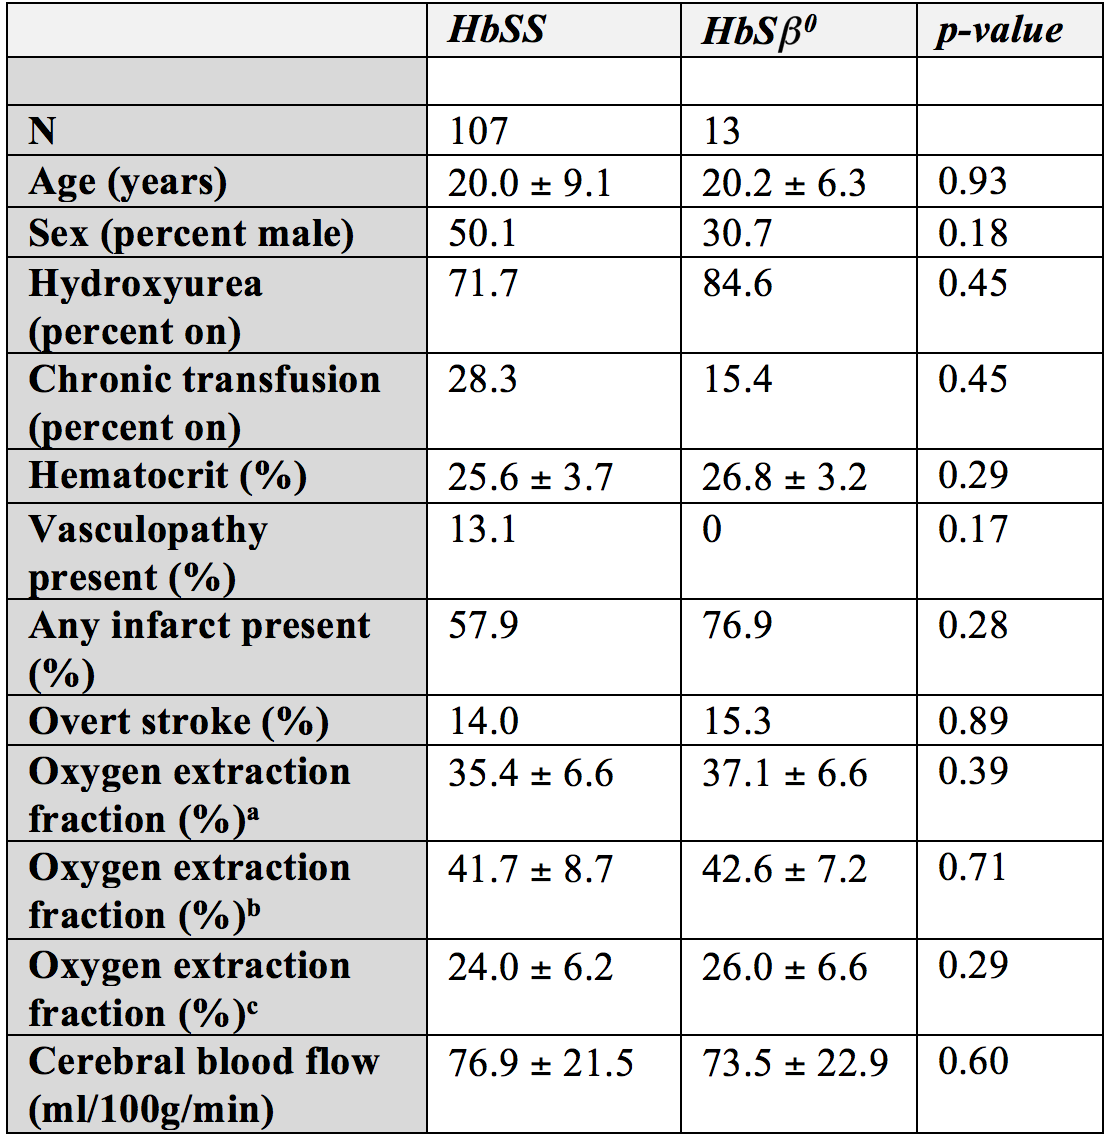
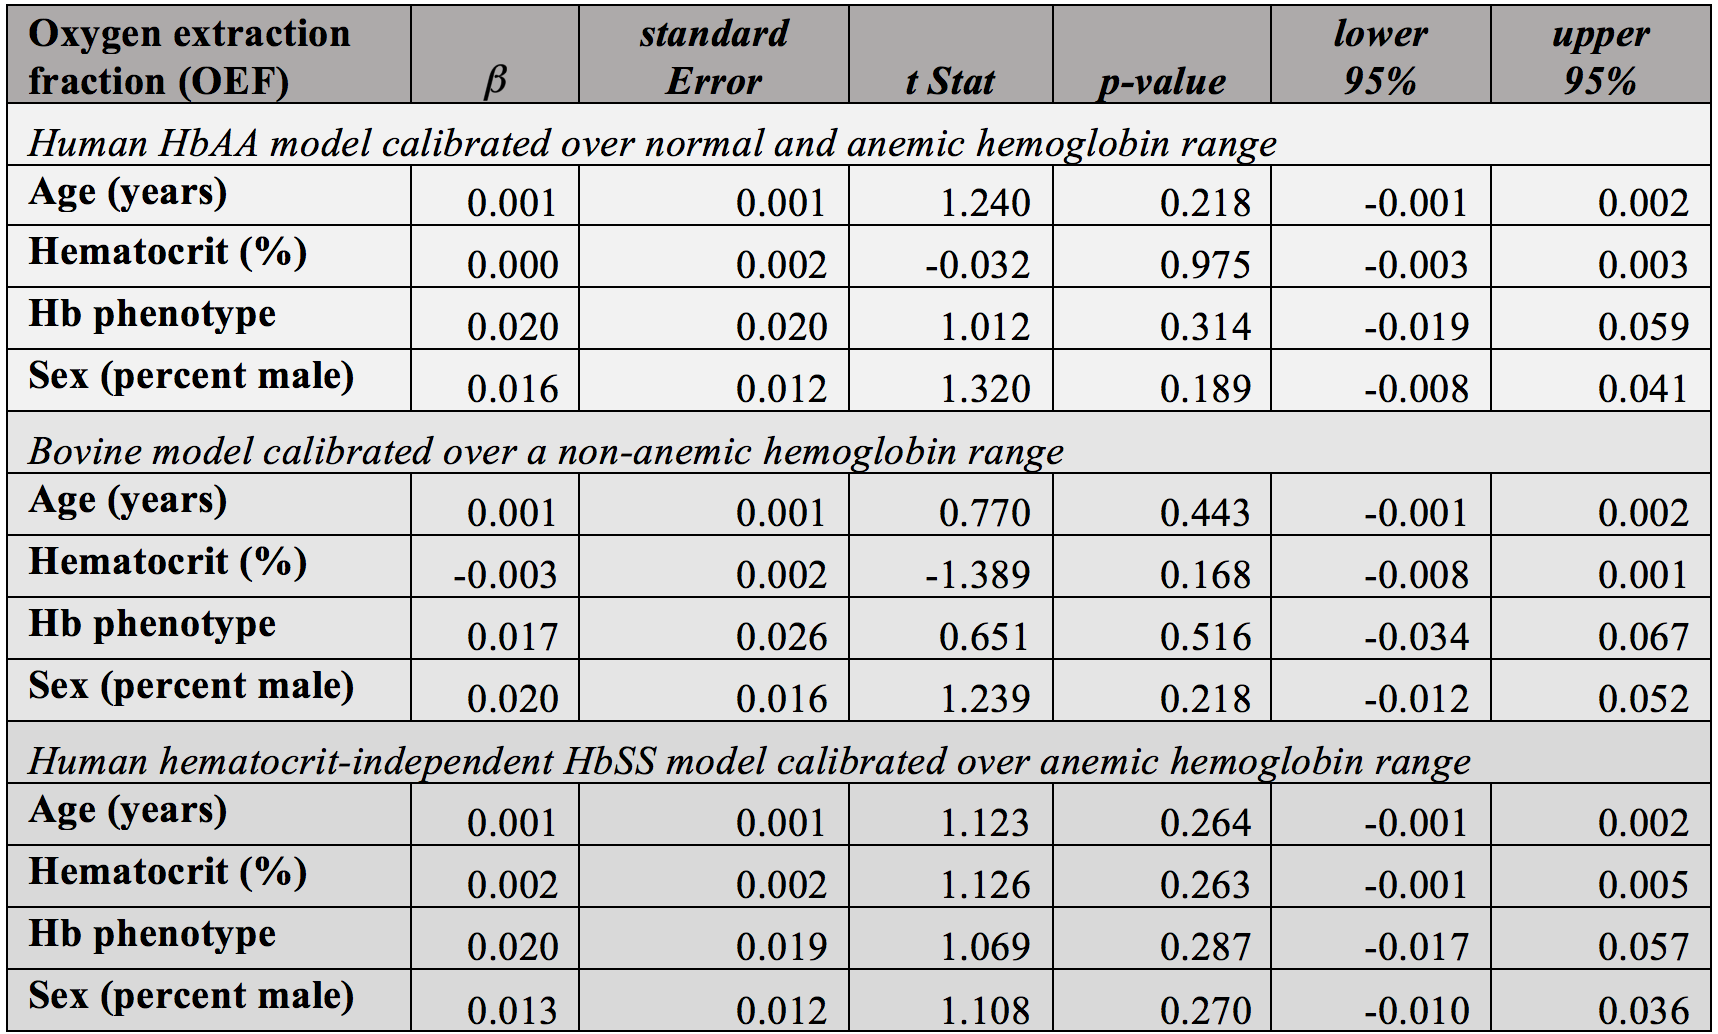
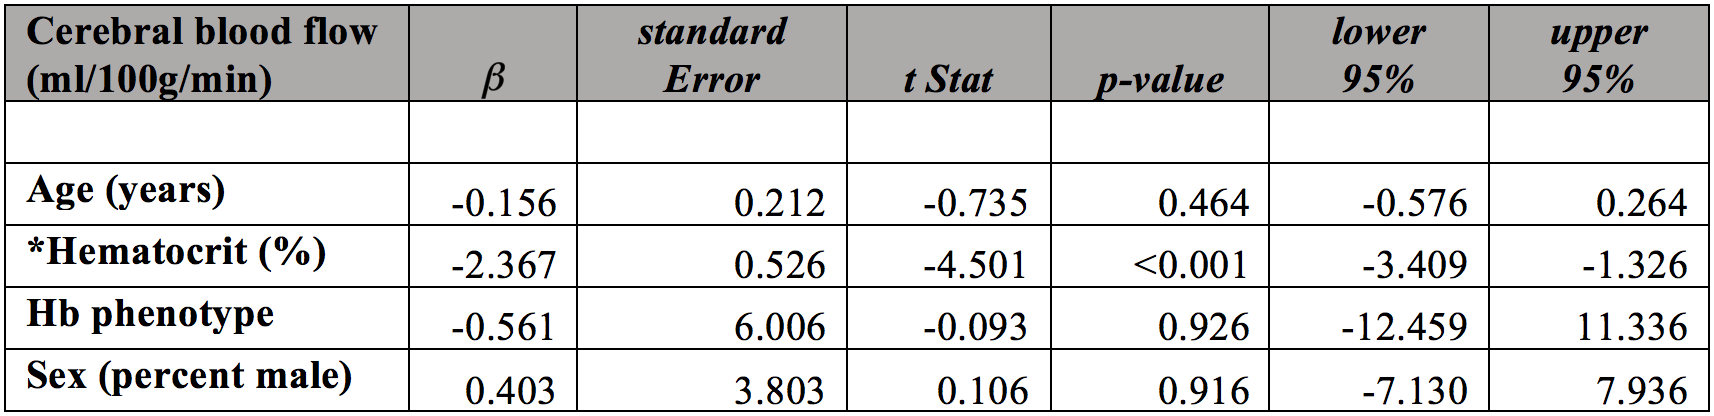
Of the cumulative 120 participants, 13 (10.8%) were determined to have HbSβ0 variant and 107 (89.2%) had HbSS hemoglobin variant. Table 1 summarizes the variables of interest between the two groups. In group comparisons, on average no parameters were significantly different between groups. However, as nearly all parameters have been established to vary with disease severity and demographics, regression analysis was performed to provide additional information.Tables 2-3 summarize the results of the regression analysis, in which linear regression was performed using either OEF (Table 2) or CBF (Table 3) as the dependent variables of interest. While the absolute OEF values differed when using the different calibration models, for no model was there a significant dependence of OEF on hemoglobin phenotype. When analysis was repeated using CBF as the dependent variable, we observed a significant inverse relationship between CBF and hematocrit. No other explanatory variables, including hemoglobin phenotype, were significantly related to CBF.
Discussion
We evaluated a cohort of 120 patients with SCD phenotypes HbSS and HbSβ0 followed between 2015 and 2019 with anatomical, angiographic, and novel hemo-metabolic MRI to understand whether hemoglobin variations had any significant impact on CBF or OEF. The primary finding was that no significant evidence was found for a difference in either CBF or OEF between groups. We did observe trends for HbSβ0 patients having (i) slightly higher hematocrit after accounting for large-scale treatment heterogeneity, and (ii) reduced levels of vasculopathy. However, the cumulative influence of these factors appeared to have no significant impact on cerebral tissue level hemodynamic phenomena in this cohort. Importantly for this study, all calibration models produced no trend between OEF and SCD phenotype.Conclusion
We performed quantitative non-invasive MRI measures of CBF and OEF in 120 SCD participants with differing hemoglobin phenotype. Trends for less severe vasculopathy and increased hematocrit in the HbSβ0 versus HbSS participants were observed, however findings support that these two sickle phenotypes influence common hematological and brain hemo-metabolic parameters similarly.Acknowledgements
No acknowledgement found.References
1. Serjeant GR, Sommereux AM, Stevenson M, Mason K, Serjeant BE. Comparison of sickle cell-beta0 thalassaemia with homozygous sickle cell disease. British journal of haematology. 1979;41(1):83-93. 2. Vaclavu L, Meynart BN, Mutsaerts H, et al. Hemodynamic provocation with acetazolamide shows impaired cerebrovascular reserve in adults with sickle cell disease. Haematologica. 2019;104(4):690-699. 3. Fields ME, Guilliams KP, Ragan DK, et al. Regional oxygen extraction predicts border zone vulnerability to stroke in sickle cell disease. Neurology. 2018;90(13):e1134-e1142. 4. Bush AM, Coates TD, Wood JC. Diminished cerebral oxygen extraction and metabolic rate in sickle cell disease using T2 relaxation under spin tagging MRI. Magnetic resonance in medicine. 2017. 5. Juttukonda MR, Jordan LC, Gindville MC, et al. Cerebral hemodynamics and pseudo-continuous arterial spin labeling considerations in adults with sickle cell anemia. NMR in biomedicine. 2017;30(2). 6. Bush A, Borzage M, Detterich J, et al. Empirical model of human blood transverse relaxation at 3 T improves MRI T2 oximetry. Magn Reson Med. 2017;77(6):2364-2371. 7. Lu H, Xu F, Grgac K, Liu P, Qin Q, van Zijl P. Calibration and validation of TRUST MRI for the estimation of cerebral blood oxygenation. Magn Reson Med. 2012;67(1):42-49.Figures