1638
Venous Oxygenation in Sickle Cell Patients and Controls using Quantitative Susceptibility Mapping versus T2-relaxation-under-spin-tagging1Imaging and Biophysics, Developmental Nerosciences, UCL Great Ormond St Institute of Child Health, London, United Kingdom, 2Department of Medical Physics and Biomedical Engineering, University College London, London, United Kingdom, 3Biomedical Engineering & Imaging Sciences, Kings College London, London, United Kingdom
Synopsis
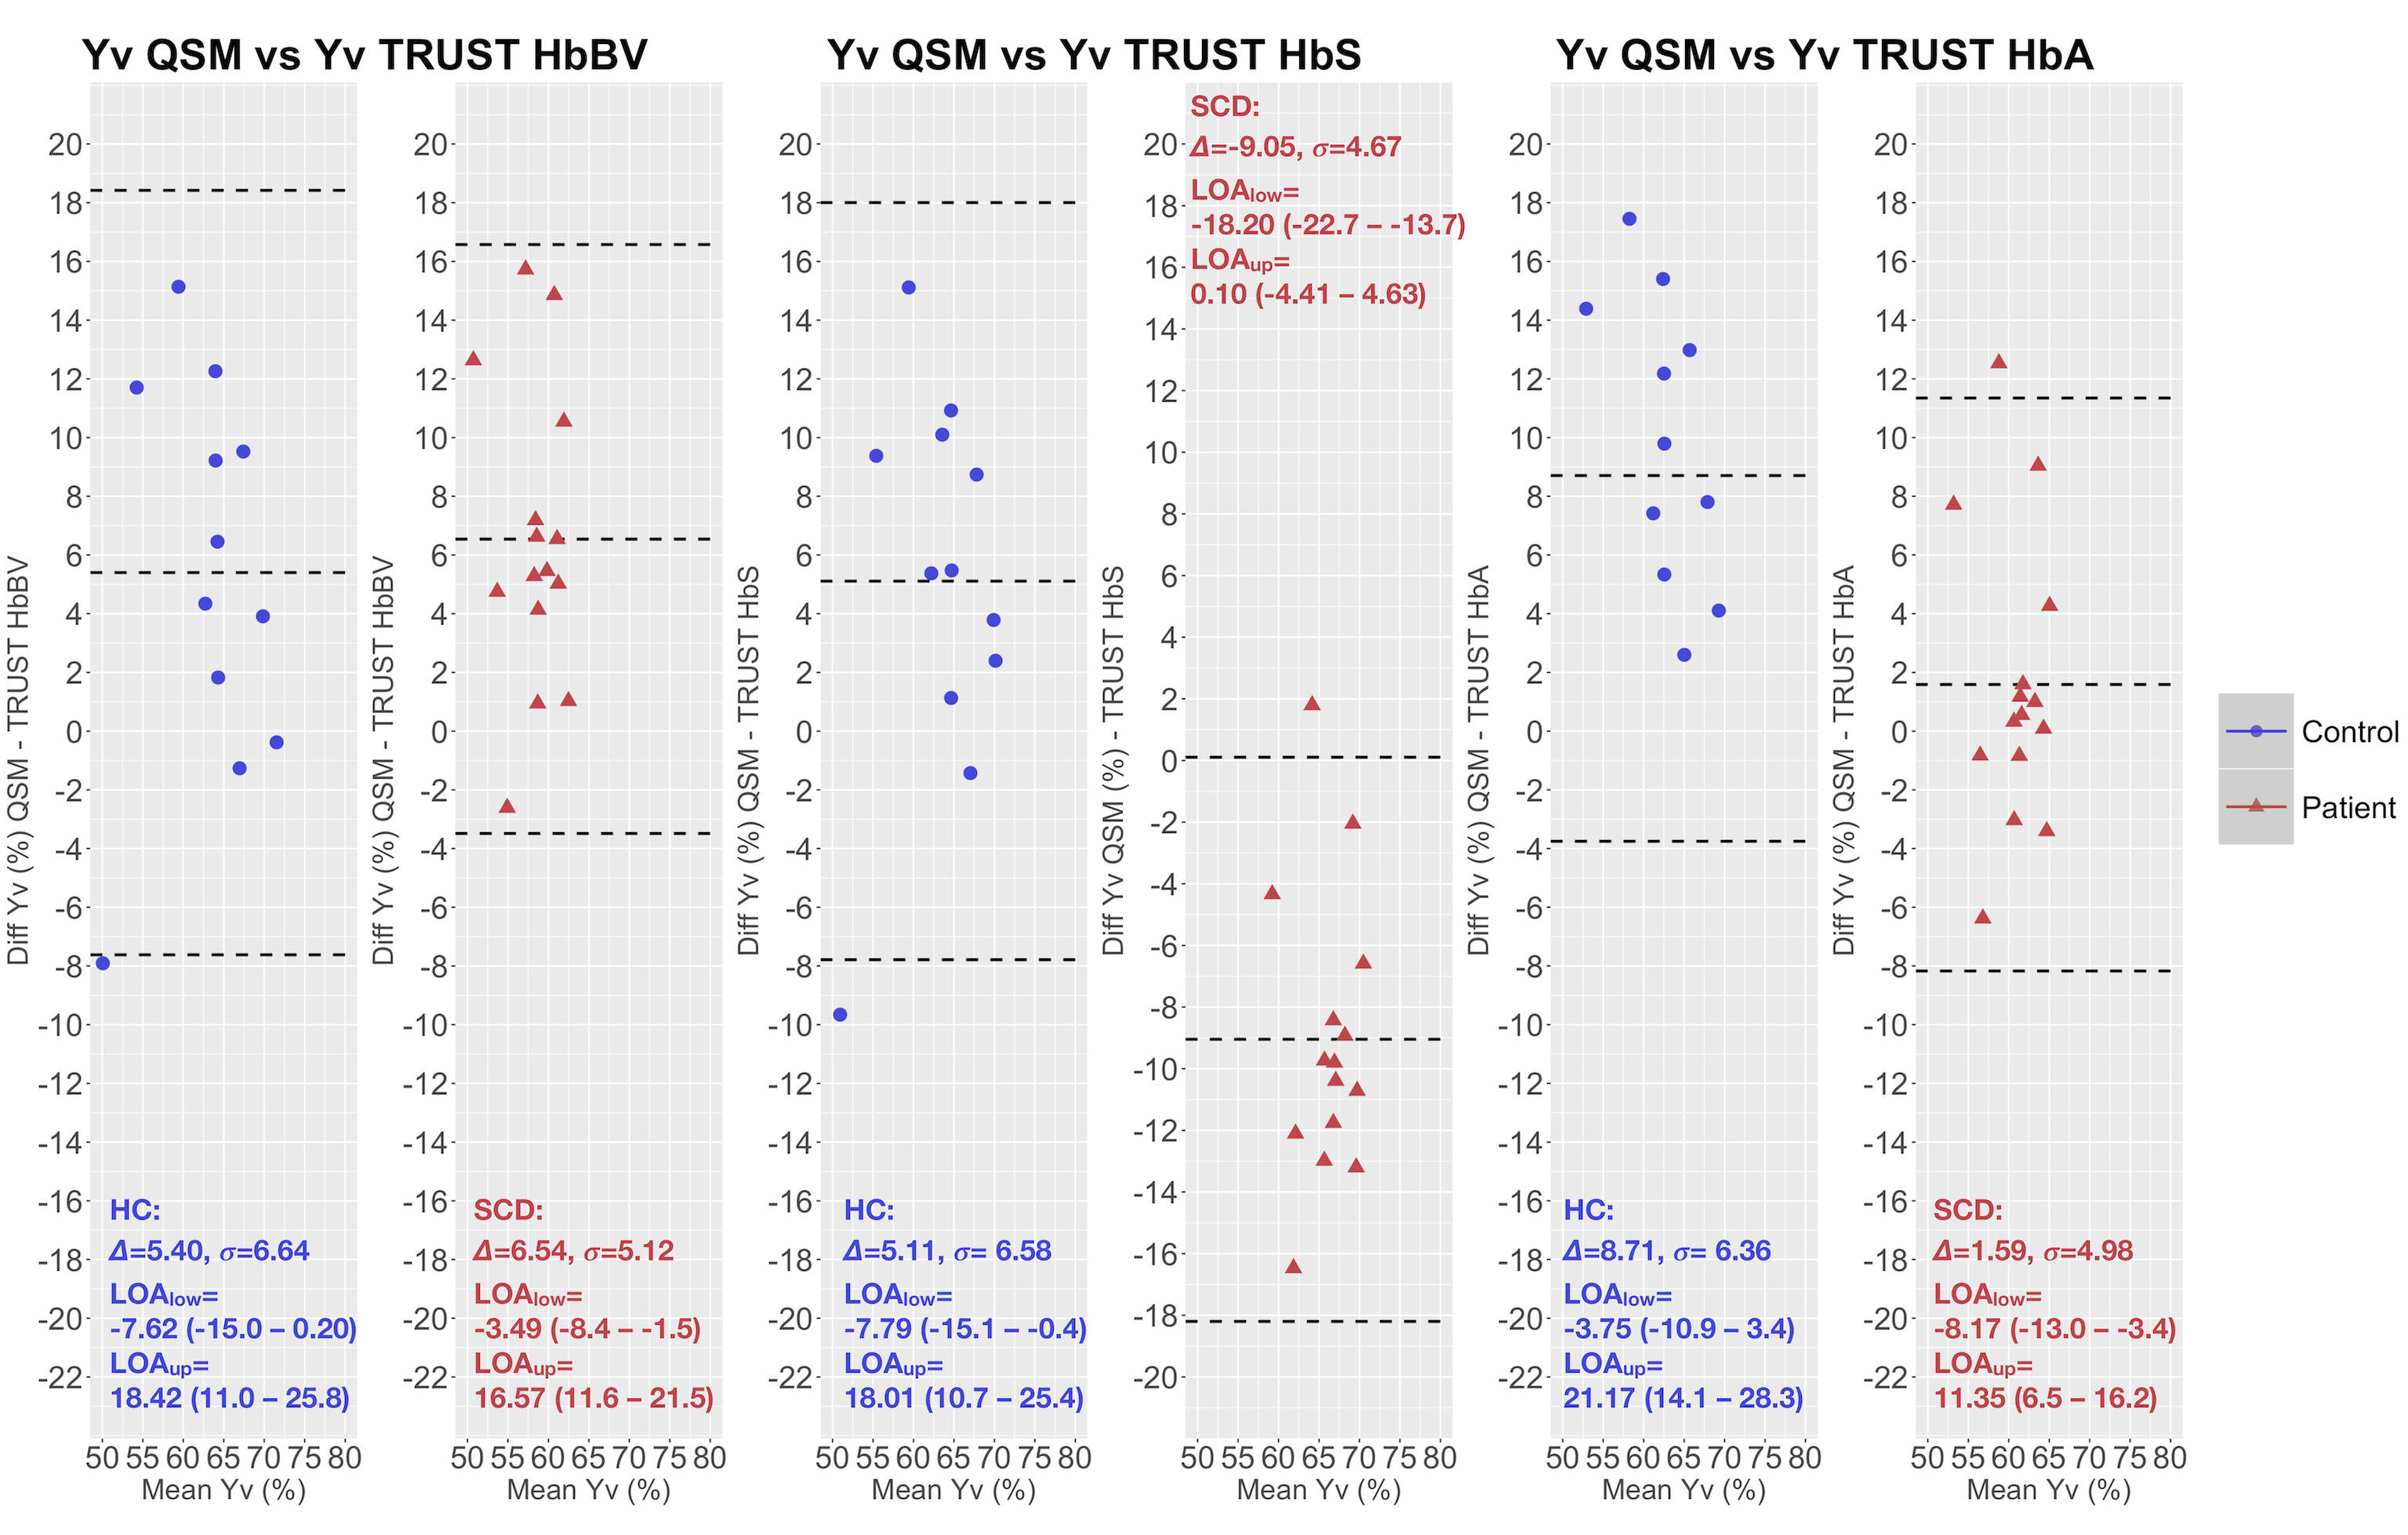
In 15 homozygous sickle-cell disease patients (SCD; hemoglobin-SS) and 12 healthy controls (HC; 10 Hb-AA, 2 Hb-AS), we compared a quantitative susceptibility mapping (QSM)-based estimate of venous oxygen saturation (Yv) with T2-relaxation-under-spin-tagging (TRUST)-based estimates using bovine-hemoglobin (TRUST-HbBV), hemoglobin-S (TRUST-HbS), or hemoglobin-A (TRUST-HbA) calibrations. Agreement between methods varied, with QSM-Yv estimates in HC and SCD respectively on average 5-6% higher versus TRUST-HbBV, 5% higher and 9% lower versus TRUST-HbS, and 9% higher and 2% lower versus TRUST-HbA. Across all comparisons, the limits of agreement were wide (18-26%) underscoring the need for further studies comparing non-invasive methods with gold-standard jugular vein catheterization.
Introduction
Interest has grown in the potential for MRI estimates of venous oxygen saturation (Yv) to improve neurological risk prediction in sickle cell disease (SCD)1–3. However, many oxygen-sensitive MRI techniques rely on calibration models, which may be invalid in conditions such as SCD where alterations in blood rheology challenge assumptions.T2-relaxation-under-spin-tagging (TRUST) is used widely for estimating Yv based on the principle that the transverse relaxation time (T2) of blood is dependent on its oxygenation saturation4. Whilst TRUST has revealed changes in Yv in SCD, Yv can appear either elevated or reduced depending on whether the calibration model is based on bovine-hemoglobin (HbBV)1,4, hemoglobin-A (HbA)5, or hemoglobin-S (HbS)2 blood.
Yv can also be measured using quantitative susceptibility mapping (QSM) which calculates the spatial distribution of magnetic susceptibility (χ) from gradient-echo phase images6. QSM assumes that χ measured in venous voxels (χvein-water) is linearly related to Yv by:
$$$ Y_{v} = 1-\frac{\Delta \chi _{vein-water} - \Delta_{oxy-water} \cdot Hct}{\Delta \chi_{do} \cdot Hct} $$$ [1]
where hematocrit (Hct) is the percentage of erythrocytes in blood, ∆χdo is the χ shift between fully oxygenated and de-oxygenated erythrocytes (0.27x4π ppm [SI]) and ∆χoxy-water is the χ shift between oxygenated erythrocytes and water (-0.03x4π ppm [SI])7.
Previous work has demonstrated no significant χ difference between deoxyhemoglobin in sickle and normal erythrocytes8, suggesting that QSM may be valid in both SCD and healthy controls (HC). Moreover, whereas TRUST only provides an estimate of global Yv from the T2 relaxation within a few voxels, QSM provides estimates throughout the venous vasculature. Despite these potential advantages, there have been no QSM-Yv studies in SCD. Therefore, aiming to improve our understanding of Yv estimation in SCD, we compared agreement between QSM and TRUST estimates.
Methods
15 SCD patients (median age=19.80 years, 7 male) and 12 HC (race- and age-matched, median age=20.30 years, 4 male, 2 HbAS) underwent MRI and pulse oximetry for estimation of peripheral oxygen saturation (SpO2). We used literature values of 0.47 for hematocrit in HC males9, 0.41 in HC females9, 0.27 in SCD males10, and 0.25 in SCD females10.MRI Acquisition
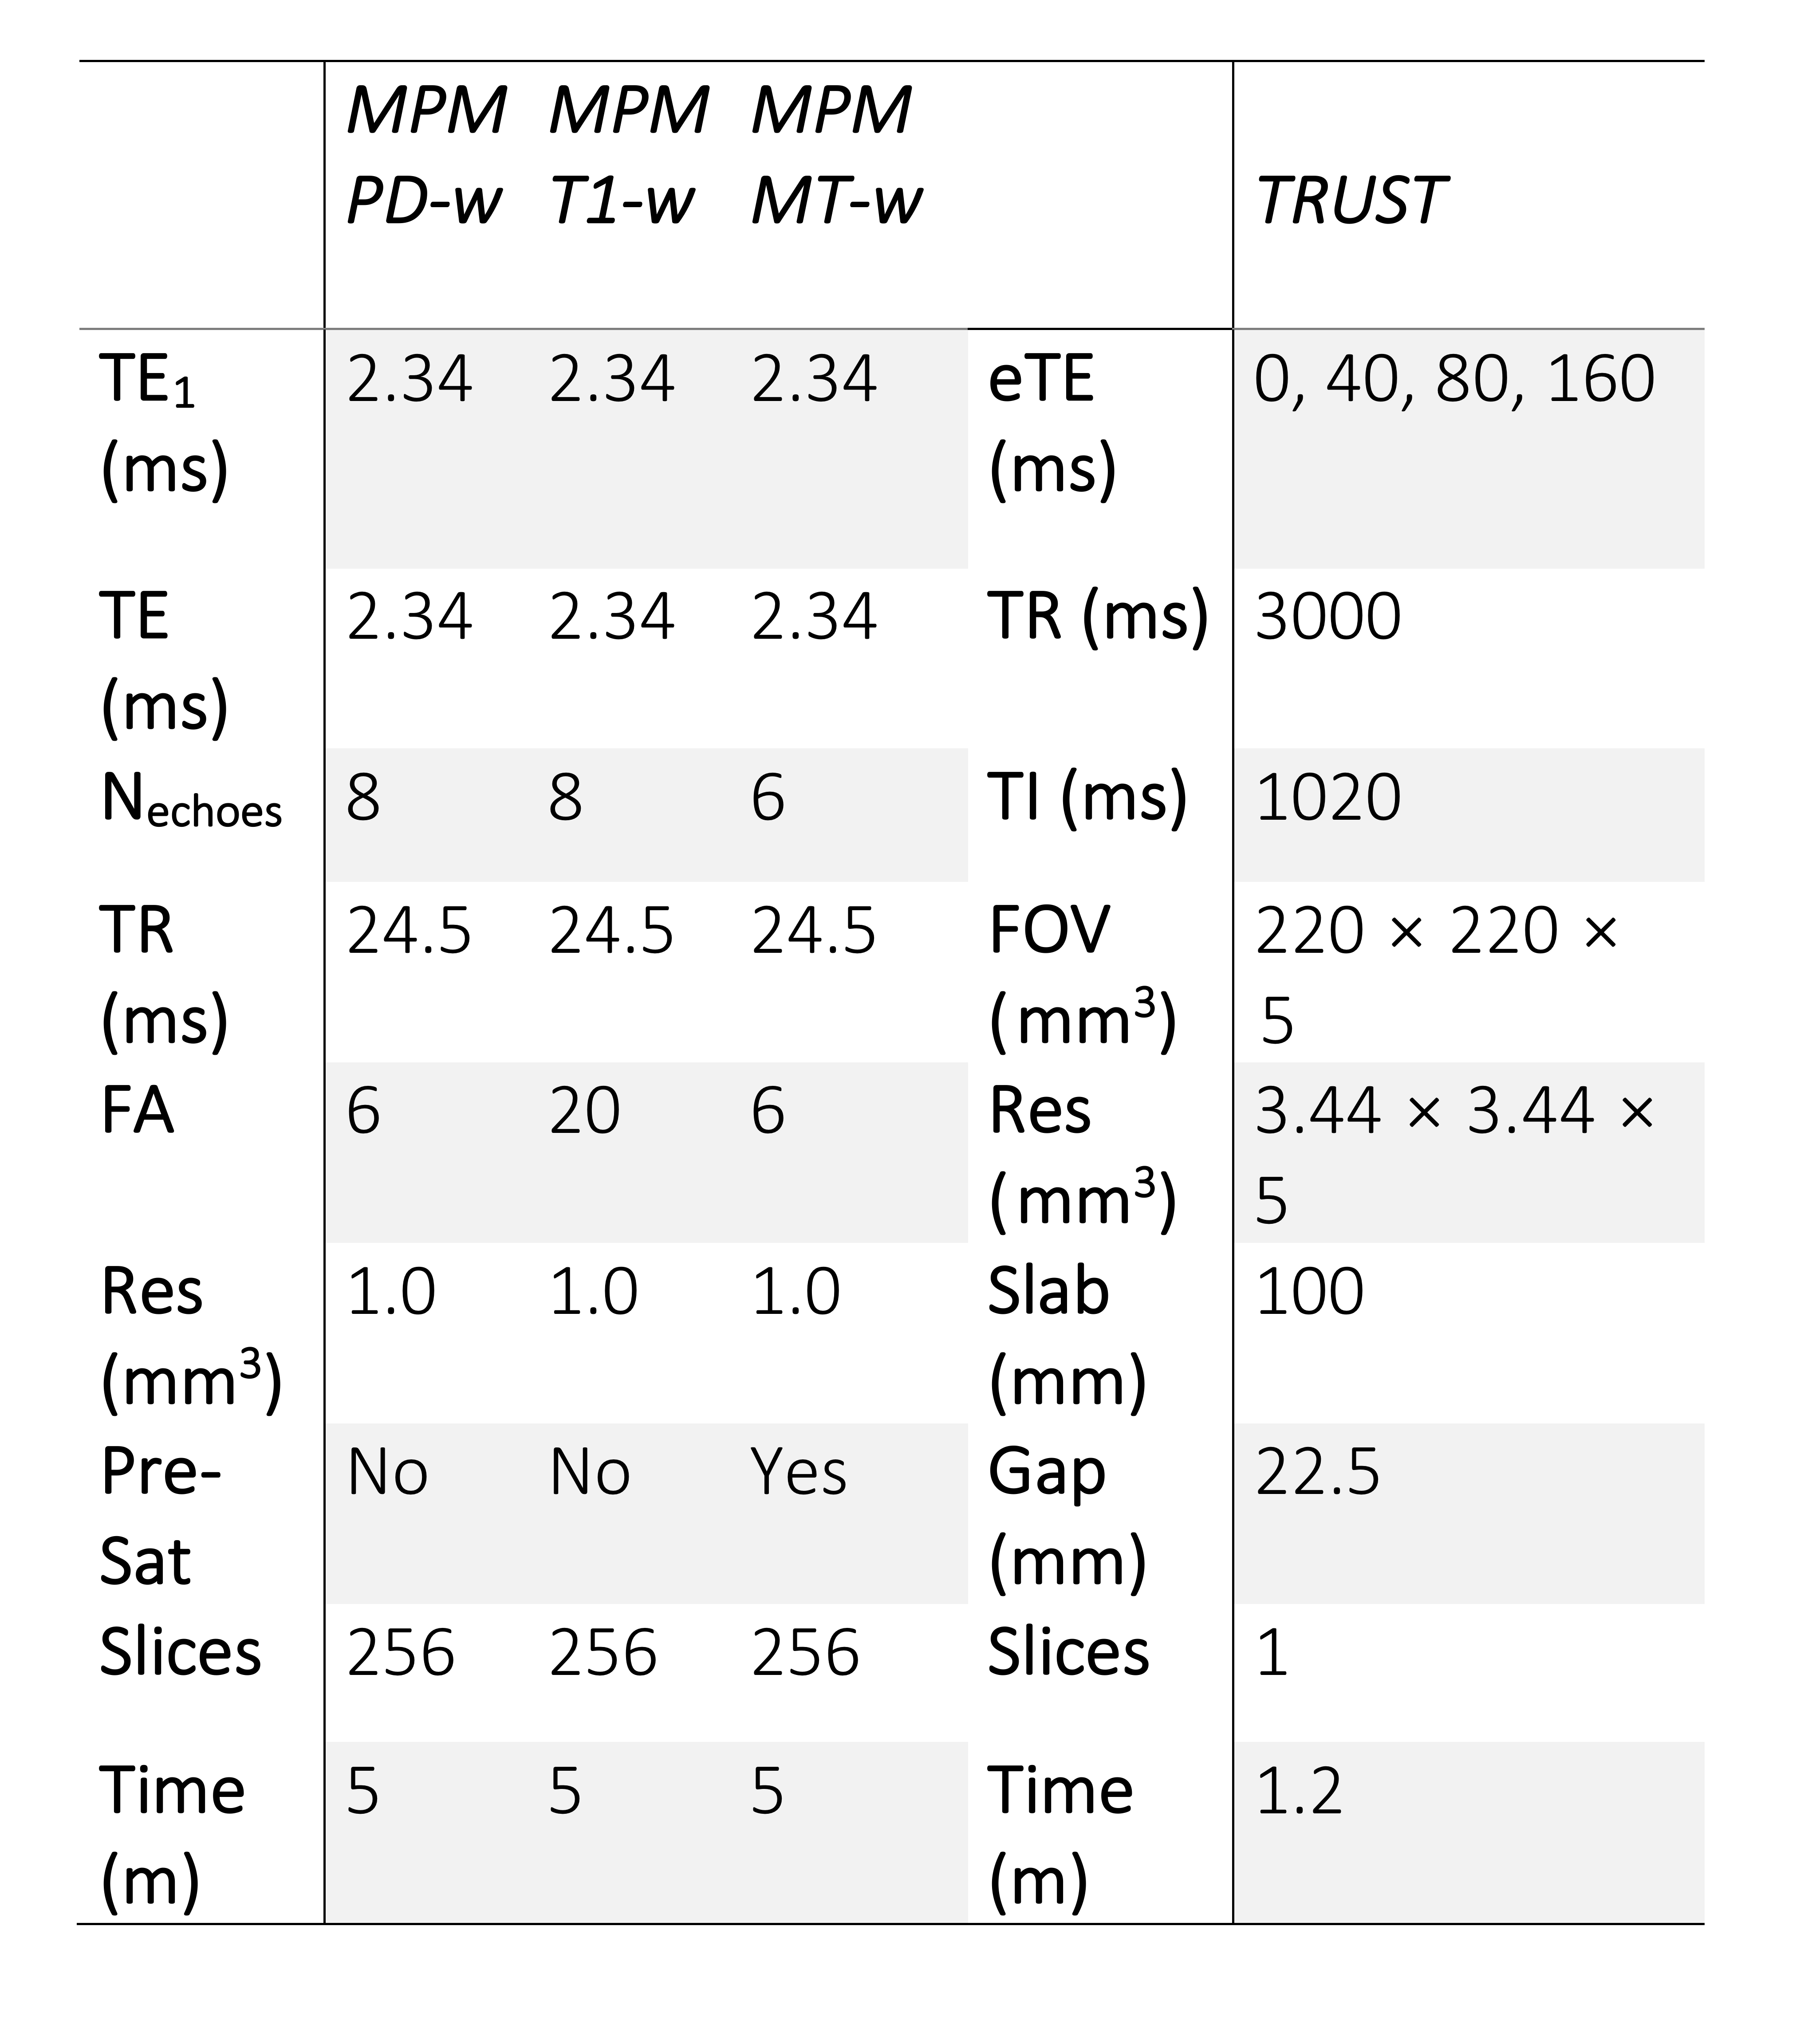
MRI was acquired using a 3T Siemens Prisma system with 80 mT/m gradients and a 64-channel receiver coil. The protocol included established TRUST4 and multi-parametric-mapping (MPM)11 sequences (Fig. 1).
MRI Processing
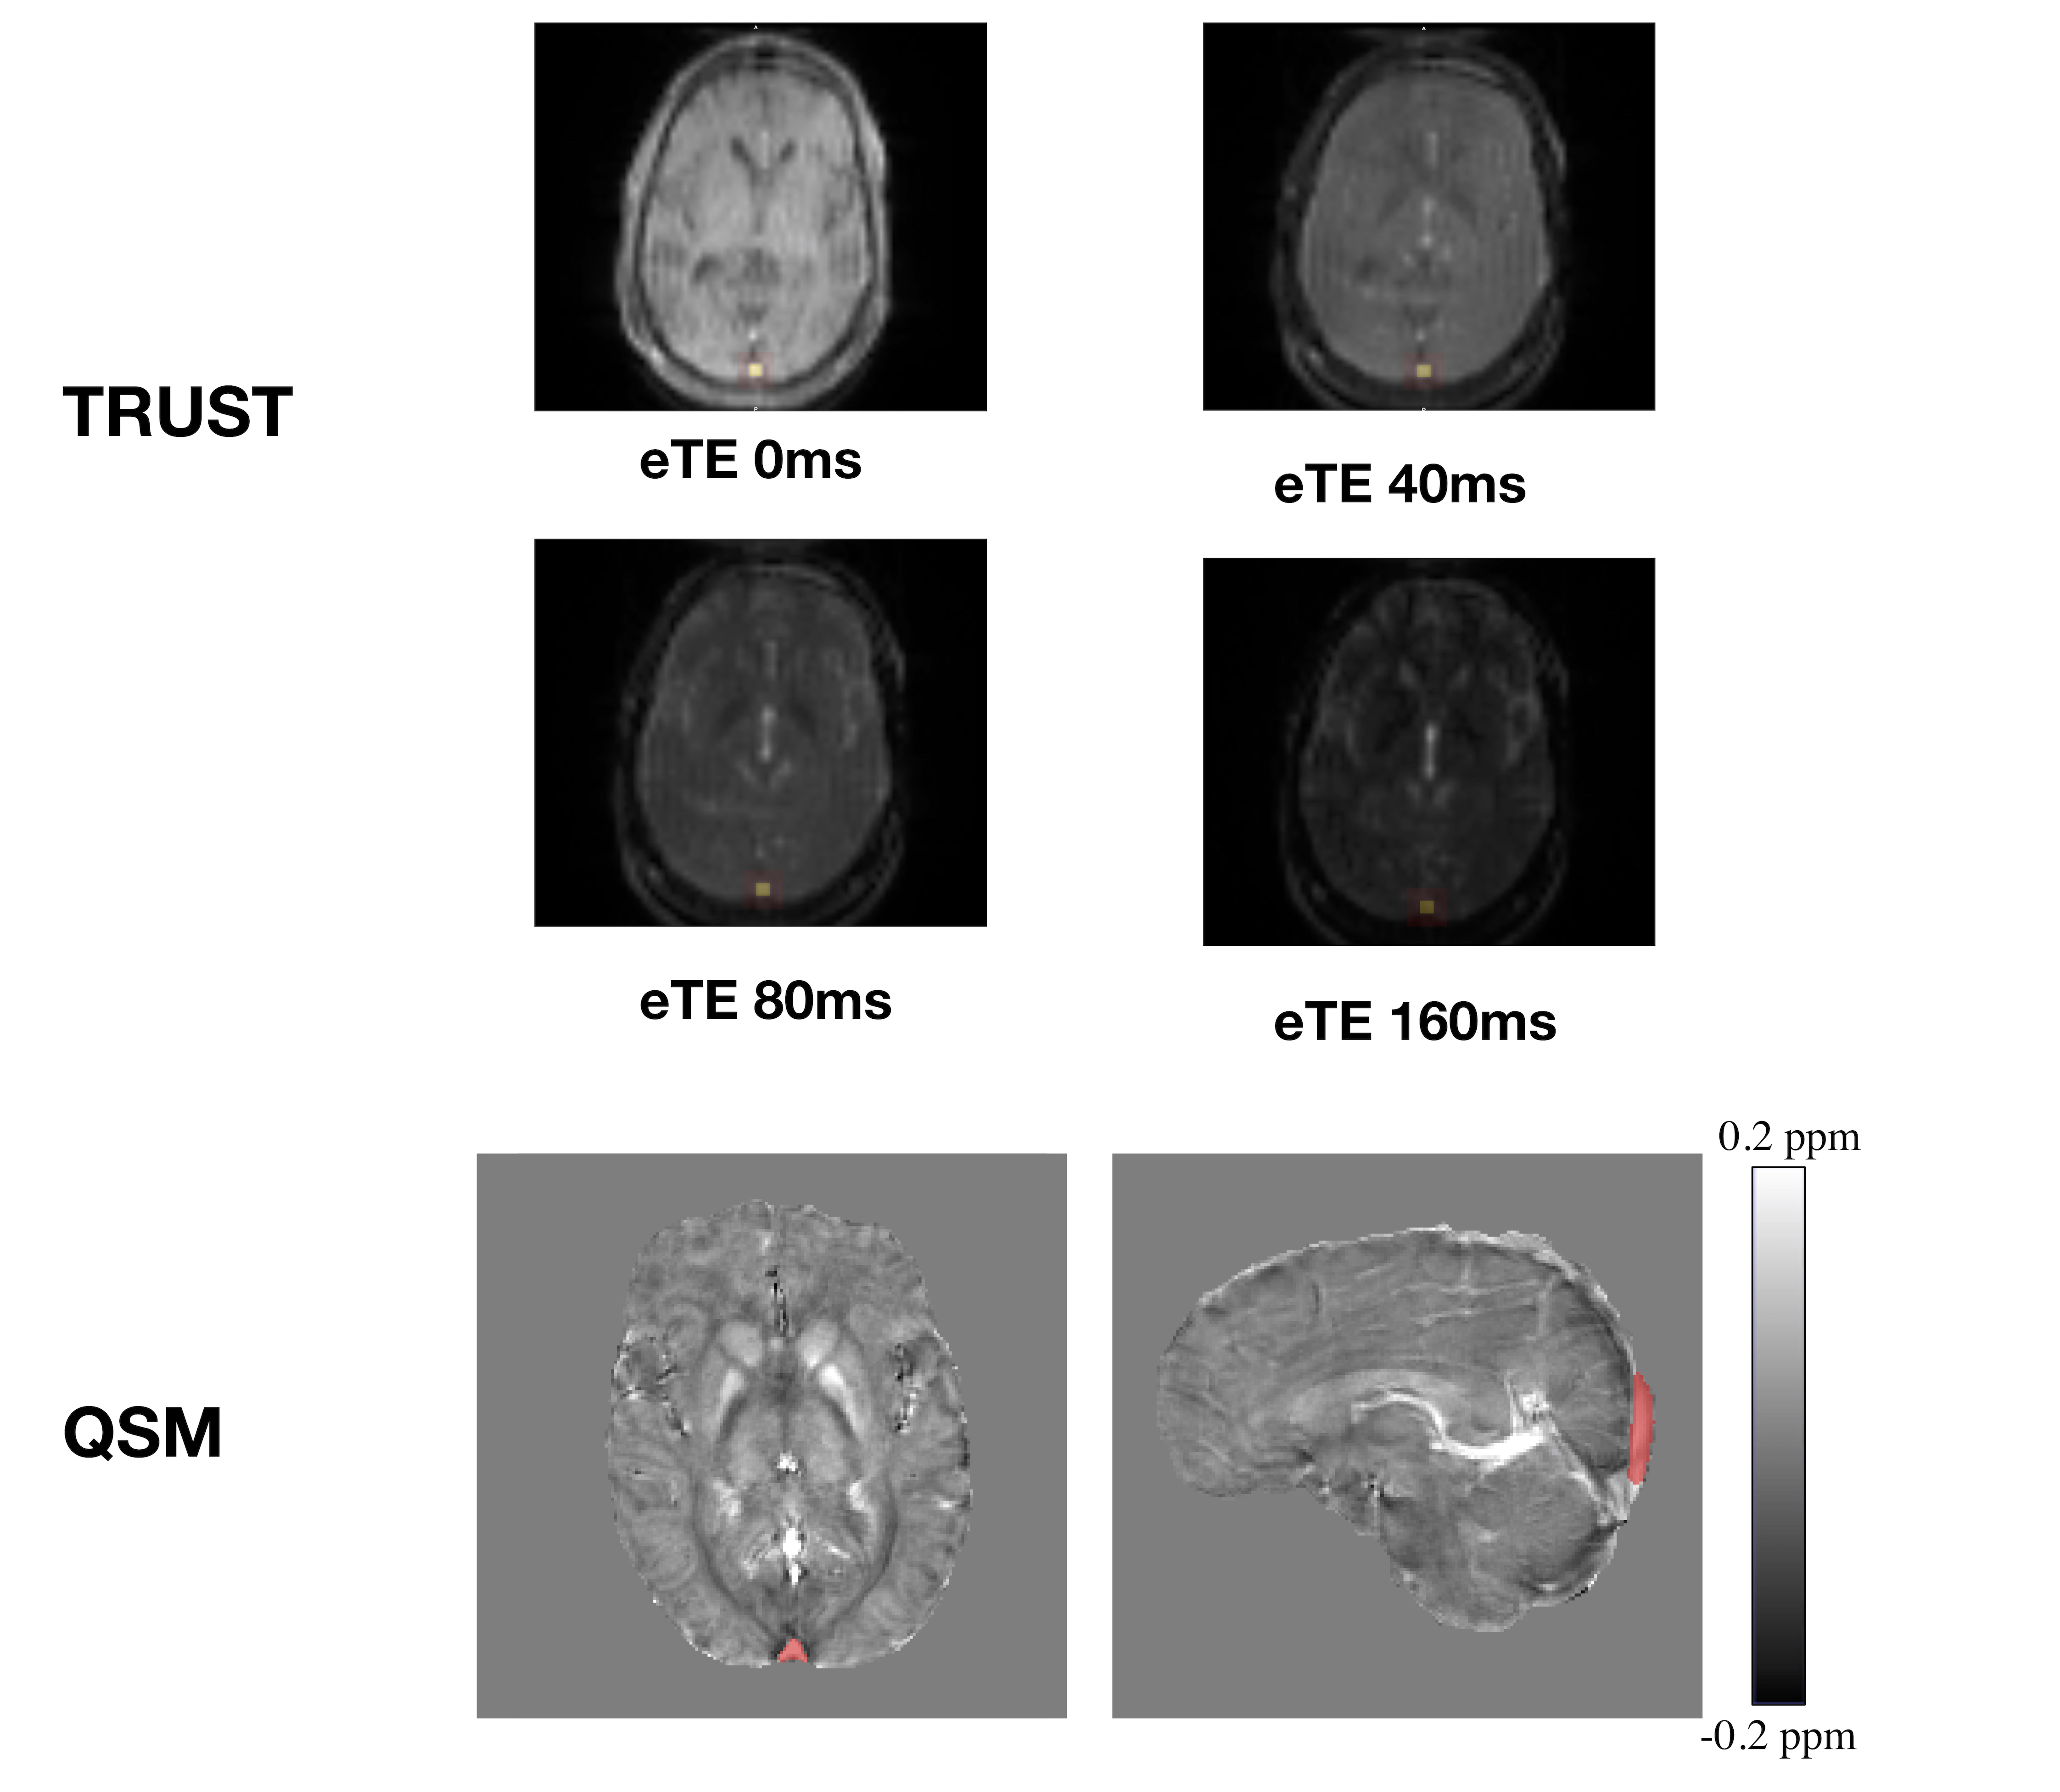
As described previously12, to isolate signal from the superior sagittal sinus (SSS), labelled TRUST images were subtracted from unlabelled images, providing difference images for each of the eTEs. A region of interest (ROI) was then manually drawn around the SSS, within which the four voxels with the highest signal intensities were selected (Fig. 2). The average intensity for each eTE was then used to fit blood T2 over eTE, with blood T1 estimated from hematocrit and SpO213. Calibration models based on HbBV4, HbS2, and HbA5 blood were then used to convert T2 to Yv.
QSM were calculated from the three MPM sequences via the following pipeline: B0 field maps were obtained from a nonlinear fit of the complex images14 and underwent phase unwrapping with SEGUE15 and background field removal using Projection onto Dipole Fields16. Field-to-χ inversion was performed using Tikhonov regularization17 with regularization parameter λ=0.06, selected using L-Curve methods. Brain masks were calculated from the final-echo PD-w magnitude image using FSL BET18. χ maps from the three MPM sequences were then averaged. A single ROI was segmented from the SSS using a semi-automated approach in ITK-SNAP19, based on thresholding the average χ map. The average χ within the ROI was then substituted into equation 1 to estimate Yv (Fig. 2).
Results
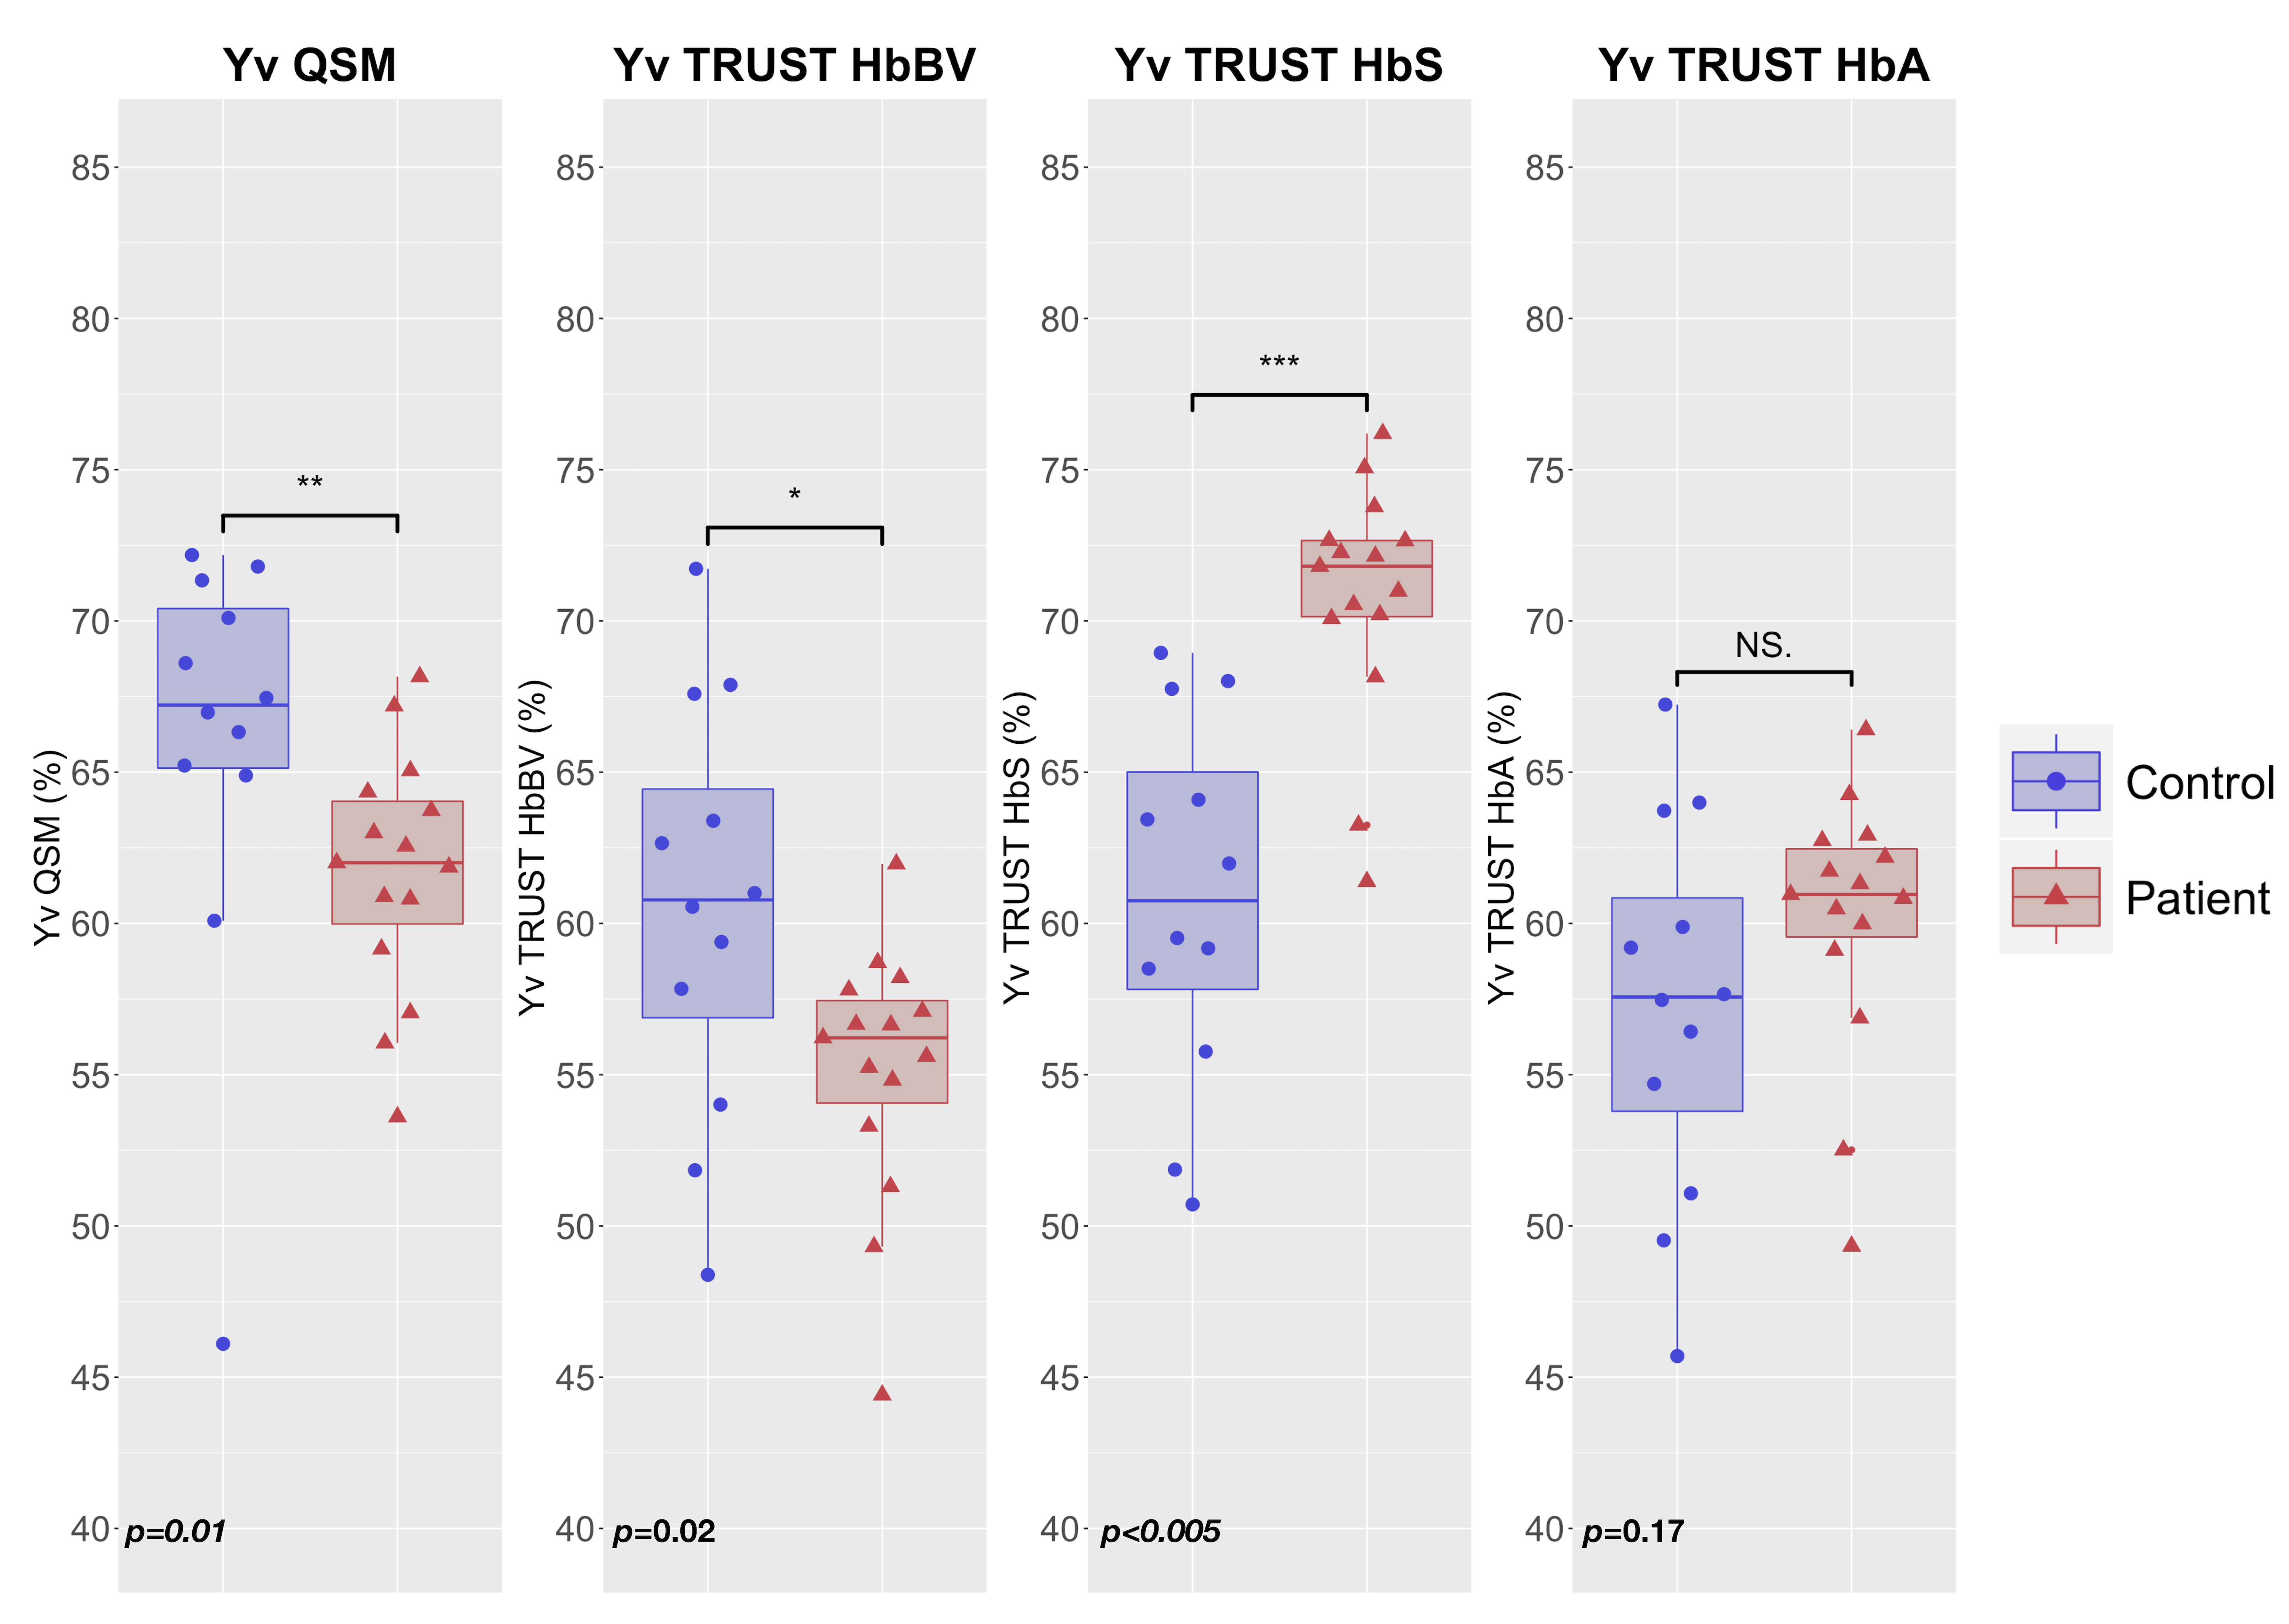
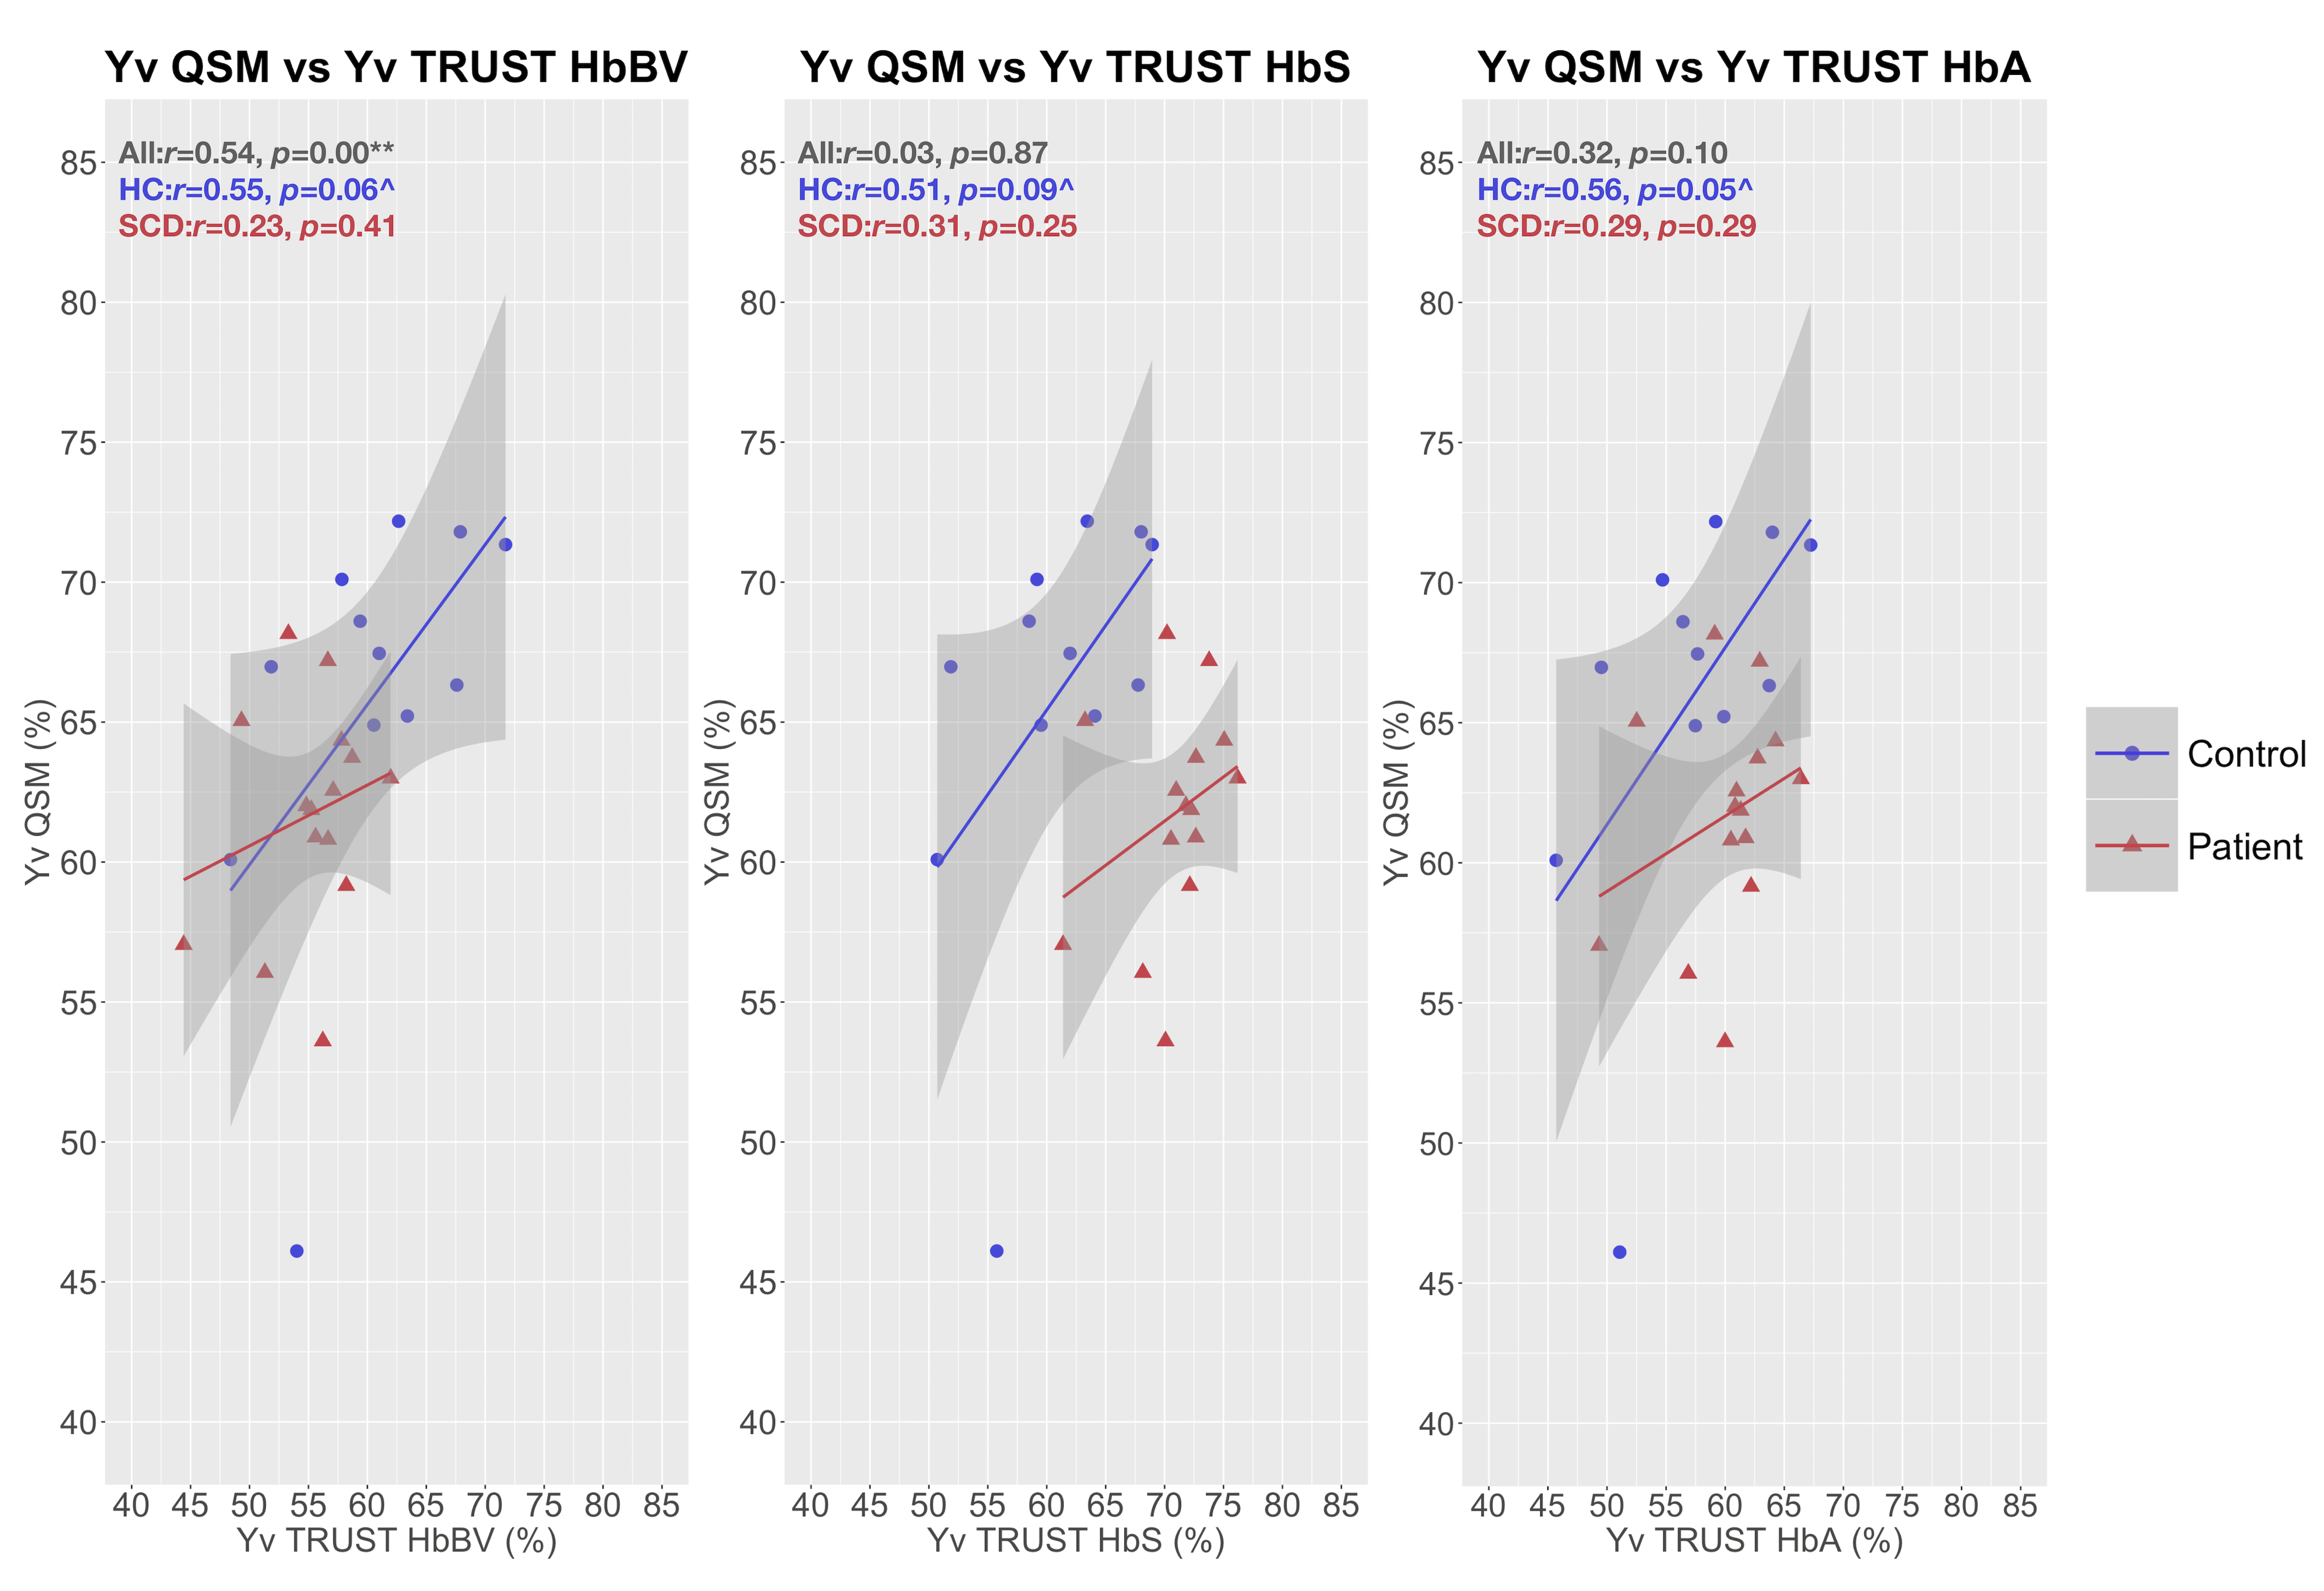
Whereas QSM and TRUST-HbBV estimates of Yv were significantly lower in SCD compared to HC, TRUST-HbS estimates were significantly higher (Fig. 3). There were no significant between-group differences in TRUST-HbA estimates.QSM and TRUST methods were moderately correlated in HC, but not in SCD (Fig. 4). Although no proportional bias between methods was observed, agreement varied, with QSM-Yv estimates on average 5-6% higher in both HC and SCD compared to TRUST-HbBV, 5% higher in HC and 9% lower in SCD compared to TRUST-HbS, and 9% higher in HC and 2% lower in SCD compared to TRUST-HbA (Fig. 5).
Discussion
The directions of the estimated mean difference in Yv between SCD and HC for different TRUST calibration models were similar to those described in prior literature1,2,8,20. In this regard, QSM-based estimates were most closely aligned with TRUST estimates with HbBV calibration. Strengthening the argument for their potential validity in SCD, the QSM and TRUST-HbBV results were also in line with those from prior MRI21 and PET studies22.Aside from one outlier, the range for Yv in HC was narrower using QSM. Moreover, QSM- and TRUST- based estimates of Yv were only moderately correlated in HC. The small sample size, along with our reliance on literature averages for hematocrit may, in part, account for the poor concordance observed in patients. At the individual level, agreement between methods varied substantially, with wide limits of agreement (18-26%) observed in both SCD and HC.
Conclusion
These findings indicate variable agreement between QSM and TRUST estimates of Yv in SCD and HC, underscoring the need for work comparing non-invasive MRI methods with gold-standard jugular vein catheterization.Acknowledgements
The work was supported by a UCL Grand Challenges Doctoral Students Grant. We would like to thank Nikolaus Weiskopf and Antoine Lutti who provided the MPM sequences, and Hanzhang Lu and Dengrong Jiang who provided the TRUST sequence used in this study. We would also like to thank Sati Sahota for helping with patient recruitment, and the participants and their families, without whom this study would not have been possible.References
1. Jordan LC, Gindville MC, Scott AO, et al. Non-invasive imaging of oxygen extraction fraction in adults with sickle cell anaemia. Brain 2016; 139(3):738–50.
2. Bush AM, Coates TD, Wood JC. Diminished cerebral oxygen extraction and metabolic rate in sickle cell disease using T2 relaxation under spin tagging MRI. Magn Reson Med 2018; 80(1):294–303.
3. Stotesbury H, Kawadler JM, Saunders DE, Hales PW, Clark CA, Kirkham FJ. Vascular instability and neurological morbidity in sickle cell disease; an integrative framework. Front Neurol 2019; 10:871.
4. Lu H, Xu F, Grgac K, Liu P, Qin Q, van Zijl P. Calibration and validation of TRUST MRI for the estimation of cerebral blood oxygenation. Magn Reson Med 2012; 67(1):42–49.
5. Bush A, Borzage M, Detterich J, et al. Empirical model of human blood transverse relaxation at 3 T improves MRI T2 oximetry. Magn Reson Med 2017; 77(6):2364–2371.
6. Shmueli K, de Zwart JA, van Gelderen P, Li T-Q, Dodd SJ, Duyn JH. Magnetic susceptibility mapping of brain tissue in vivo using MRI phase data. Magn Reson Med 2009; 62(6):1510–1522.
7. Weisskoff RM, Kiihne S. MRI susceptometry. Image-based measurement of absolute susceptibility of MR contrast agents and human blood. Magn Reson Med 1992; 24(2):375–383.
8. Guilliams KP, Fields ME, Ragan DK, et al. Red cell exchange transfusions lower cerebral blood flow and oxygen extraction fraction in pediatric sickle cell anemia. Blood 2018; 131(9):1012–21.
9. Kratz A, Ferraro M, Sluss PM, Lewandrowski KB. Normal Reference Laboratory Values. N Engl J Med 2004; 351(15):1548–1563.
10. Stewart West M, Wethers D, Smith J, Steinberg M. The Cooperative Study of Sickle Cell Disease. Laboratory profile of sickle cell disease: A cross-sectional analysis. J Clin Epidemiol 1992; 45(8):893–909.
11. Weiskopf N, Suckling J, Williams G, et al. Quantitative multi-parameter mapping of R1, PD(*), MT, and R2(*) at 3T: a multi-center validation. Front Neurosci 2013; 7:95.
12. Jiang D, Liu P, Li Y, Mao D, Xu C, Lu H. Cross-vendor harmonization of T 2 -relaxation-under-spin-tagging (TRUST) MRI for the assessment of cerebral venous oxygenation. Magn Reson Med 2018; 80(3):1125–1131.
13. Hales PW, Kirkham FJ, Clark CA. A general model to calculate the spin-lattice (T1) relaxation time of blood, accounting for haematocrit, oxygen saturation and magnetic field strength. J Cereb Blood Flow Metab 2016; 36(2):370–4.
14. Liu T, Wisnieff C, Lou M, Chen W, Spincemaille P, Wang Y. Nonlinear formulation of the magnetic field to source relationship for robust quantitative susceptibility mapping. Magn Reson Med 2013; 69(2):467–476.
15. Karsa A, Shmueli K. SEGUE: A Speedy rEgion-Growing Algorithm for Unwrapping Estimated Phase. IEEE Trans Med Imaging 2019; 38(6):1347–1357.
16. Liu T, Khalidov I, de Rochefort L, et al. A novel background field removal method for MRI using projection onto dipole fields (PDF). NMR Biomed 2011; 24(9):1129–1136.
17. Kressler B, de Rochefort L, Tian Liu, Spincemaille P, Quan Jiang, Yi Wang. Nonlinear Regularization for Per Voxel Estimation of Magnetic Susceptibility Distributions From MRI Field Maps. IEEE Trans Med Imaging 2010; 29(2):273–281.
18. Smith SM. Fast robust automated brain extraction. Hum Brain Mapp 2002; 17(3):143–155.
19. Yushkevich PA, Piven J, Hazlett HC, et al. User-guided 3D active contour segmentation of anatomical structures: Significantly improved efficiency and reliability. Neuroimage 2006; 31(3):1116–1128.
20. Vaclavu L, Petersen ET, VanBavel ET, Majoie CB, Nederveen AJ, Biemond BJ. Reduced Cerebral Metabolic Rate of Oxygen in Adults with Sickle Cell Disease. Blood 2018; 132(Suppl 1):11–11.
21. Murdoch R, Stotesbury H, Kawadler J, Kirkham F, Shmueli K. MRI Susceptibility Mapping Shows Decreased Venous Oxygen Saturation in Sickle Cell Anaemia. In Proc ISMRM; 2019:4027.
22. Herold S, Brozovic M, Gibbs J, et al. Measurement of regional cerebral blood flow, blood volume and oxygen metabolism in patients with sickle cell disease using positron emission tomography. Stroke 1986; 17(4):692–8.
Figures