1628
Compressed SENSE Accelerated CE-MRA: Comparison of Image Quality and Vessel Detectability with standard SENSE imaging.
Maarten J. Versluis1, Yi Wang2, Karthik Gopalakrishnan3, Burkhard Maedler4, Charles Truwit5, Velmurugan Gnanaprakasam1, Johan van den Brink1, and Liesbeth Geerts1
1BIU MR, Philips Healthcare, Best, Netherlands, 2Clinical Science, Philips Healthcare, Seattle, WA, United States, 3BIU MR, Philips Healthcare, Bangalore, India, 4Clinical Science, Philips Healthcare, Hamburg, Germany, 5Diagnostic Imaging, Philips Healthcare, Cambridge, MA, United States
1BIU MR, Philips Healthcare, Best, Netherlands, 2Clinical Science, Philips Healthcare, Seattle, WA, United States, 3BIU MR, Philips Healthcare, Bangalore, India, 4Clinical Science, Philips Healthcare, Hamburg, Germany, 5Diagnostic Imaging, Philips Healthcare, Cambridge, MA, United States
Synopsis
In this study we compared the image quality of CE-MRA scans using Compressed SENSE and SENSE reconstruction in three subjects. A visual comparison between the number of intracranial vessels showed no differences for both reconstruction techniques. Structural Similarity Index (SSIM) and Mean squared error (MSE) metrics were used to compare retrospectively undersampled CS-SENSE and SENSE acquisitions at a number of reduction factors with the fully sampled dataset. It was found that CS-SENSE reconstructed scans show a higher similarity to the fully sampled acquisitions than using conventional SENSE parallel imaging allowing a 50% increase in acceleration compared to SENSE.
Introduction
Contrast Enhanced (CE)-MRA is routinely used to assess the vascular morphology and is sensitive to the concentration of contrast agent in the vessels to produce high intravascular signal. Correct timing of the CE-MRA scan is essential to start acquisition at maximum bolus contrast agent concentration, which is commonly performed by a fast Bolustrak acquisition preceding the CE-MRA scan, by ensuring the k-space filling order is optimized using e.g. CENTRA scheme and scan time is as short as possible. In order to minimize scan time, parallel imaging, e.g. SENSE is typically employed. Recently CS-SENSE based on compressed sensing(1), became clinically available(2–5), which has the potential to accelerate beyond parallel imaging alone. In this study we will assess whether the application of CS-SENSE affects the appearance and content of the images by visually scoring the appearance of vessels and quantitatively comparing Structural Similarity Index (SSIM) and Mean squared error (MSE) metrics.Methods
After obtaining informed consent, fully-sample 3D T1-weighted FFE images with CENTRA (center-out) k-space ordering were acquired in three subjects at a 3T Philips Ingenia scanner with the following scan parameters: 0.6x0.8x0.9mm voxel size, FOV = 250mmx240mmx180mm (FH,AP,RL) and 400 slices, for a total scan time of 5m40s (fully sampled data). The k-space filling was based on a Contrast ENhanced Timing Robust Angiography (CENTRA) scheme(6), which captures the true first pass and is well suited for long acquisition times and retrospective subsampling approaches. The data has been retrospectively undersampled and reconstructed using CS-SENSE and SENSE reconstruction techniques at the following reduction factors: 2, 4, 6, 10 and 12. Reduction factors 10 and 12 have been reconstructed for CS-SENSE only. Visual scoring was performed to count the number of visible intracranial vessels (segments MCA M1-M3, ACA A1-A2, PCA) for a clinically relevant acceleration factor (6) for both CS-SENSE and SENSE reconstructions. To allow for a quantitative comparison, SSIM and MSE indices were calculated between the fully sampled source images and the accelerated reconstructions using the Scikit-image toolbox in Python.Results / Discussion
The presence of several intracranial arteries has been visually assessed and reviewed by a radiologist on both the SENSE 6x and CS-SENSE 6x accelerated acquisitions. The full list of arteries and segments can be found in Table 1. No difference was found in detectable vessels between the SENSE and CS-SENSE reconstructions based on visual scoring. Visually there was equivalence for the reported vessels for both reconstructions. Figure 1 shows a visual comparison between SENSE and CS-SENSE reconstructed MIP for an acceleration factor of 6. Measures of SSIM and MSE are shown in figure 2 for the three subjects individually. Compressed SENSE retained higher to equal SSIM indices compared to SENSE reconstructions. The SSIM values for very high CS-SENSE acceleration factors (10 and 12) show a gradual decrease in similarity, which is consistent with the experience obtained in non-contrast enhanced CS-SENSE, where the image quality gradually decreases with higher CS-SENSE acceleration factors. For a routinely used SENSE parallel imaging factor of 4 this implies that based on the SSIM metrics a CS-SENSE factor of 6.3 +/- 2 can be applied, resulting in an acceleration of more than 50% compared to SENSE.Overall MSE values of CS-SENSE images were lower than that of SENSE scans at the same acceleration factor. Further, MSE values increase approximately linearly for CS-SENSE reconstruction, whereas for SENSE reconstructions the MSE behaves non-linear and shows a more pronounced increase at SENSE factors 4 and 6.
Conclusion
Based on this retrospective undersampling investigation, it has been shown that Compressed SENSE undersampling and reconstruction can be used to accelerate CE-MRA acquisitions without losing vessel detail, with at least equal similarity metrics compared to SENSE accelerated acquisitions. CS-SENSE has the potential to accelerate beyond using regular SENSE undersampling with more than 50%.Acknowledgements
No acknowledgement found.References
1. Lustig M, Med. 2007;58:1182–1195 doi: 10.1002/mrm.21391. 2. Vranic JE, Am. J. Neuroradiol. 2019;40:92–98 doi: 10.3174/ajnr.A5905. 3. Lohöfer FK, Eur. J. Radiol. 2019;115:53–58 doi: 10.1016/j.ejrad.2019.04.002. 4. Mönch S, Clin. Neuroradiol. 2019:1–8 doi: 10.1007/s00062-019-00789-x. 5. Eichinger P, Invest. Radiol. 2019;54:319–324 doi: 10.1097/RLI.0000000000000550. 6. Cirillo M, Eur. J. Radiol. 2013;82:e853-859 doi: 10.1016/j.ejrad.2013.08.052.Figures
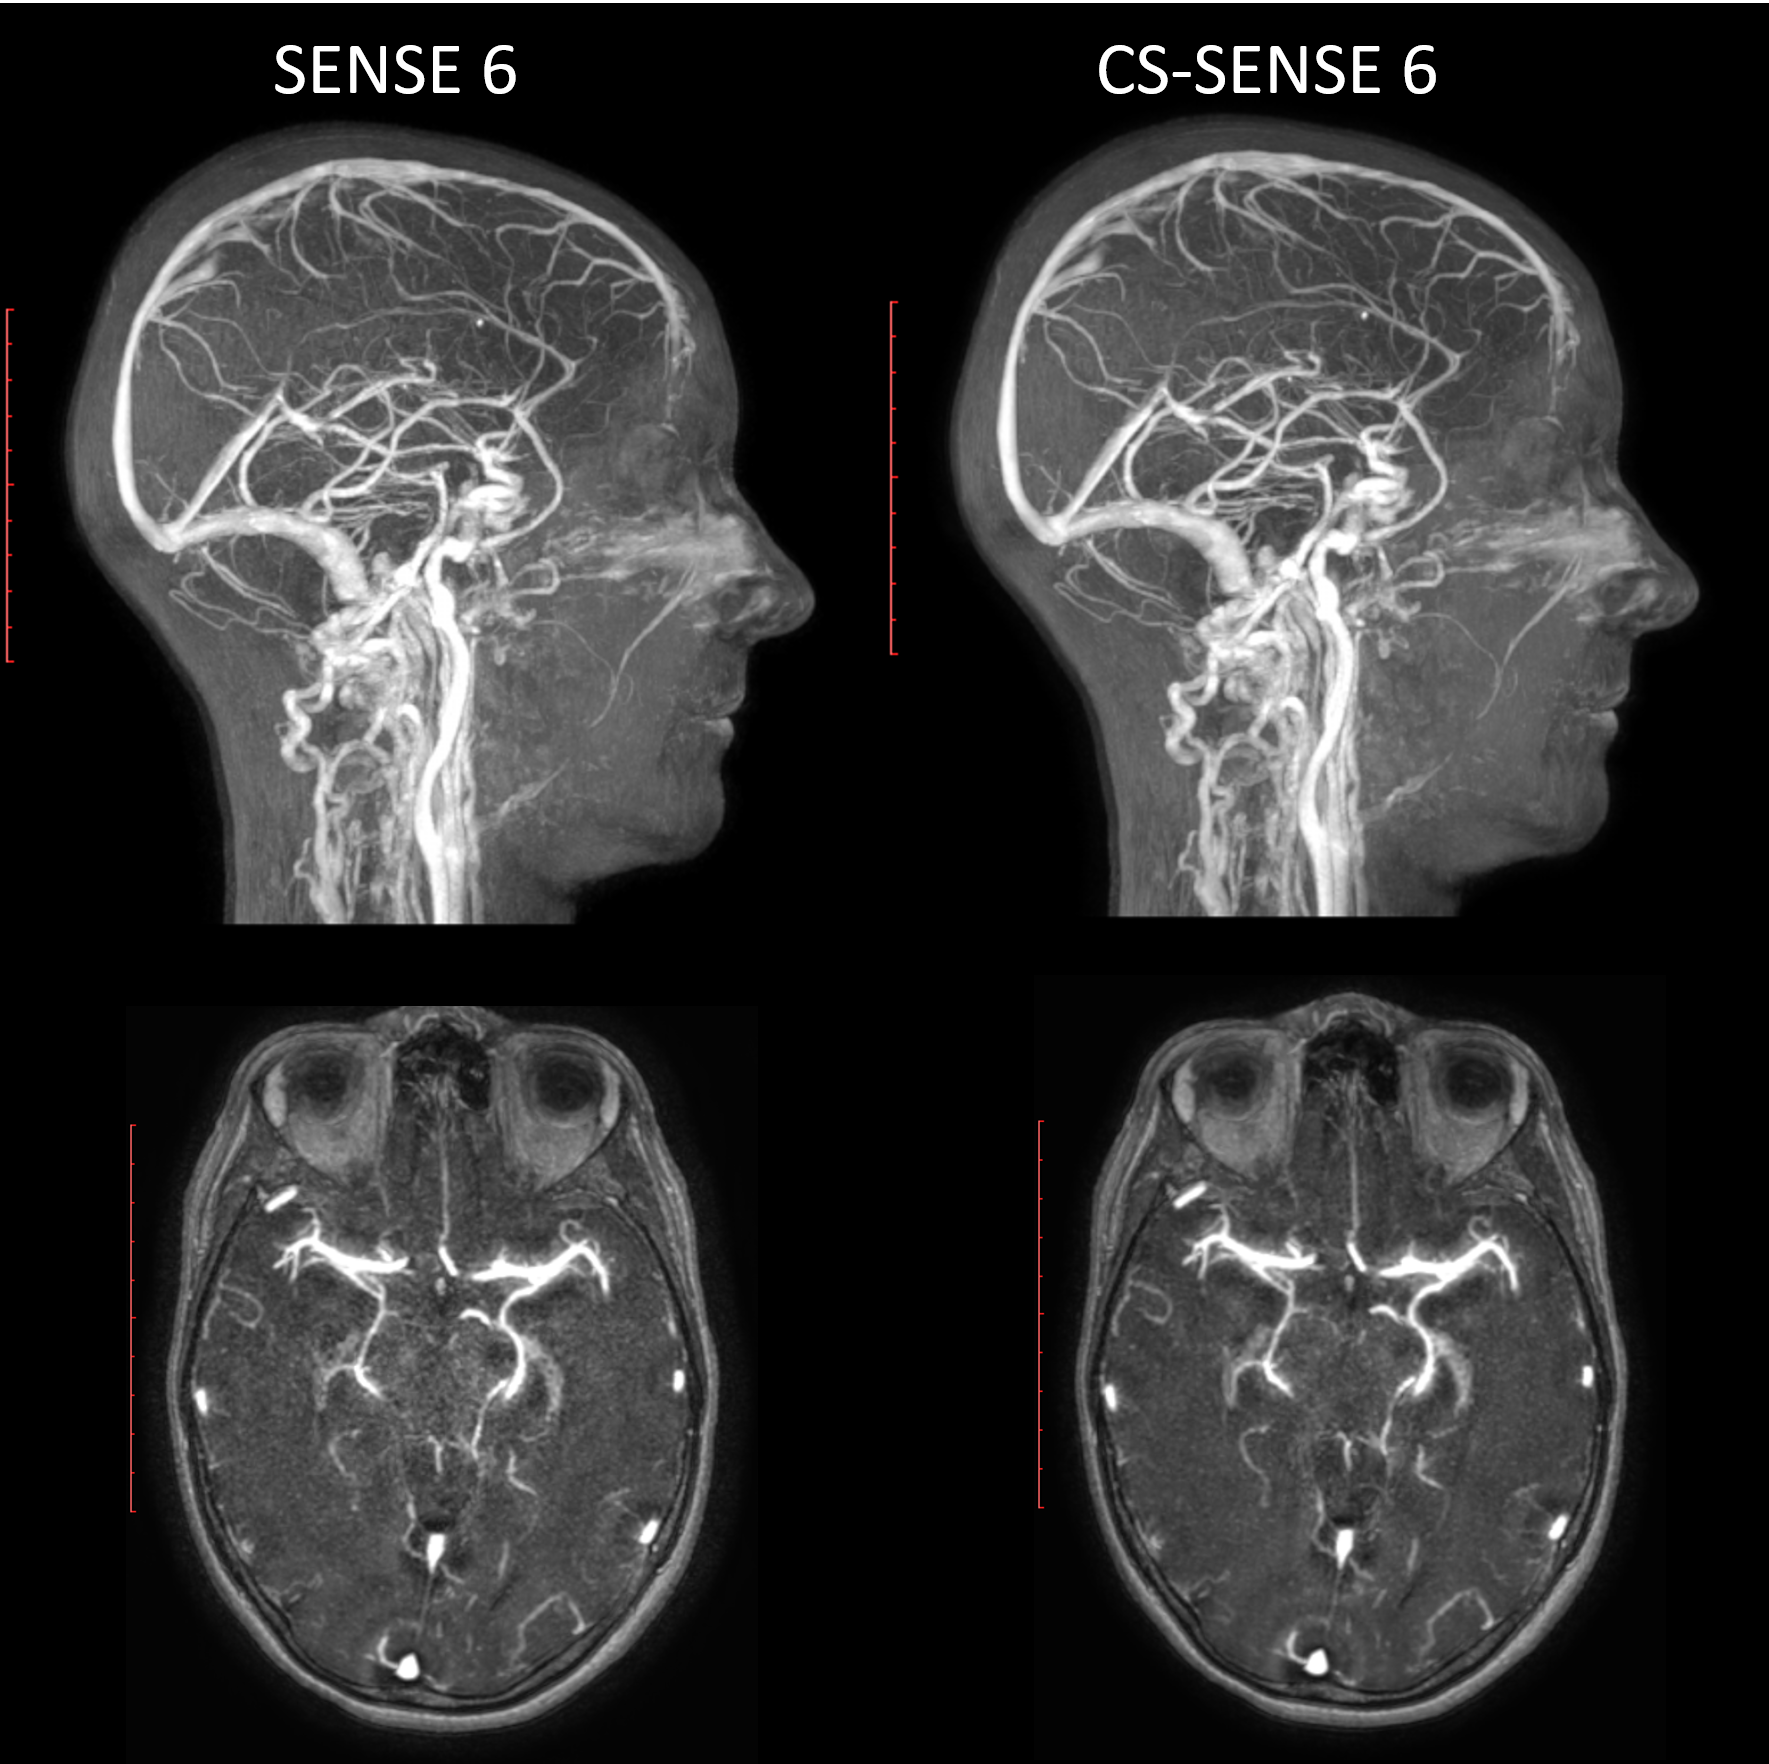
Figure 1: Maximum
Intensity Projections, reconstructed using a SENSE 6 (left) and CS-SENSE 6
(right) undersampling factor. There is a high similarity between the images.
The SENSE reconstructed image shows slightly more noise in the center of the brain, as is
expected.
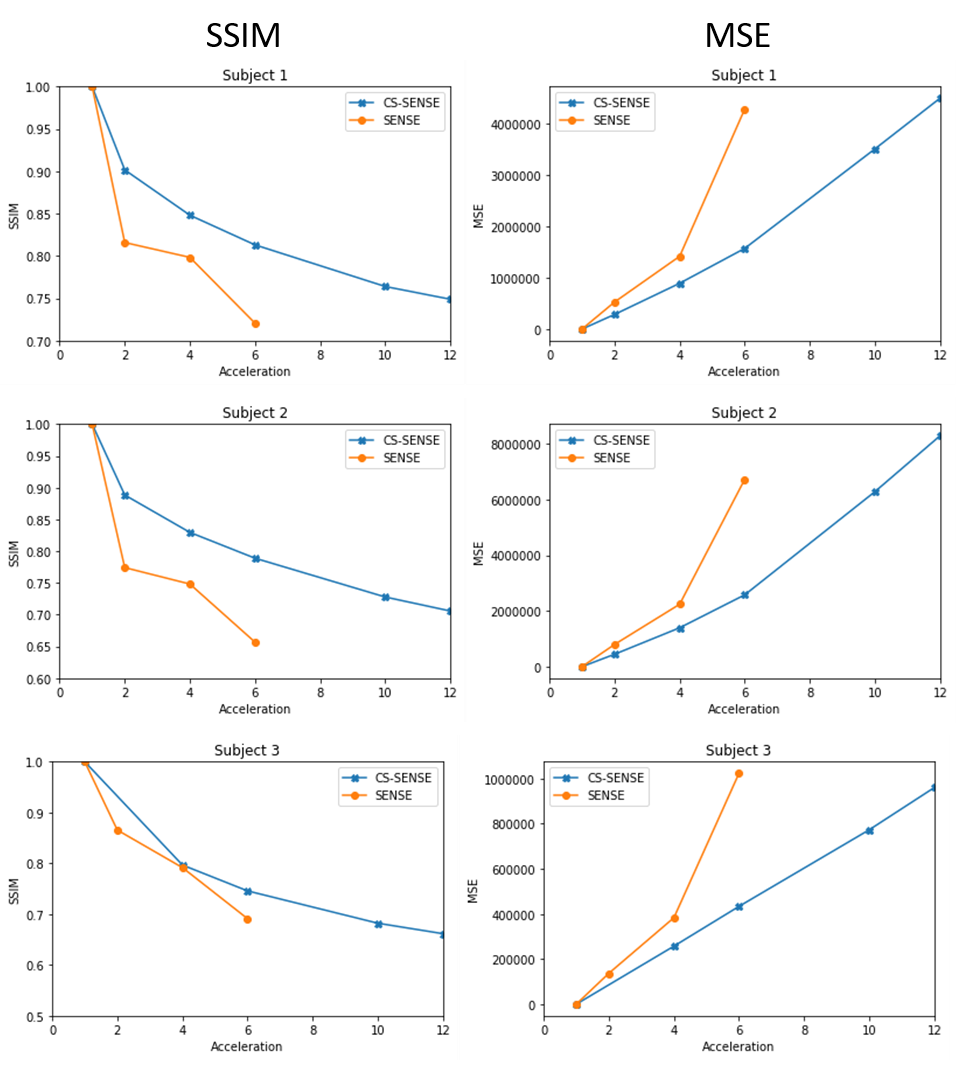
Figure 2: Structural similarity (SSIM, left) and mean squared error
(MSE, right) indices were calculated for the three subjects for the different
acceleration factors. Lower SSIM values represent less similarity between the accelerated reconstruction and the fully sampled source image. Higher MSE values represent larger differences in signal intensity between the accelerated and fully sampled source images.
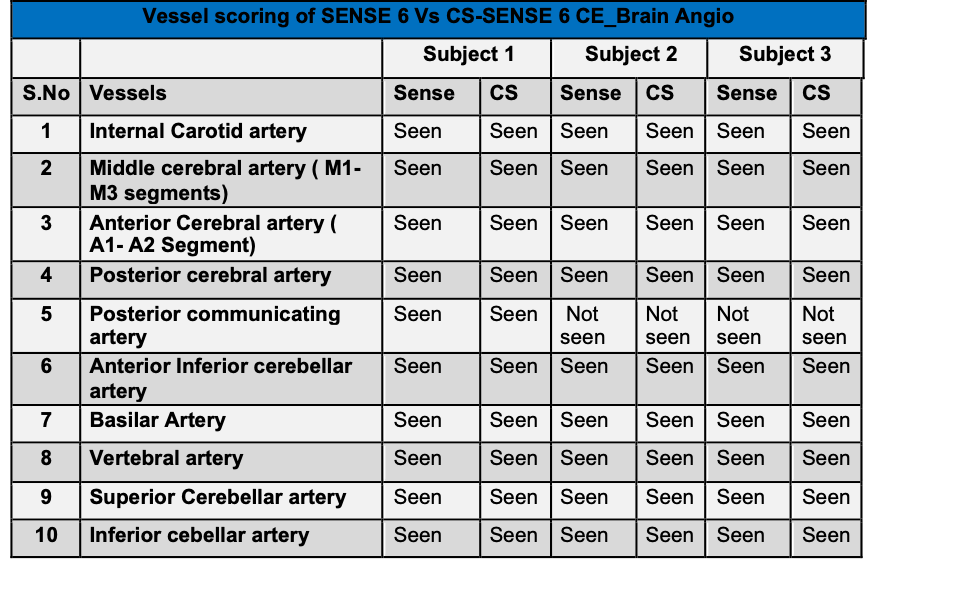
Table 1: List of
scored vessel for the three patients for the
SENSE and CS-SENSE 6 accelerated scans. No difference in scored vessels between CS-SENSE and
SENSE was observed.