1627
Cerebrovascular Atlas: A Novel Framework to Detect Structural Alterations Using MRA1Institute of Science and Technology for Brain-Inspired Intelligence, Fudan University, Shanghai, China, 2Human Phenome Institute, Fudan University, Shanghai, China, 3MR Collaboration, Siemens Healthcare Ltd., Shanghai, China
Synopsis
Cerebral vascular alterations are leading risk of several brain diseases. To detect the structural alterations, we proposed the novel framework to automatically generate the cerebrovascular probability atlas and corresponding radius and tortuosity atlas using multistage segmentation and concatenated registration method. 198 hypertension patients and 149 health participants scanned with TOF MRA and T1 sequences were included in our study. The tortuosity in middle cerebral artery and posterior cerebral artery are obviously higher in hypertension group, which may reveal the intrinsic mechanism of cerebrovascular structural changes in hypertension.
Introduction
Cerebral vascular alterations are leading risk of cognitive impairment, strokes, dementia, ischemic cerebral injury and other brain lesions1,2. With the help of magnetic resonance angiography (MRA), artery features such as vascular radius and tortuosity can be quantified which contributes to figure out details of vascular structural changes. This will further enable lesion detection and early clinical intervention prior to the severe complications and expect to mitigate vascular-initiated end-organ damage3.In current study, we proposed the framework to automatically generate the cerebrovascular probability atlas and corresponding radius and tortuosity atlas in both hypertension and non-hypertension groups which targeted vascular changes caused by hypertension. The atlas allows to visualize the distribution of cerebral vessels in feature space, benefits to analyses the structural changes, and may help to predict cerebral adverse events.
Methods
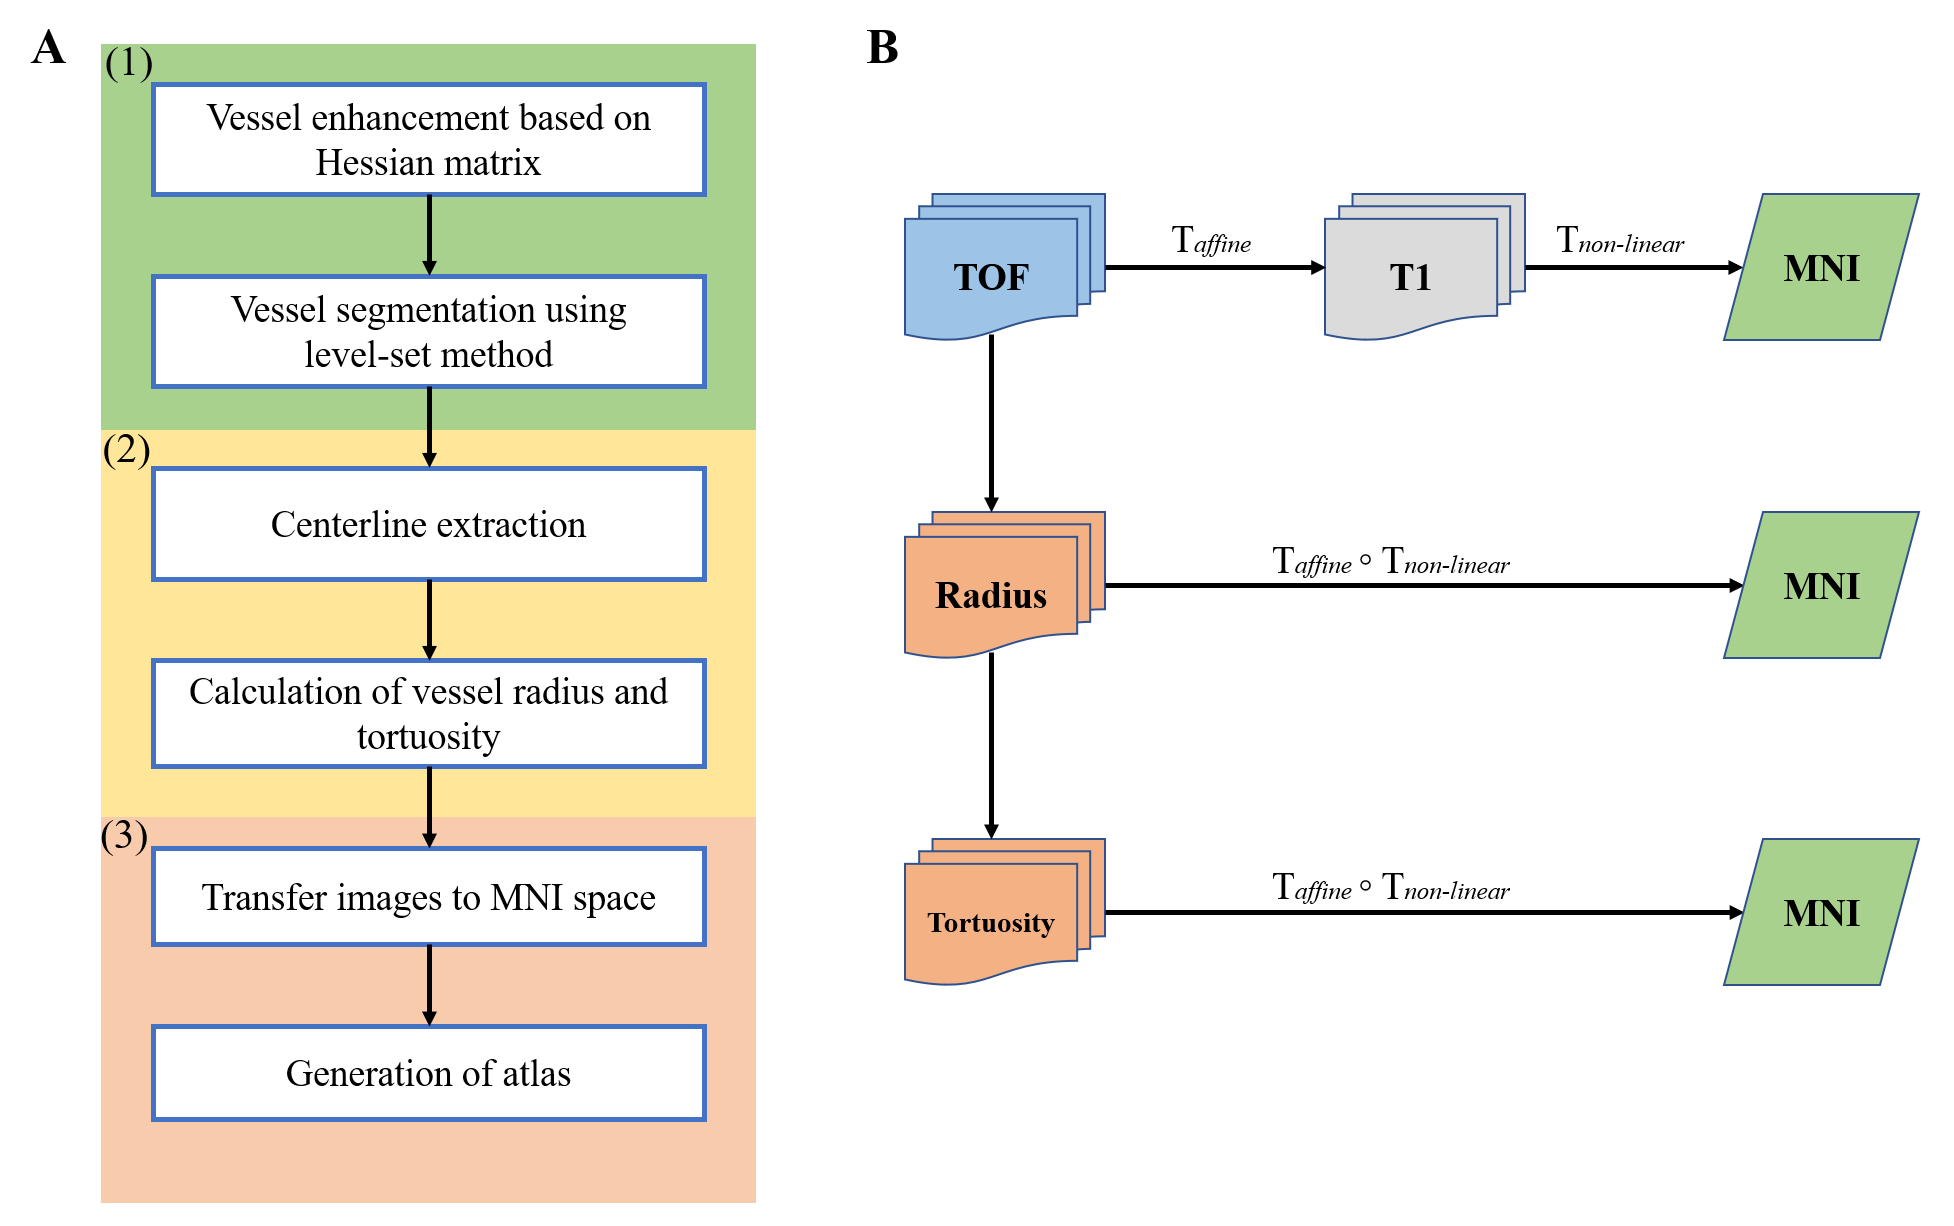
This study was approved by the local ethics committee and informed consent was obtained for all participants prior to enrollment. 198 hypertension patients and 149 health participants were scanned with time-of-flight (TOF) MRA sequence (TE = 3.6ms, TR = 2000ms, slice thickness = 0.6mm, matrix size = 512×512, field of view = 220mm×220mm) and T1-weighted imaging (TE = 7.6ms, TR = 200ms, slice thickness = 1.5mm, matrix size = 240×240, field of view = 200mm×200mm) on the 3T MAGNETOM Skyra, Siemens Healthcare, Erlangen, Germany.The flow chart of the proposed framework is shown in Figure1A, mainly consisted of three parts. (1) Segmentation of vessels. Segmentation of cerebral vessels has several challenges including the intrinsic limitation of TOF sequence, the complex nature of the vasculature, noise and so on. In order to precisely segment the vessels, firstly, vessel enhancement based on the Hessian matrix was performed to enhance the vascular structure. The enhancement results were then served as the initial contour of the level-set method4. The segmentation was finally organized by connectivity filtering. (2) Calculation of features. After the processing of segmentation, the centerline extraction was performed, in which the complex vascular structures were simplified and essential anatomic information were reserved. Based on the centerline, the vessel radius and tortuosity were quantified automatically. (3) Generation of atlas. For each individual, TOF images were registered to the T1-weighted images using an affine transformation and the T1-weighted images were registered to the MNI brain atlas with voxel size = 0.5mm×0.5mm×0.5mm by the non-linear transformation. Then, two transformations were concatenated to transform the TOF images and corresponding feature images into the reference space. Finally, the cerebrovascular probability atlas was obtained using the registered segmentations by averaging all of the participates. The feature atlas (radius and tortuosity) was generated using the registered feature map by averaging the non-zero values in the feature map. Figure1B is the sketch diagram of the generation process.
Results and Discussion
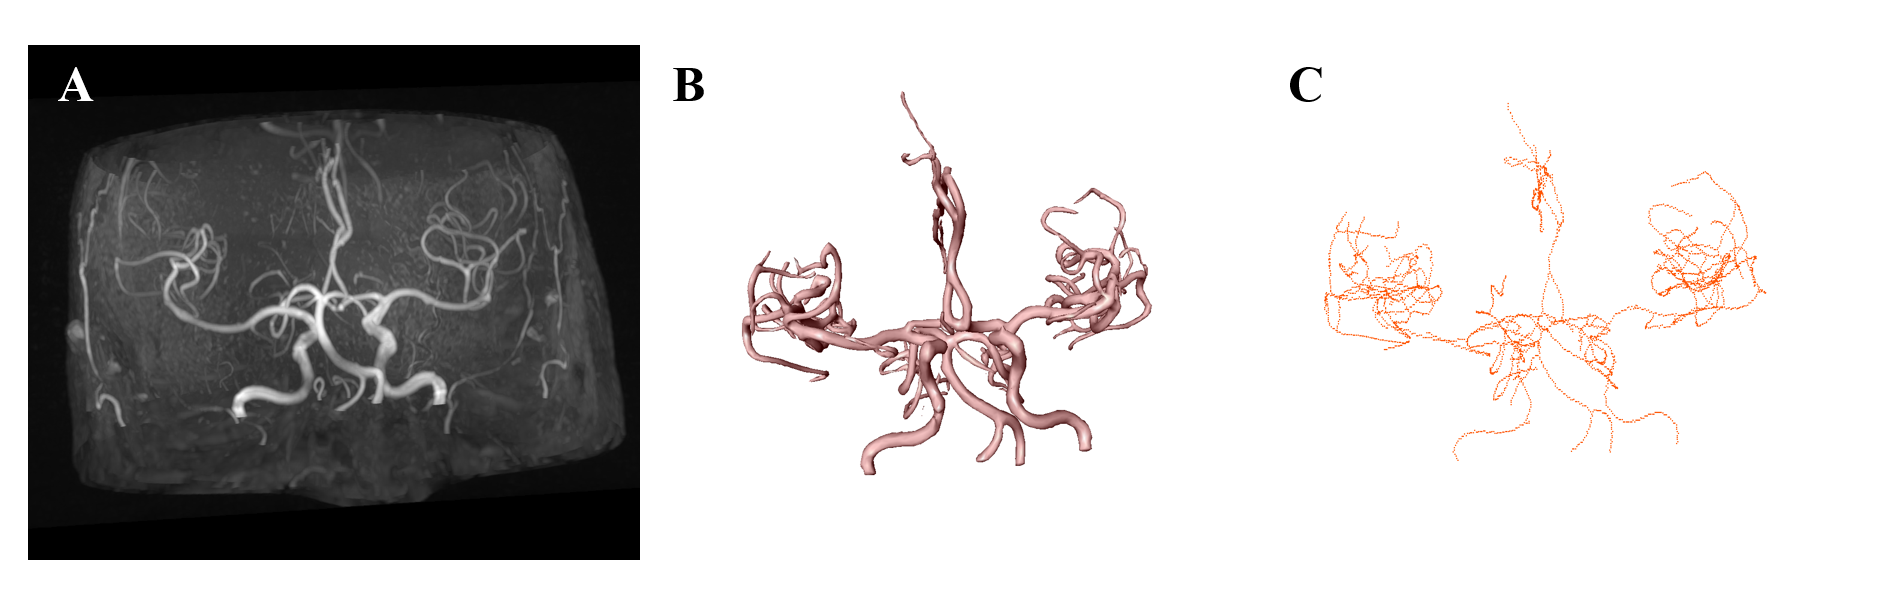
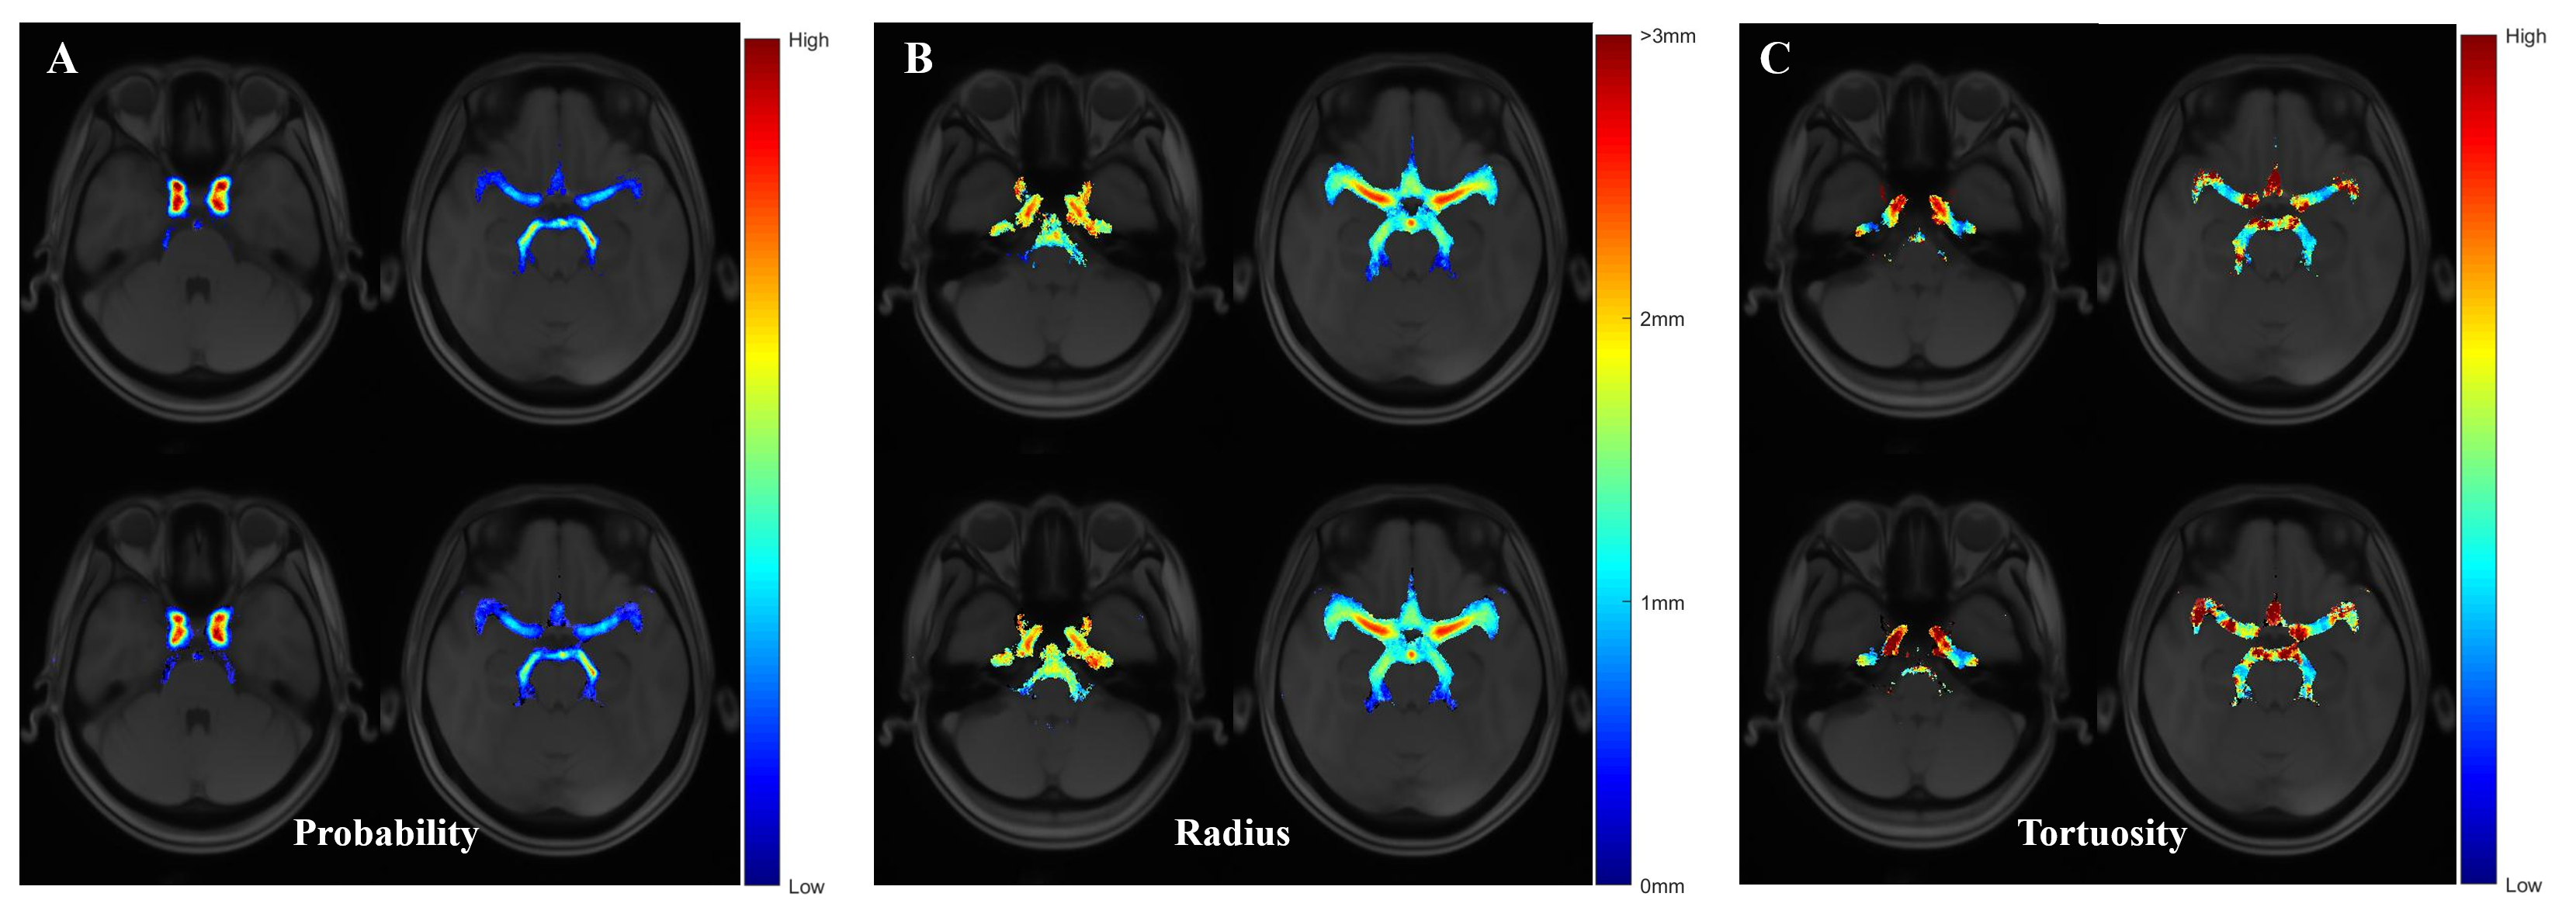
Segmentation is an essential step in this study. Due to the automatic multistage segmentation framework, the main vascular structure was reserved as shown in Figure2. In order to generate the atlas, the TOF images must be represented in a common reference space, considering the different scanners varied patient positions and resulted in non-aligned images. Consequently, we concatenated the affine and non-linear transformation to complete the registration and all the generated atlases were in the MNI space.The cerebrovascular probability atlas represents occurrence probabilities in corresponding voxels for the target vessels. The radius atlas and tortuosity atlas show mean value or empirical value at corresponding voxels in the whole brain, which help to intuitively evaluate its discrepancy between the health and hypertension. Comparing atlases of two groups, there are no obvious distinction in probability distribution and radius atlases, but visually difference in tortuosity atlas. The tortuosity at middle cerebral artery (MCA) and posterior cerebral artery (PCA) are higher in hypertension group significantly in Figure3C. This may reveal the intrinsic mechanism of cerebrovascular structural changes in hypertension. Furthermore, this framework can be applied to any vessel related disease.
Conclusion
In conclusion, we proposed the framework to automatically generate the cerebrovascular atlas and corresponding radius and tortuosity atlas. Multistage segmentation and concatenated registration were used to generate the atlas which allows to visualize the distribution of cerebral vessels, analyse the structural changes, and may help to predict cerebral adverse events.Acknowledgements
This work was supported by Shanghai Municipal Science and Technology Major Project (No.2017SHZDZX01), Shanghai Municipal Science and Technology Major Project (No.2018SHZDZX01) and ZJLab, Shanghai Natural Science Foundation (No. 17ZR1401600) and the National Natural Science Foundation of China (No. 81971583).References
1.Barnes JN, Harvey RE, Zuk SM, et al. Aortic hemodynamics and white matter hyperintensities in normotensive postmenopausal women. Journal of Neurology 2017;264(5):938-945.
2.Iadecola C, Davisson RL. Hypertension and cerebrovascular dysfunction. Cell Metabolism 2008;7(6):476-484.
3.Kandil H, Soliman A, Ghazal M, et al. A Novel Framework for Early Detection of Hypertension using Magnetic Resonance Angiography. Scientific Reports 2019;9.
4.Li C, Xu C, Gui C, Fox MD. Distance Regularized Level Set Evolution and Its Application to Image Segmentation. Ieee Transactions on Image Processing 2010;19(12):3243-3254.
Figures