1622
Investigating the Optimal Vasoactive Stimulus to Extract Dynamic Cerebrovascular Reactivity Information: Breath holding versus CO2 Challenge
Eva Elisabeth van Grinsven1, Allen A. Champagne2, Marielle Philippens3, and Alex Bhogal4
1Department of Neurology & Neurosurgery, University Medical Center Utrecht Brain Center, Utrecht, Netherlands, 2Center for Neuroscience studies, School of medicine, Queen’s University, Kingston, ON, Canada, 3Department of Radiotherapy, University Medical Center Utrecht, Utrecht, Netherlands, 4Department of Radiology, University Medical Center Utrecht, Utrecht, Netherlands
1Department of Neurology & Neurosurgery, University Medical Center Utrecht Brain Center, Utrecht, Netherlands, 2Center for Neuroscience studies, School of medicine, Queen’s University, Kingston, ON, Canada, 3Department of Radiotherapy, University Medical Center Utrecht, Utrecht, Netherlands, 4Department of Radiology, University Medical Center Utrecht, Utrecht, Netherlands
Synopsis
This study compared multiple BOLD cerebrovascular reactivity (CVR)-metrics during breath holding (BH) versus a targeted CO2 challenge to determine the degree of similarity in extracting dynamic information about hemodynamic reserves. The preliminary data confirm previous research; CVR-maps were spatially comparable and correlated well between the two stimuli. That said, the data suggests reliable information regarding the flow dynamics is best provided by a controlled CO2 stimulus. Thus, even though BH may be easier to implement, it may also be limited in its ability to provide additional information regarding cerebrovascular health (beyond CVR), which could be of value when investigating patients.
Introduction
Combining Blood Oxygenation Level Dependent (BOLD) MRI with an hypercapnic stimulus is becoming an increasingly popular method to assess cerebrovascular reactivity (CVR). CVR reflects the response of the brain vasculature to vasoactive stimuli and can be utilized as a regional indicator of healthy brain tissue versus tissue affected by vascular impairment.1 One of the simplest hypercapnic stimuli is breath holding (BH). BH does not require additional equipment and can facilitate robust and reproducible CVR measurements with only small intra-subject variation,2,3 making it an appealing technique for routine MR examinations. Nevertheless, with a controlled CO2 challenge, arterial CO2 can be precisely and rapidly increased, providing the opportunity to investigate dynamic CVR effects (i.e. blood flow redistribution and temporal response characteristics). Although previous research has indicated a good correlation between BOLD signal changes during BH and a CO2 challenge,4 differences regarding these dynamic effects have not yet been investigated. Therefore, the aim of this study was to compare multiple BOLD CVR-metrics acquired during BH versus a controlled CO2 challenge.Methods
Two healthy, male volunteers (ages 26 and 28) were scanned on a Philips 3T system using a multi-band GE-EPI sequence during the breathing protocol (Fig. 1) (Scan parameters: TR=1100ms, TE=35ms, flip angle 65°, EPI-factor 53, resolution=2x2x2.5mm3, 112X112X48 slices, 812 dynamics, multi-band factor=3). PetCO2 and PetO2 were recorded during the entire experiment using the RespirAct RA-MRTM MRI UNIT. A 3D T1-TFE sequence (isotropic resolution=1mm, TR=8ms, TE=3.21ms, flip angle=10°, EPI-factor=3, 240x240x180 slices) was acquired for structural assessment. Each individuals’ BOLD data was motion corrected and tissue segmentations were made based on the T1-image (FMRIB: FSL).5 The PetCO2 trace and BOLD time series were temporally aligned. Two types of CVR maps were calculated, the first expressed as %∆BOLD/∆mmHG PetCO2 and the second as regression coefficient between the BOLD time series and the PetCO2 trace. The time course of response (i.e. response dynamics) was also extracted using the Regressor Interpolation at Progressive Time Delays (RIPTiDe), which calculates the time lag at the maximal correlation between the PetCO2 and BOLD time series in each voxel.6,7 Additionally, time delay information was calculated using a general linear model (GLM) approach with the PetCO2 used as the predictor of the BOLD signal changes and extracting the time lag at the maximal t-statistic for each voxel.Results & Discussion
Visual inspection of CVR maps indicated similar spatial distribution for BH and CO2 inhalation paradigms (Fig. 2). Both hypercapnic stimuli produced the expected spatial pattern of highest CVR values in the cortical grey matter.8,9 Additionally the voxelwise correlation between CVR values was significant (r=.70, p<.001, r=.77, p<.001, CVR expressed as %∆BOLDsignal/∆mmHG and regression coefficients respectively). Thus, CVR results were in line with previous research.4 For the first subject the RIPTiDe delay analysis provided visually similar results for BH and the CO2 challenge (Fig 3). Nevertheless, for all other delay maps the CO2 challenge more clearly showed the expected pattern of higher delays in white matter areas than BH. Conclusively, BH leads to more variability in time delay calculations, while the CO2 challenge provided consistent results. This difference could be caused by the time it takes for CO2 to build up within the body during BH in contrast to the strong, rapid increase caused by the CO2 challenge. Only fast reacting, or upstream vessels (i.e. in the grey matter areas) can immediately respond to the changes caused by the CO2 challenge. Rapid changes in peripheral resistance may cause blood flow redistribution away from areas that cannot respond as fast, which induces lagged responses in those areas. Since BH is a gradual stimulus this effect will be mitigated and vessels will have enough time to respond to the slow increase in CO2, and thus does not lead to response lags. The differences between BH and the CO2 cannot be explained by differences in stimulus strength, as the data indicates this was similar in both paradigms. Even though BH does not allow to target certain PetCO2 levels, our breathing protocol allowed for precisely reproducible BH stimuli. Due to the limited sample size, we are only able to draw preliminary conclusions. More subjects will be included to corroborate above results.Conclusion
Based on this data we conclude that BH may provide adequate CVR measurements, but is a less reliable stimulus compared to a controlled CO2 challenge for providing information regarding flow dynamics throughout the brain. As the timing of the response allows to distinguish voxels with reduced vasodilatory reserve from voxels with a slow, but otherwise normal response, this provides additional, valuable information regarding cerebrovascular health. Thus, depending on the type of hypercapnic stimulus used to measure CVR, different parameters regarding cerebrovascular health can reliably be extracted which should be taken into account both in future research as in clinical practice.Acknowledgements
No acknowledgement found.References
- Chan S T, Evans K C, Rosen B R, et al. A case study of magnetic resonance imaging of cerebrovascular reactivity: A powerful imaging marker for mild traumatic brain injury. Brain Injury. 2015;29(3);403-407.
- Kastrup A, Li T Q, Glover G H, Moseley M E. Cerebral blood flow-related signal changes during breath-holding. Am J Neuroradiol. 1999;20(7);1233–1238.
- Magon S, Basso G, Farace P, et al. Reproducibility of BOLD signal change induced by breath holding. NeuroImage. 2009;45(3);702–712.
- Kastrup A, Krüger G, Neumann-Haefelin T, Moseley ME. Assessment of cerebrovascular reactivity with functional magnetic resonance imaging: Comparison of CO2 and breath holding. Magn Reson Imaging. 2001;19(1):13–20.
- Jenkinson M, Beckmann C F, Behrens T E, et al. FSL. NeuroImage. 2012;62(2);782–790.
- Champagne A A, Bhogal A A, Coverdale N S, et al. A novel perspective to calibrate temporal delays in cerebrovascular reactivity using hypercapnic and hyperoxic respiratory challenges. NeuroImage. 2019;187;154-165.
- Donahue M J, Strother M K, Lindsey K P, et al. Time delay processing of hypercapnic fMRI allows quantitative parameterization of cerebrovascular reactivity and blood flow delays. J Cerebr Blood F Met. 2016;36(10);1767–1779.
- Bhogal A A, Philippens M E P, Siero J C W, et al. Examining the regional and cerebral depth-dependent BOLD cerebrovascular reactivity response at 7T. NeuroImage. 2015;114;239–248.
- Moody D M, Bell M A, Challa V R. Features of the cerebral vascular pattern that predict vulnerability to perfusion or oxygenation deficiency: An anatomic study. Am J Neuroradiol. 1990;11(3);431–439.
Figures
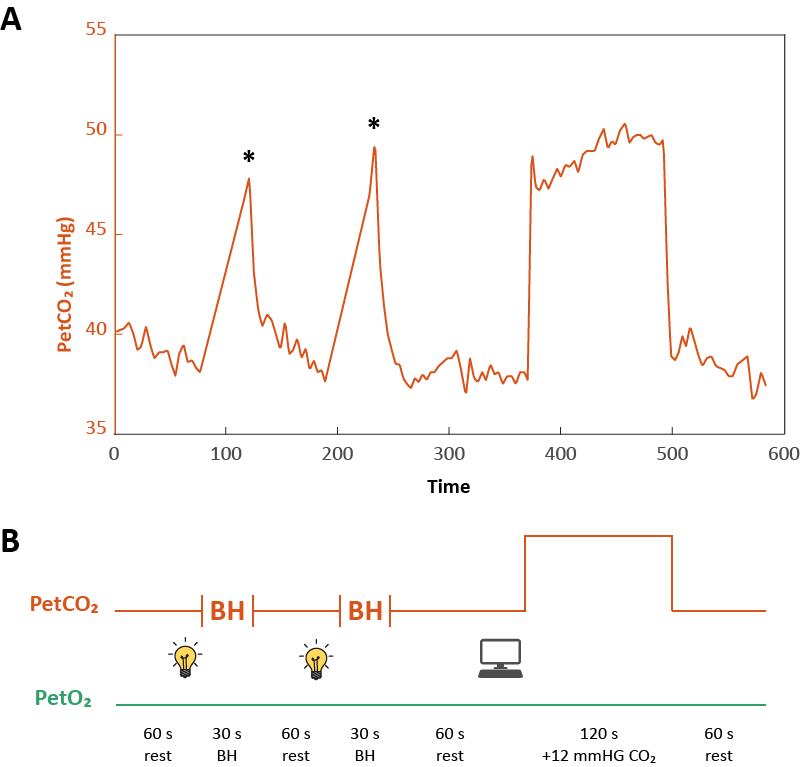
Figure 1. Breathing protocol. Orange lines indicate PetCO2
and green lines PetO2. A) Represents actual data from the first
participant gathered during the experiment. * indicates the PetCO2
level based on first expiration after breath-holding. B) Visual overview of planned
breathing protocol. Time to stop breathing was indicated by turning off the
lights in the scanner room and participants used the scanner sounds (TR=1.1 sec)
to hold their breath for approximately 30 seconds. The CO2 challenge
was computer-controlled by the RespirAct. Rest periods indicate self-paced breathing.
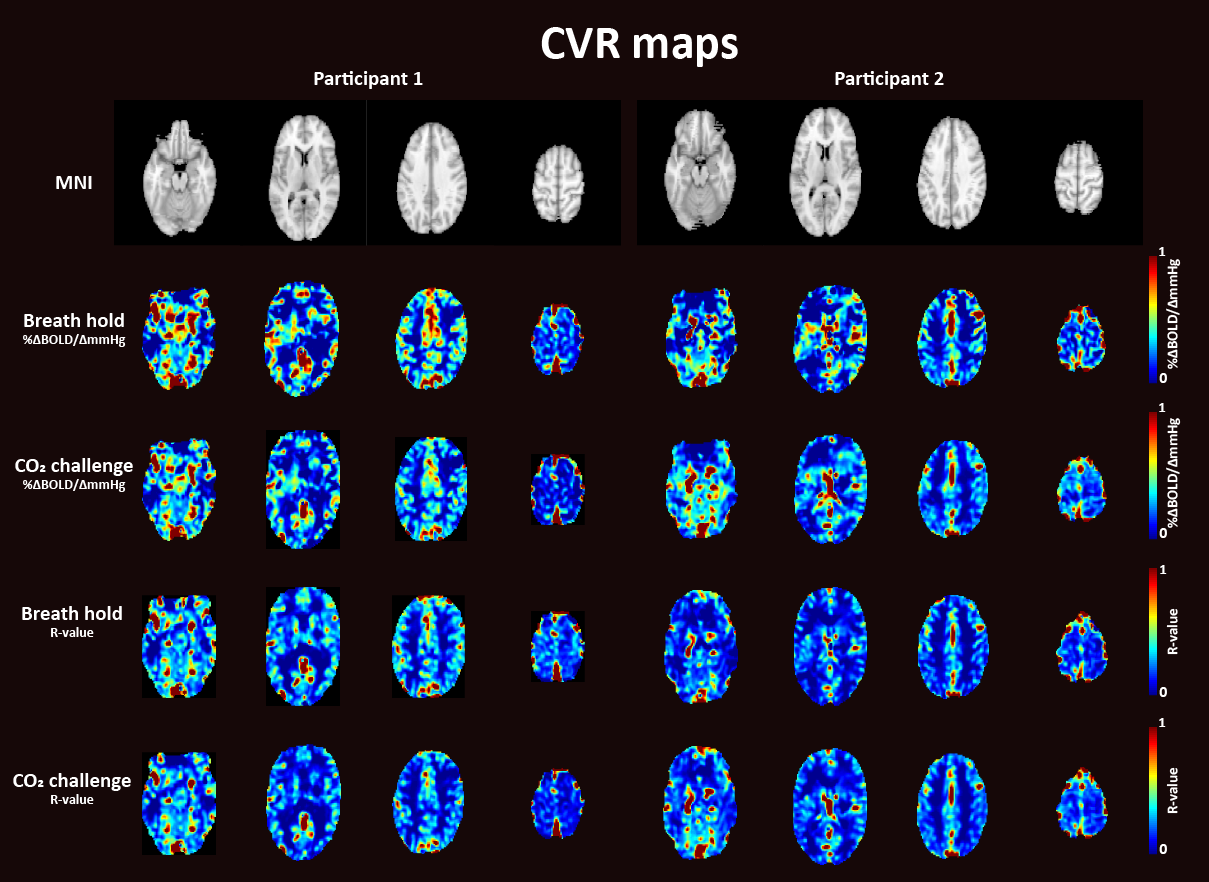
Figure 2. CVR maps for participant 1
(left) and participant 2 (right) during breath holding and during the CO2
challenge expressed as %∆BOLD/∆mmHg (top panels) and as R-values (bottom
panels)
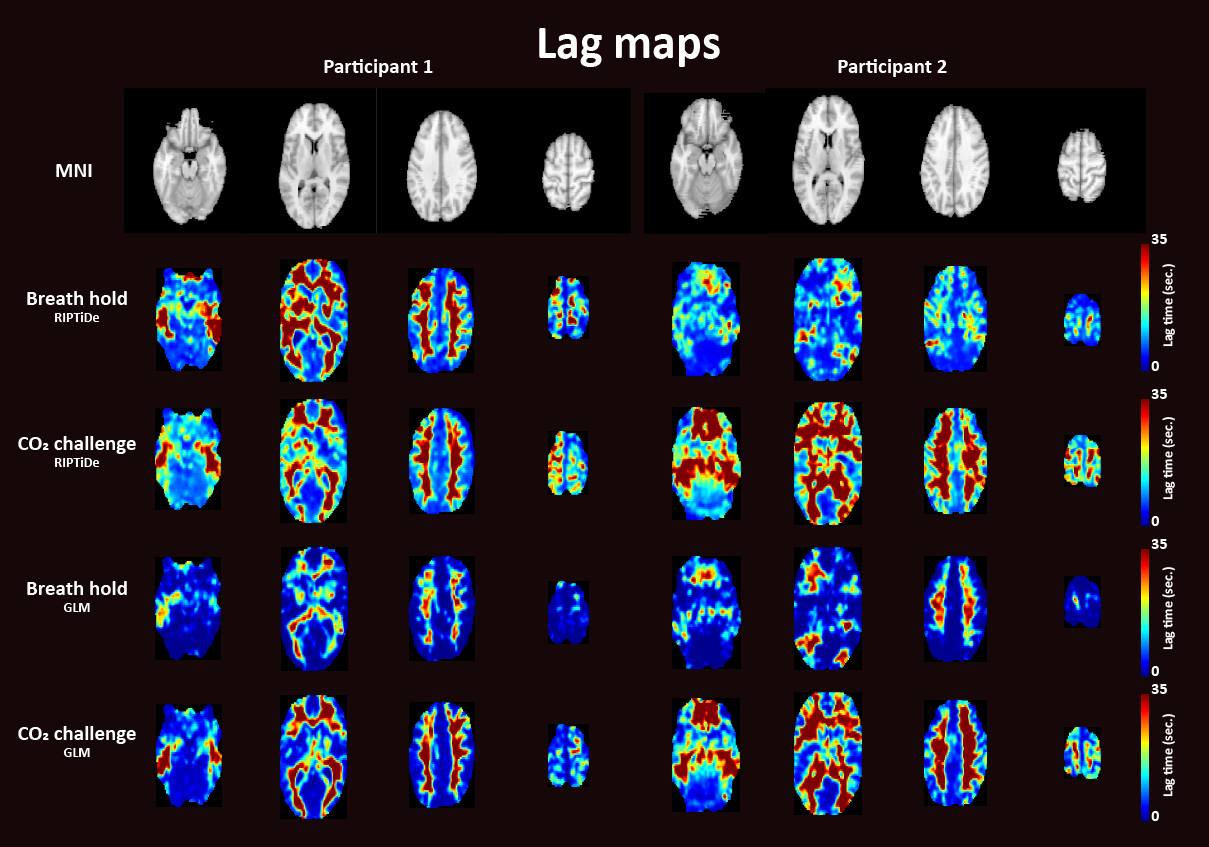
Figure 3. Time delay maps for participant 1 (left) and
participant 2 (right) during breath holding and during the CO2 challenge
based on the RIPTiDe analysis (top panels) or a GLM approach (bottom panels).