1619
Correlation analysis between APTW and blood flow status in the ischemic penumbra of patients with subacute ischemic stroke1the First Affiliated Hospital of Dalian Medical University, Dalian, China, Dalian, China, 2Philips Healthcare, Beijing, China, Beijing, China
Synopsis
The presence, dynamic evolution, and outcome of the ischemic penumbra (IP) are important for the choice of treatment options and prognosis. At present, there is currently no study to combine the APTw MRI with the blood flow measurements for IP analyses. Purpose of this study was to analyze the association between APT metabolic changes and blood flow status in the IP of patients with subacute infarction in the unilateral middle cerebral artery by APT and ASL techniques. Significant correlations of APTw values to CBF values of PLD1.5.
Introduction
Stroke as a serious cerebrovascular disease is the main cause of long-term disability and death, and seriously affects the quality of people's life[1]. The presence, dynamic evolution, and outcome of the ischemic penumbra (IP) are important for the choice of treatment options and prognosis. Amide proton transfer (APT) imaging technique is a novel magnetic resonance technique which can detect changes in brain metabolites and assesses changes in pH of brain tissue after infarction. Based on this, it is a safe and non-invasive technique to accurately divide the ischemic penumbra (IP)[2]. Arterial spin label (ASL) can assess hemodynamic changes in brain tissue after infarction. Purpose of this study was to evaluate the correlation between APT-related metabolic changes and blood flow status in IP of patients with subacute ischemic stroke in the unilateral middle cerebral artery blood supply area by APTw and ASL MR techniques.Materials and Methods
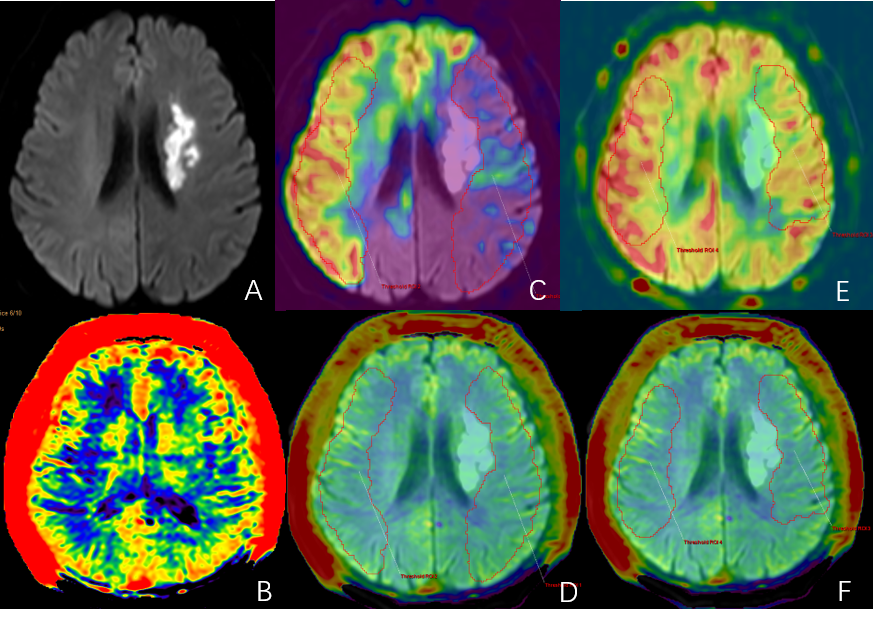
This study was approved by the ethics committee of the hospital. A total of 40 patients (23 males, age 44-87 years) with clinically suspected ischemic stroke was prospectively collected and underwent routine sequences and APTw imaging on a 3.0 T MR scanner (Ingenia CX, Philips Healthcare, Best, the Netherlands). Excluding the scanning artifacts and interrupted scans due to poor patient cooperation, a total of 16 patients (9 males, age 44-86 years) with subacute ischemic stroke in the unilateral middle cerebral artery blood were collected. After scanning, image was automatically transmitted to the vender-provided workstation (IntelliSpace Portal), where the data post-processing was independently carried out by two observers. The DWI images were fused with the arterial spin label (ASL) and APTw images. 3D ROI was delineated on the DWI-ASL mismatched area and used to obtain the APTw (including APTwmax, APTwmin, APTwmean)、CBF (PLD1.5 and PLD2.5 on ASL image) values and the volume of IP. The rCBF value was calculated by dividing CBF value of the affected side by that of the contralateral side. Calculate the difference between the maximum and minimum values (APTwmax-APTwmin), defined as APTwmax-min, which is used to reflect the APTw signal heterogeneity[3]. The interclass correlation coefficient (ICC) was used to evaluate measurement consistency between the two observers. Using paired sample t test to analysis of differences in bilateral APTW values. Coeffcient (ICC) was used to evaluate measurement consistency between the two observers. The paired sample t test was used to analyze differences of bilateral APTw values. The Pearson correlation test was used to analyze correlations of APTw to CBF values.Results
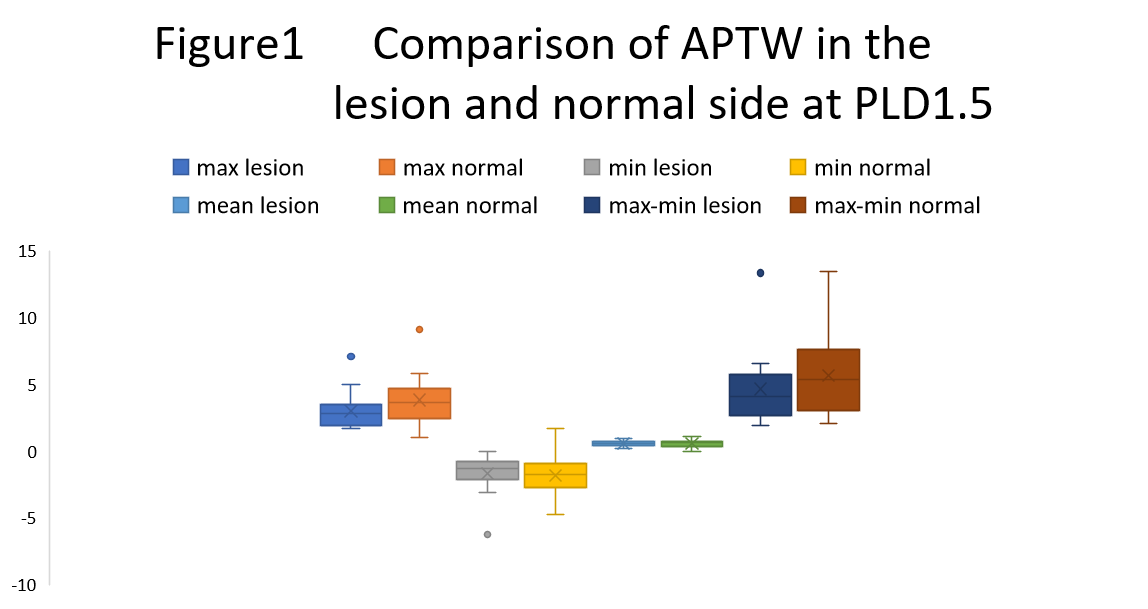
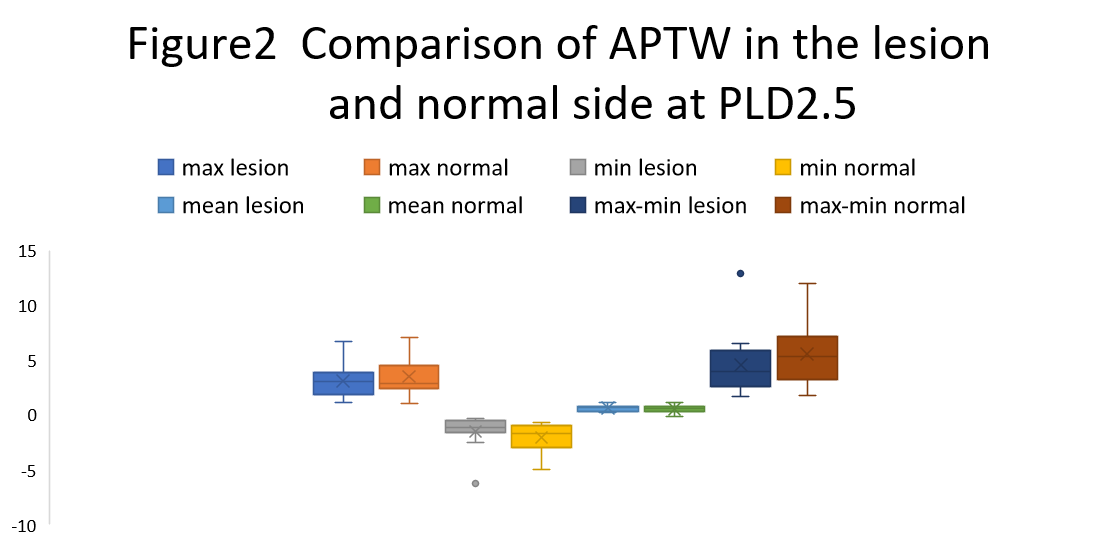
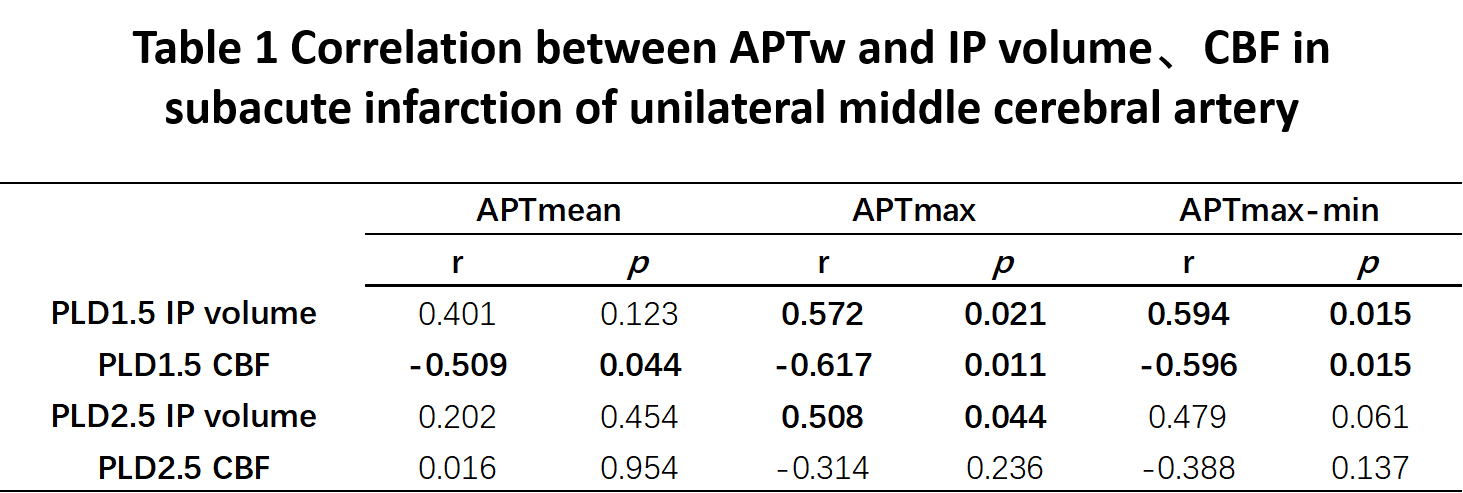
Measurements by the two observers are in good agreement (ICC > 0.75). APTmax and APTmax-min in the lesion side was significantly lower than the normal side at PLD1.5 (t=-3.043,p=0.008; t=-2.317,p=0.035). (Figure1). APTmin and APTmax-min in the lesion side was significantly lower than the normal side at PLD2.5 (t=2.341,p=0.033; t=-2.561,p=0.022).(Figure2).Significant correlations of APTwmean, APTmax, APTwmax-min values to CBF values of PLD1.5 (p=0.044, r=-0.509; p=0.011, r=-0.617; p=0.015, r=-0.596); The IP volumes were observed to be positively correlated to APTWmax, APTWmax-min at PLD 2.5 (p=0.021,r=0.572; p=0.015,r=0.594). (Table 1)
Discussion and conclusions
Results of this study showed that APTWmax and APTWmax-min of IP were significantly lower than the contralateral side, indicating that there was acidosis and heterogeneous ischemic injury in the penumbra area compared with the contralateral normal area. Besides, this study showed APTw values in the ischemic penumbra of the unilateral middle cerebral artery were negatively correlated with blood flow status. The perfusion of blood flow gradually decreased with the prolongation of infarction time, the blood perfusion in the subacute phase decreased, the APTWmax and APTWmean of IP increased at PLD1.5, and there was no statistical difference between the affected side and the contralateral APTW, which may indicate that "false normalization" occurs in the subacute APTW or that the acidosis in the ischemic area gradually changes to alkali poisoning over time. With the decrease of blood perfusion, the APTWmax-min of IP increases, and the heterogeneity of APTW signal in tissue (ie APTWmax-min) can reflect the diversity of pH value of ischemic stroke tissue, indicating that heterogeneous ischemic injury in the tissue still exist in the subacute infarction. There is a significant positive correlation between IP volume and APTWmax-min at PLD1.5, indicating that the larger the IP range, the more significant the heterogeneity of the APTW signal in the tissue. In summary, the volume of the penumbra and the state of blood flow have a certain influence on the APTW change of the penumbra.Acknowledgements
References
[1] Johnston S C, Mendis S, Mathers C D. Global variation in stroke burden and mortality: estimates from monitoring, surveillance, and modelling.[J]. Lancet Neurology, 2009, 8(4):345-354.
[2] Harston G W J , Tee Y K , Blockley N , et al. Identifying the ischaemic penumbra using pH-weighted magnetic resonance imaging[J]. Brain, 2015, 138(1):36-42.
[3] Jiang S, Yu H, Wang X, et al. Molecular MRI differentiation between primary central nervous system lymphomas and high-grade gliomas using endogenous protein-based amide proton transfer MR imaging at 3 Tesla.[J]. European Radiology, 2016, 26(1):64-71.
Figures