1615
Quantitative Evaluation of Neuronal Recovery in stroke patients by Rehabilitation Using Myelin Water Fraction mapping1Electrical & Electronic Engineering, Yonsei University, Seoul, Republic of Korea, 2Department and Research Institute of Rehabilitation Medicin, Yonsei University College of Medicine, Seoul, Republic of Korea
Synopsis
Stroke is a worldwide disease and requires quantitative evaluation for better patient management. In evaluating rehabilitation of stroke patients, quantitative analysis was performed using the conventional DTI-FA and multi echo GRE Myelin Water Fraction mapping technique
Introduction
Stroke is the leading cause of serious disability worldwide. Disorders in patients with degradation of limb function require rehabilitation therapy to restore the function [1]. While performance based impairment index such as FMA (Fugl-Meyer Assessment) score is typically used for assessment, imaging biomarkers (such as DTI) can provide accurate quantitative evaluation. In this study, we quantitatively analyzed brain plasticity during rehabilitation using Myelin Water Fraction(MWF) through mGRE imaging [2-3].Method
[Patient characteristics]Patients with hemiplegic patients who had subacute stroke (within 6 months after onset) were given occupational and robotic treatments once a day for 30 minutes, 5 days a week for 4 weeks.(FMA>7, 3 men 7 women, age: 62.2 ± 16.4years). Rehabilitation was performed daily for 4 weeks with activities using the hands, shoulders and elbow joints with the aid of robots and physical therapists.
[Data acquisition]
Imaging was performed pre and post treatment. Post-treatment scan was taken 4 weeks after pre scan. Stroke patients with intact CST (corticospinal tract) were selected for the study. In-vivo data were acquired on a 3 Tesla MRI scanner (SIEMENS MAGNETOM Prisma_fit) using a 20-channel head coil for signal reception. 3D mGRE data with navigator echo and flow compensation was acquired for MWF mapping. DTI were also acquired. The imaging parameters were as follows : TR = 46ms, first TE = 1.7 ms, echo spacing = 1.1 ms, number of echoes = 30, flip angle = 20°, field of view = 256 × 256 × 144 mm3, spatial resolution = 2 × 2 × 2 mm3. DTI parameters were as follows : TR = 3300ms, TE = 55ms, field of view = 244 × 244 × 152 mm3, spatial resolution = 1.1 × 1.1 × 2 mm3. T1 MPRAGE parameters were as follows : TR = 2200ms, field of view = 256 × 256 × 144 mm3, spatial resolution = 1 × 1 × 1 mm3.
[Data Processing]
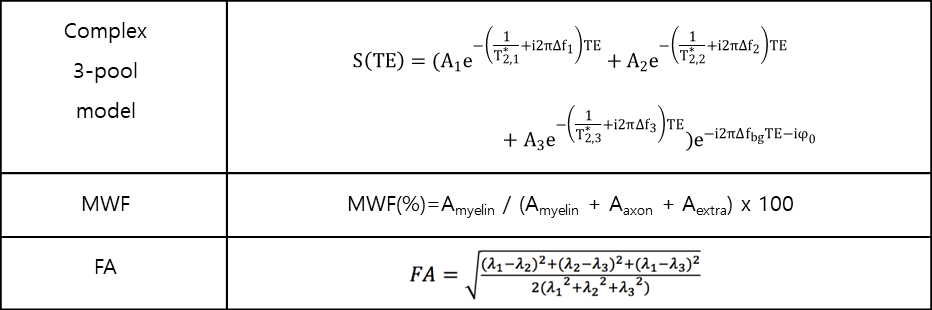
Registration of the DTI and MWF were performed prior to analysis using a reference T1 MPRAGE image that was acquired. In this study, only the CST tract was analyzed. The CST track was identified using anatomic fiber tracking and FA values were calculated. MWF was calculated using a 3 pool complex-valued model based fitting approach [4]. The p-value of the Student's t-test was used to verify the relationship and the amount of change between pre and post by ROI. ROI analysis was divided into the affected and unaffected CST regions.
Results
Figure 1 shows the pre-post FA and MWF values for each ROI. By default, the value of affected area is smaller in the FA and MWF than the value of unaffected area. In FA, the affected region had a statistically significant change (p-value<0.05) In MWF, both the affected area and unaffected area had a statistically significant change.Figure 2 shows the pre-post FA and MWF changes in ratio ((post-pre)/pre) at each ROI. In FA and MWF, the affected area had more change than the unaffected area. While the affected ROI had more change in both FA and MWF, the MWF change was consistently larger compared to FA changes.
Figure 3 shows a visual comparison of the pre-post MWF values in CST from several subjects. The patient's affected area is right(right side on the figure). Post treatment scan shows overall increase in MWF..
Discussion
The value of unaffected area generally corresponds to the value of CST because the amount of affected area is less than the amount of unaffected area. We only recruited patients with visible CST on DTI, which indicates the degree of directionality of axon, was not significantly different between pre and post. In this case, the MWF can provide a clear difference. The reason why STD is high in MWF is because the damaged part and normal part is mixed.Conclusion
The purpose of this study was to analyze the pre-post FA and MWF values and changes in each ROI after rehabilitation. When comparing the values of cases with mean (fig1), only affected area was significant in FA and all significant in MWF. When comparing changes in cases (fig2), only affected area was significant in FA and all significant in MWF. The change in MWF is larger and meaningful than the change in FA. This suggests that MWF through mGRE can potentially be applied as a reliable biomarker for quantitative evaluation before and after rehabilitation of stroke patients.Acknowledgements
No acknowledgement found.References
1. Kelly-Hayes, et al. The influence of gender and age on disability following ischemic stroke: the Framingham study. Journal of Stroke and Cerebrovascular Diseases: The Official Journal of National Stroke Association, 2003;12:119-126
2. Nam, Y., et al. Improved estimation of myelin water fraction using complex model fitting. NueroImage, 2015;116:214-221
3. Lee, J., et al. Mechanisms of T2* Anisotropy and Gradient Echo Myelin Water Imaging. NMR in Biomedicine. Review article. 2017;30(4):e3513
4. Lee, H., et al. Improved Three-dimensional Multi-echo Gradient Echo Based Myelin Water Fraction Mapping With Phase Related Artifact Correction. Neuroimage, 2018;169:1-10
Figures
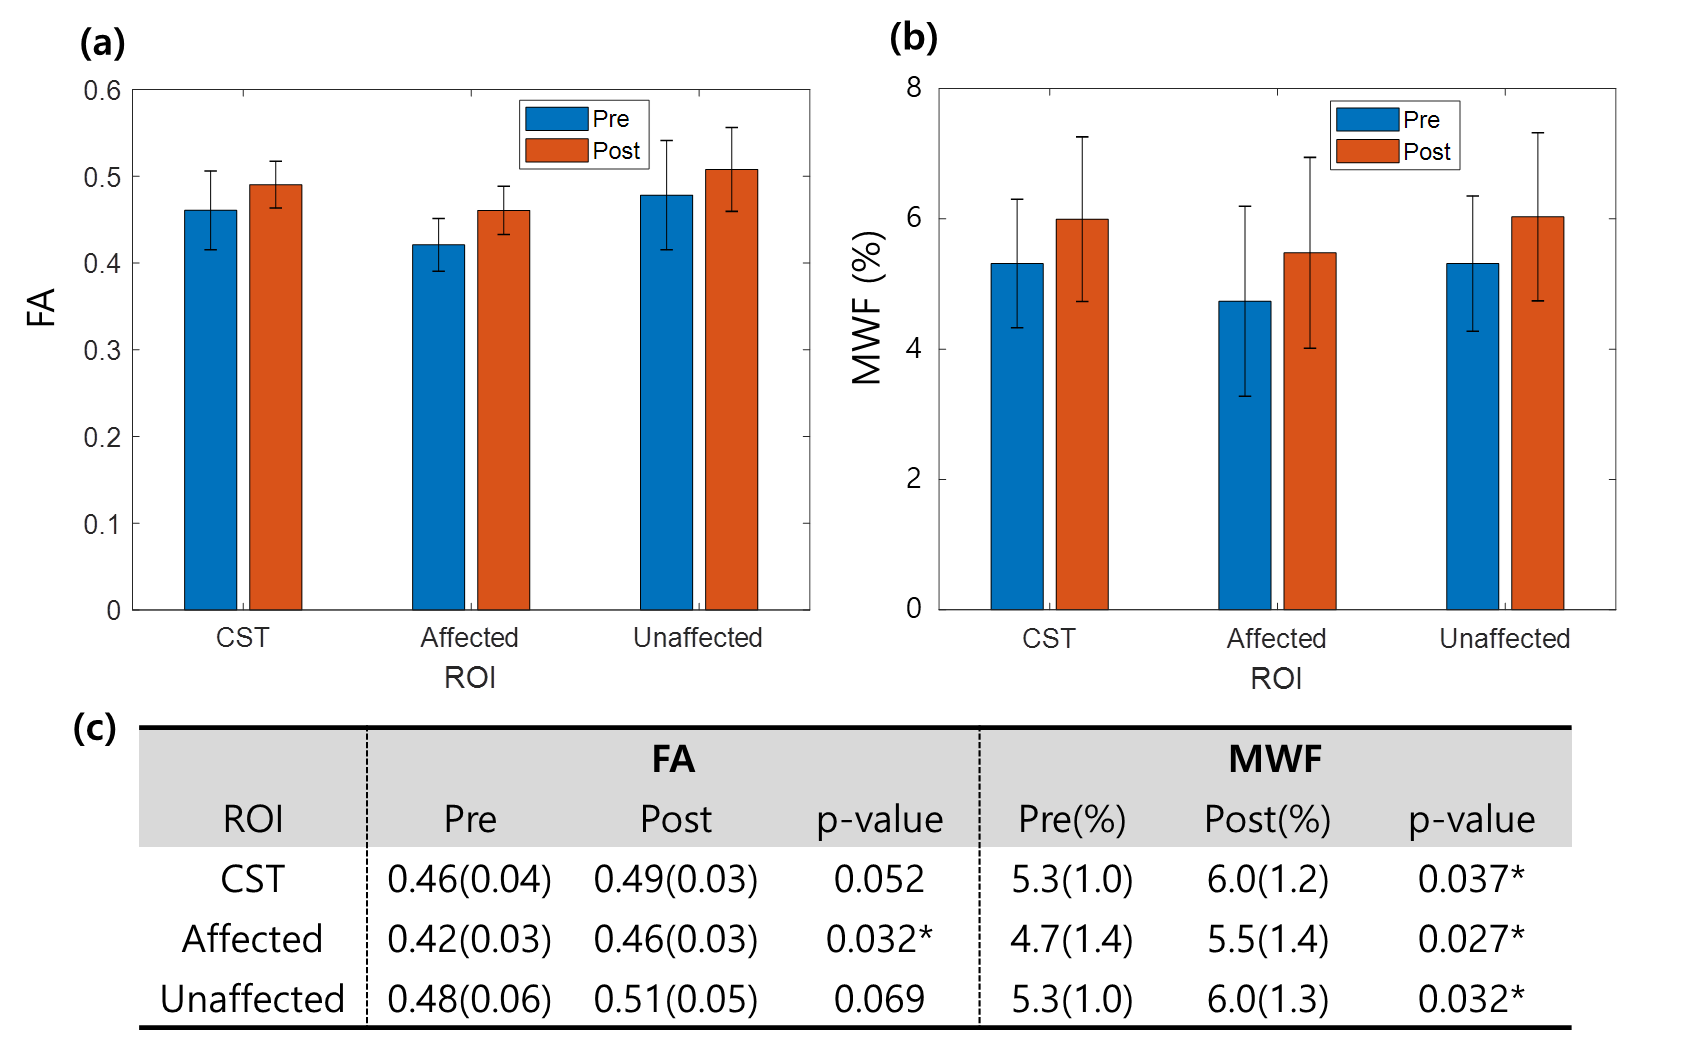
[Figure 1] Pre-Post and p-value of FA values and MWF values by ROI.
(a) is a graph of FA values, (b) is a graph of MWF values, and (c) is a table of all values and p-value.
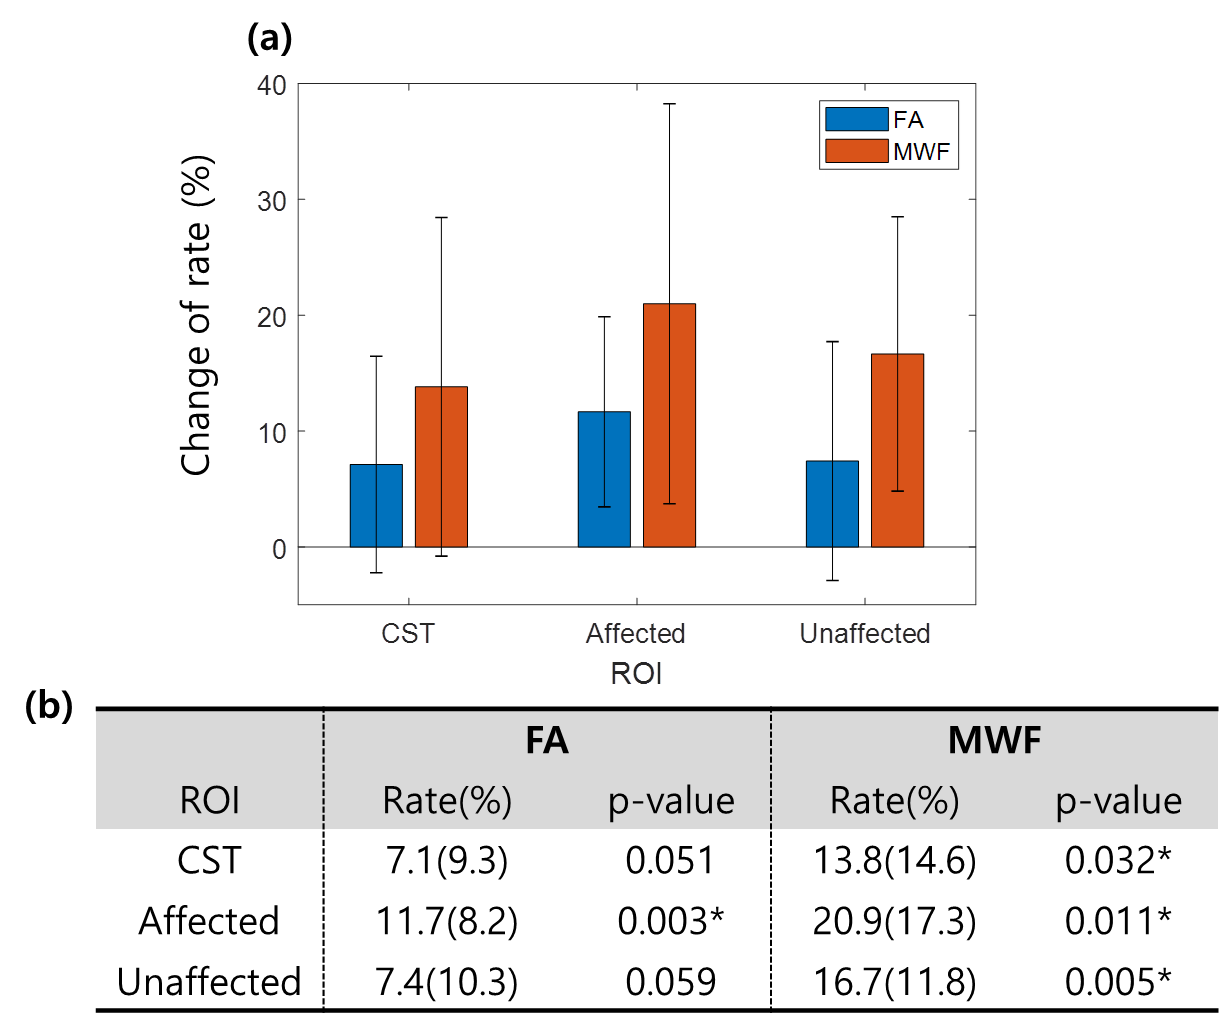
[Figure 2] The amount of change in FA and MWF by ROI.
The amount of change was calculated by (post-pre/pre). (a) is a graph of FA and MWF changes. (b) is a table of FA and MWF changes and p value
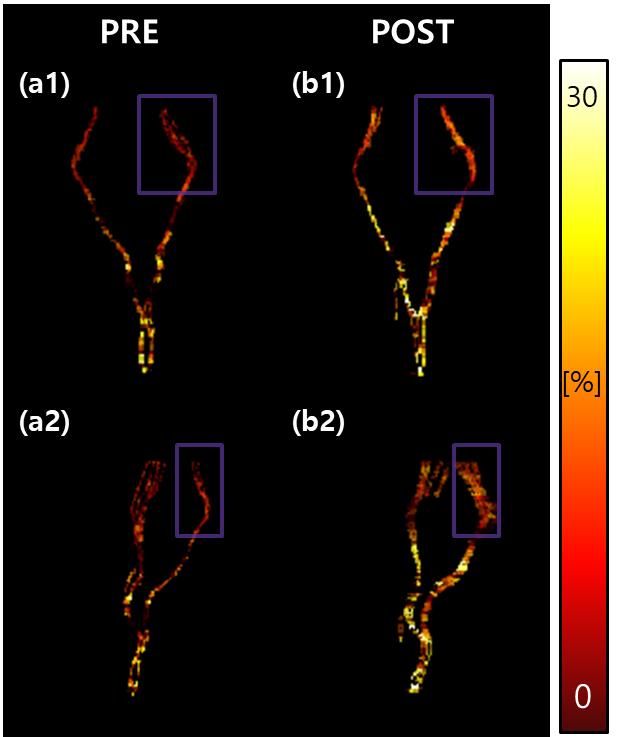
[Figure 3] Visual comparison of pre-post MWF in 1 case of CST.
The affected area is right and the right part of the figure (purple box). (a1) and (a2) are pre CST MWF at various angles, and (b1) and (b2) are post CST MWF at various angles.