1613
Modulating Functional Networks and Language Performance by Repetitive Transcranial Magnetic Stimulation in Post-stroke Aphasia1Biomedical imaging and radiological sciences, National Yang-Ming University, Taipei, Taiwan, 2Taipei Veterans General Hospital, Taipei, Taiwan
Synopsis
Low-frequency repetitive transcranial magnetic stimulation (rTMS) provided promising results to facilitate the language recovery in stroke patients with non-fluent aphasia. This study demonstrated a contralesional inhibitory rTMS treatment can modulate the brain functional networks compare to the conventional therapy. The modulated functional networks were further correlated with the improvement of language performance after the rTMS treatment.
Synopsis
Low-frequency repetitive transcranial magnetic stimulation (rTMS) provided promising results to facilitate the language recovery in stroke patients with non-fluent aphasia. This study demonstrated a contralesional inhibitory rTMS treatment can modulate the brain functional networks compare to the conventional therapy. The modulated functional networks were further correlated with the improvement of language performance after the rTMS treatment.Background and Purpose
Aphasia is most often caused by either ischemic or hemorrhagic stroke when the brain areas, such as the inferior frontal gyrus (Broca’s area), left superior temporal gyrus (Wernicke’s area) or sometimes the basal ganglia, are damaged. During past decade, repetitive transcranial magnetic stimulation (rTMS) was proposed with promising evidence to facilitate the language recovery in patients with non-fluent aphasia after stroke.1,2 Specifically, a low-frequency rTMS applied over the contralesional pars triangularis can induce an inhibitory effect to downregulate the circuits in normal hemisphere and hence benefits the language recovery.3 In this study, we aim to investigate the modulation effect from the inhibitory rTMS treatment on the brain functional networks and further unravel the association between altered functional networks and language improvement in patients with post-stroke aphasia.Materials and Methods
This study was approved by the local Institutional Review Board, and the written informed consent was provided by each participant. Twenty-eight patients with chronic stroke covering the left inferior frontal gyrus and diagnosis of non-fluent aphasia were recruited. The enrolled patients were randomly assigned into one of the study groups, either treated with 1 Hz-rTMS on the contralesional pars triangularis (rTMS group) for 10 daily sessions or not (sham grouption). All the patients received language therapy twice a week. The Concise Chinese Aphasia Test (CCAT) with nine subtests, including simple response, expository speech, matching, auditory comprehension, naming, reading comprehension, repetition, copying, and spontaneous writing, was used to assess the language functions.4 MRI data, including a 3D-FSPGR T1-weighted images (TR/TE: 9.4/4.0 ms; voxel size: 1.0x1.0x1.0 mm3) and BOLD resting-state fMRI (TR/TE: 2500/30 ms; voxel size: 3.5x3.5x3.5 mm3, 190 volumes) were acquired on a 3T MR scanner (GE Discovery MR750). Each patient received twice MRI scans before and after the treatment to evaluate the changes of brain functional networks.The fMRI data were preprocessed using SPM12 with the standard procedures: corrected for slice timing, realigned, co-registered with structural images, spatially normalized into the standard space, and spatially smoothed with a 6-mm FWHM Gaussian kernel.5 The group spatial independent component analysis (ICA) was performed for all 28 patients using the GIFT toolbox version 3.0b.6 The functional data were decomposed into 25 independent components with the infomax algorithm. Single-subject time courses and spatial maps for each independent component were back reconstructed using a dual-regression process.6 Finally, the spatial maps of components for each subject were z-transformed into ICA z-maps.
Seven of 25 resting-state functional networks were selected for the subsequent statistical analyses. Two-sample t test (p<0.01 and cluster size=30) was performed on the differential z-maps (subtracting the post-treatment z-maps by the pre-treatment ones) for each selected network to investigate the differences between rTMS and sham groups. Correlation analyses (p<0.05) between changed scores of language performance and averaged differential z-values of brain regions that revealed significant group differences were performed for the rTMS and sham groups separately.
Results and Discussion
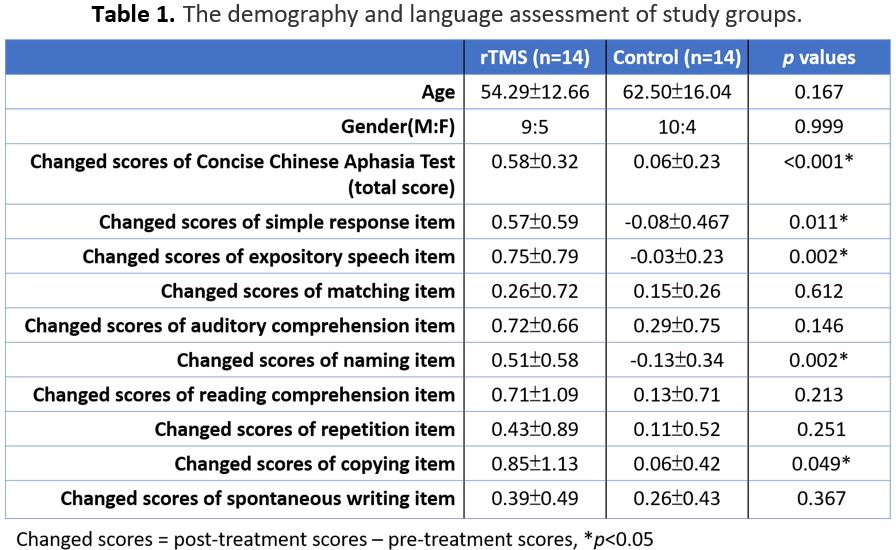
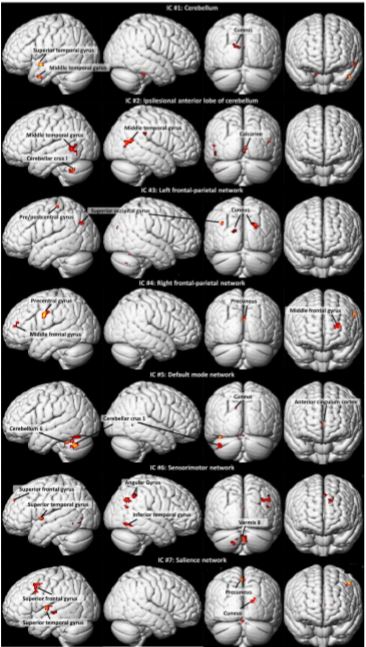
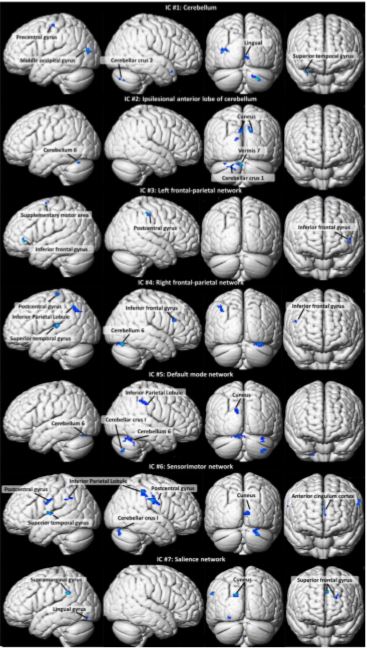
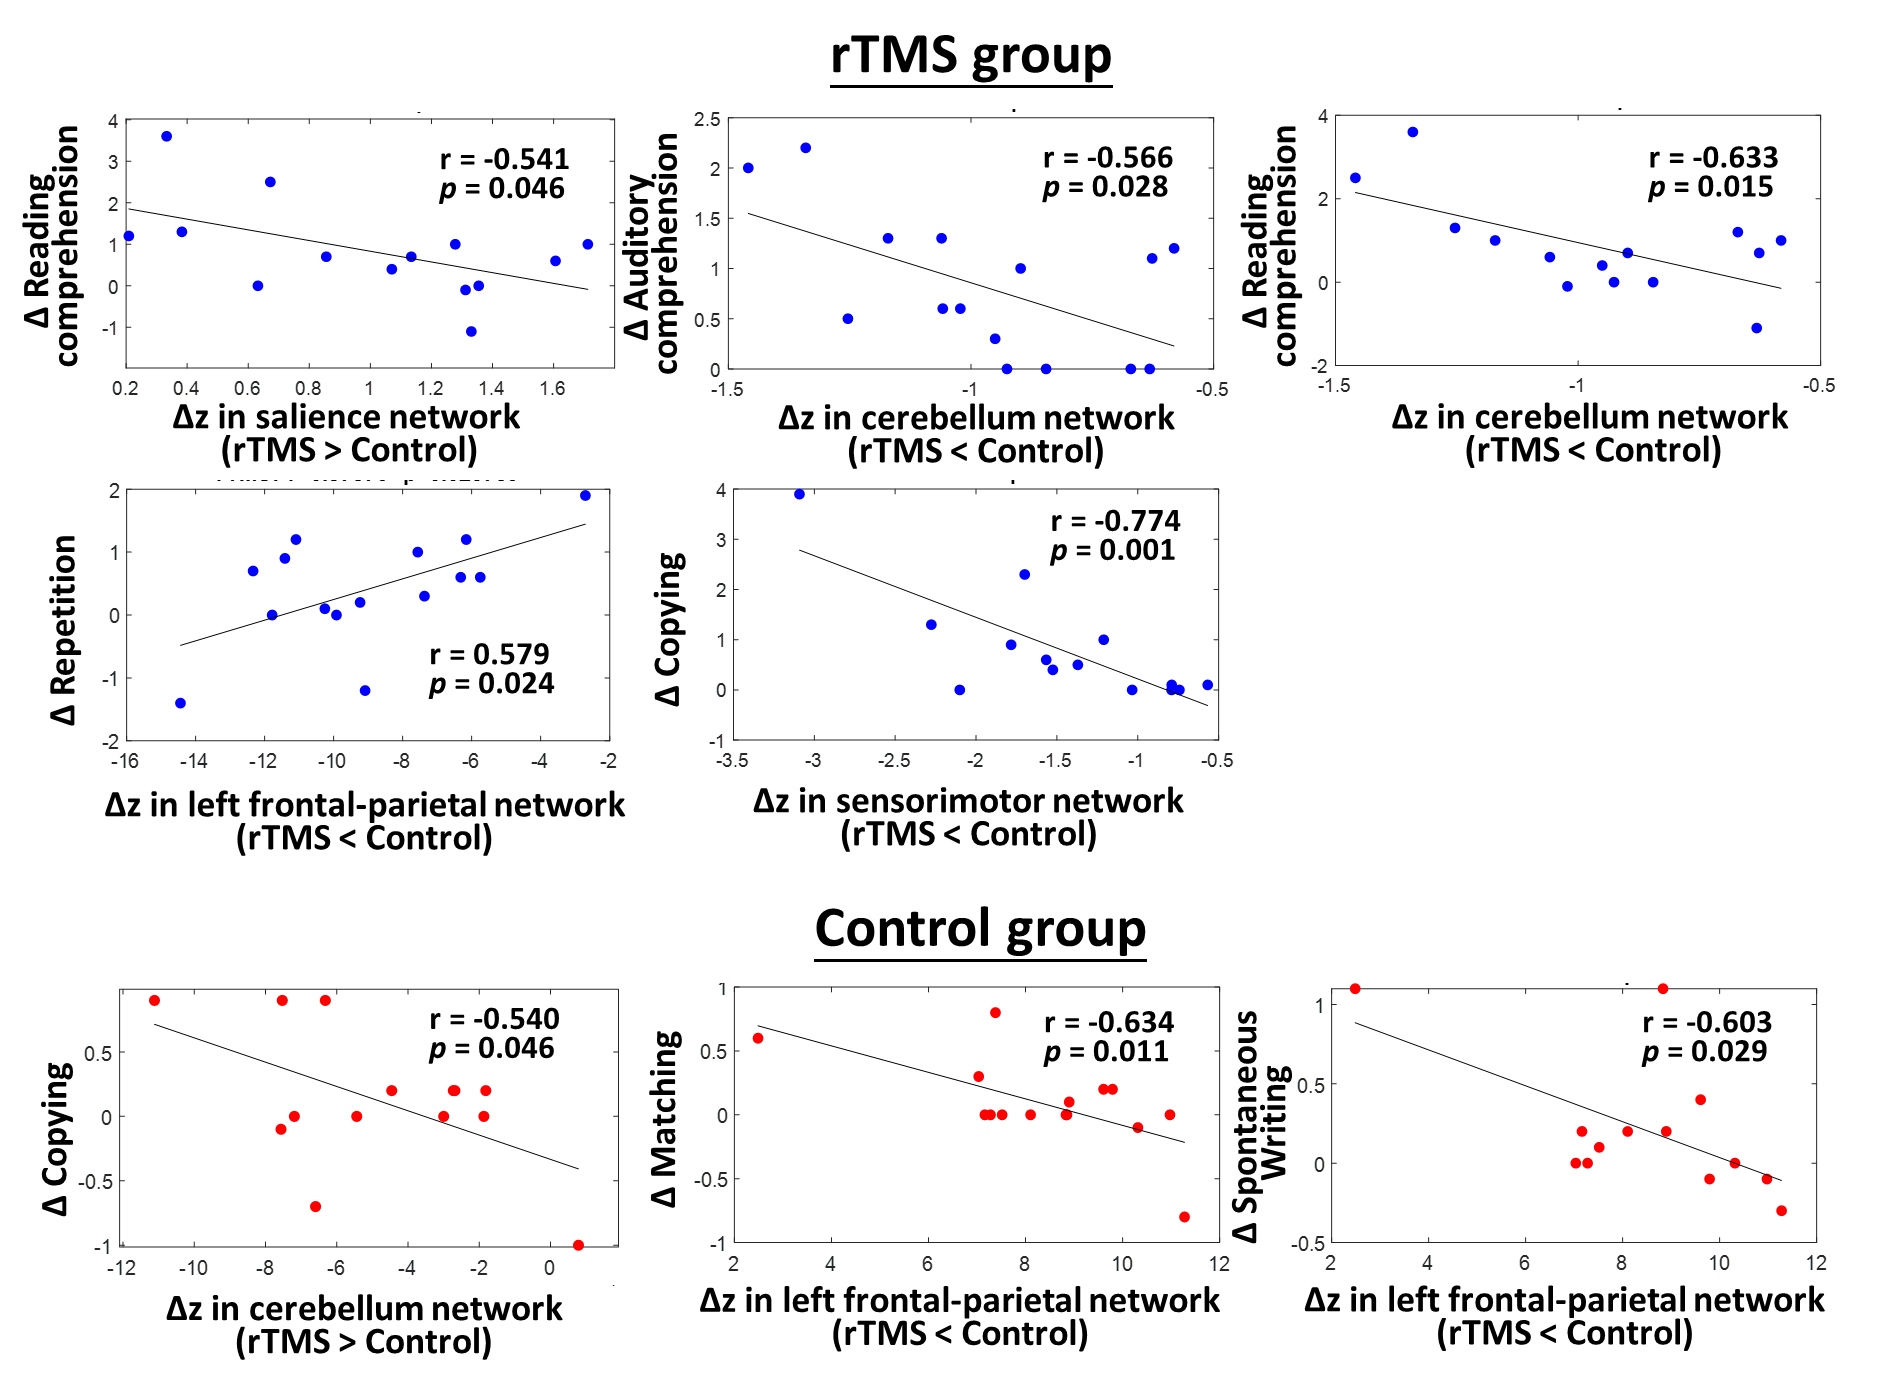
Table 1 lists the changes of language performance before and after treatment for rTMS and sham groups. The rTMS group showed significant improvements (larger positive values, p<0.05) of total score along with the simple response, expository speech, naming, and copying items of CCAT compared to the sham group, suggesting additional therapeutic effects of inhibitory rTMS on language recovery. Figure 1 shows brain regions with significantly increased z-values (strength of network) for the 7 selected brain networks in the rTMS group compared to the sham group. It was noted that most brain regions with increased strength in the rTMS group were located in the left/ipsilesional hemisphere, including the superior and middle temporal gyri, pre- and post-central gyri, superior and middle frontal gyri, occipital lobe, cerebellar crus 1 and cerebellum 6 regions. Only few regions in contralesional angular gyrus and temporal gyri presented an increased strength. For the significantly decreased z-values in the rTMS group, it is shown in Figure 2 that several brain regions from both hemispheres can be observed, including the inferior frontal gyrus, postcentral gyrus, and inferior parietal lobule. The z-value reductions in the cerebellar regions were mostly located in the right/contralateral hemisphere in the rTMS group. Taken together, these results indicated that the inhibitory rTMS on the contralesional pars triangularis may induce increased network strength mainly in the ipsilesional brain regions and reduce the network strength in bilateral brain areas.Figure 3 further unravels the associations between language recovery and altered z-values of brain regions with group differences. For the rTMS group, more significant correlations were identified compared to the sham group. A strong negative correlation (r=-0.774, p=0.001) was observed between the differential z-values within sensorimotor network and the change score of copying item of CCAT.
Conclusions
This study reported the modulation effects of inhibitory rTMS on the brain functional networks and unraveled strong associations between altered functional networks and language improvement in patients with post-stroke aphasia.Acknowledgements
This work was supported by the Ministry of Science and Technology, Taiwan (MOST 106-2221-E-010-016-MY3, MOST 108-2321-B-010-012-MY2).References
1. Tsai PY, Wang CP, Ko JS, Chung YM, Chang YW, Wang JX. The persistent and broadly modulating effect of inhibitory rTMS in nonfluent aphasic patients: a sham-controlled, double-blind study. Neurorehabilitation and neural repair. 2014 Oct;28(8):779-87.
2. Barwood CH, Murdoch BE, Whelan BM, Lloyd D, Riek S, O’Sullivan JD, Coulthard A, Wong A. Improved language performance subsequent to low‐frequency rTMS in patients with chronic non‐fluent aphasia post‐stroke. European Journal of Neurology. 2011 Jul;18(7):935-43.
3. Ren CL, Zhang GF, Xia N, Jin CH, Zhang XH, Hao JF, Guan HB, Tang H, Li JA, Cai DL. Effect of low-frequency rTMS on aphasia in stroke patients: a meta-analysis of randomized controlled trials. PloS one. 2014 Jul 18;9(7):e102557.
4. Chung YM, Lee SE, Chang MH, Hsu TC. The concise Chinese aphasia test and its application. J Speech Lang Hearing Assoc. 1998;13:119-37.
5. Penny WD, Friston KJ, Ashburner JT, Kiebel SJ, Nichols TE, editors. Statistical parametric mapping: the analysis of functional brain images. Elsevier; 2011 Apr 28.
6. Calhoun VD, Adali T, Pearlson GD, Pekar JJ. A method for making group inferences from functional MRI data using independent component analysis. Human brain mapping. 2001 Nov;14(3):140-51. 7. Beckmann CF, Mackay CE, Filippini N, Smith SM. Group comparison of resting-state FMRI data using multi-subject ICA and dual regression. Neuroimage. 2009 Jun 18;47(Suppl 1):S148.
Figures