1608
Investigation of the Windkessel Effect in Intracranial Aneurysms with Dual VENC 4D Flow MRI1Radiology, Northwestern University, Chicago, IL, United States, 2Neurosurgery, Northwestern University, Chicago, IL, United States
Synopsis
The Windkessel effect is hypothesized to be the mechanism of altered cerebral hemodynamics in intracranial aneurysms, via damping of pulsatile flow. 4D Flow MRI with specialized, network-based post-processing workflow provides damping factor (DF), by measuring pulsatility index (PI) ratio between proximal and distal vessels. PI values were higher in subjects with large aneurysms, even for contralateral vessels, suggesting patients with larger aneurysms may have other contributions to hemodynamics that also impact their vasculature outside the lesion. A multivariate linear correlation model shows that smaller aneurysms may have lower DF than contralateral, while larger aneurysms have higher DF ipsilateral than contralateral.
Introduction
The Windkessel effect is hypothesized to be the mechanism of altered cerebral hemodynamics in intracranial aneurysms, via damping of pulsatile flow1. Previous studies in digital subtraction angiography have provided evidence for this idea based on contrast arrival and filling times, though the clinical significance of this effect is still under investigation2. 4D Flow MRI noninvasively provides the damping factor (DF), by measuring the pulsatility index (PI) ratio between proximal and distal vessels, as shown previously in a study of aging-related changes in healthy volunteers3. 4D flow MRI has also been used to assess intra-aneurysmal hemodynamics4; however, 4D flow-derived DF assessment of arteries with aneurysms is not yet characterized or investigated as a biomarker for rupture prediction or treatment outcome. Here, dual-VENC 4D flow MRI5 and a specialized, network-based post-processing workflow6 are applied to investigate the Windkessel effect in intracranial aneurysms.Methods
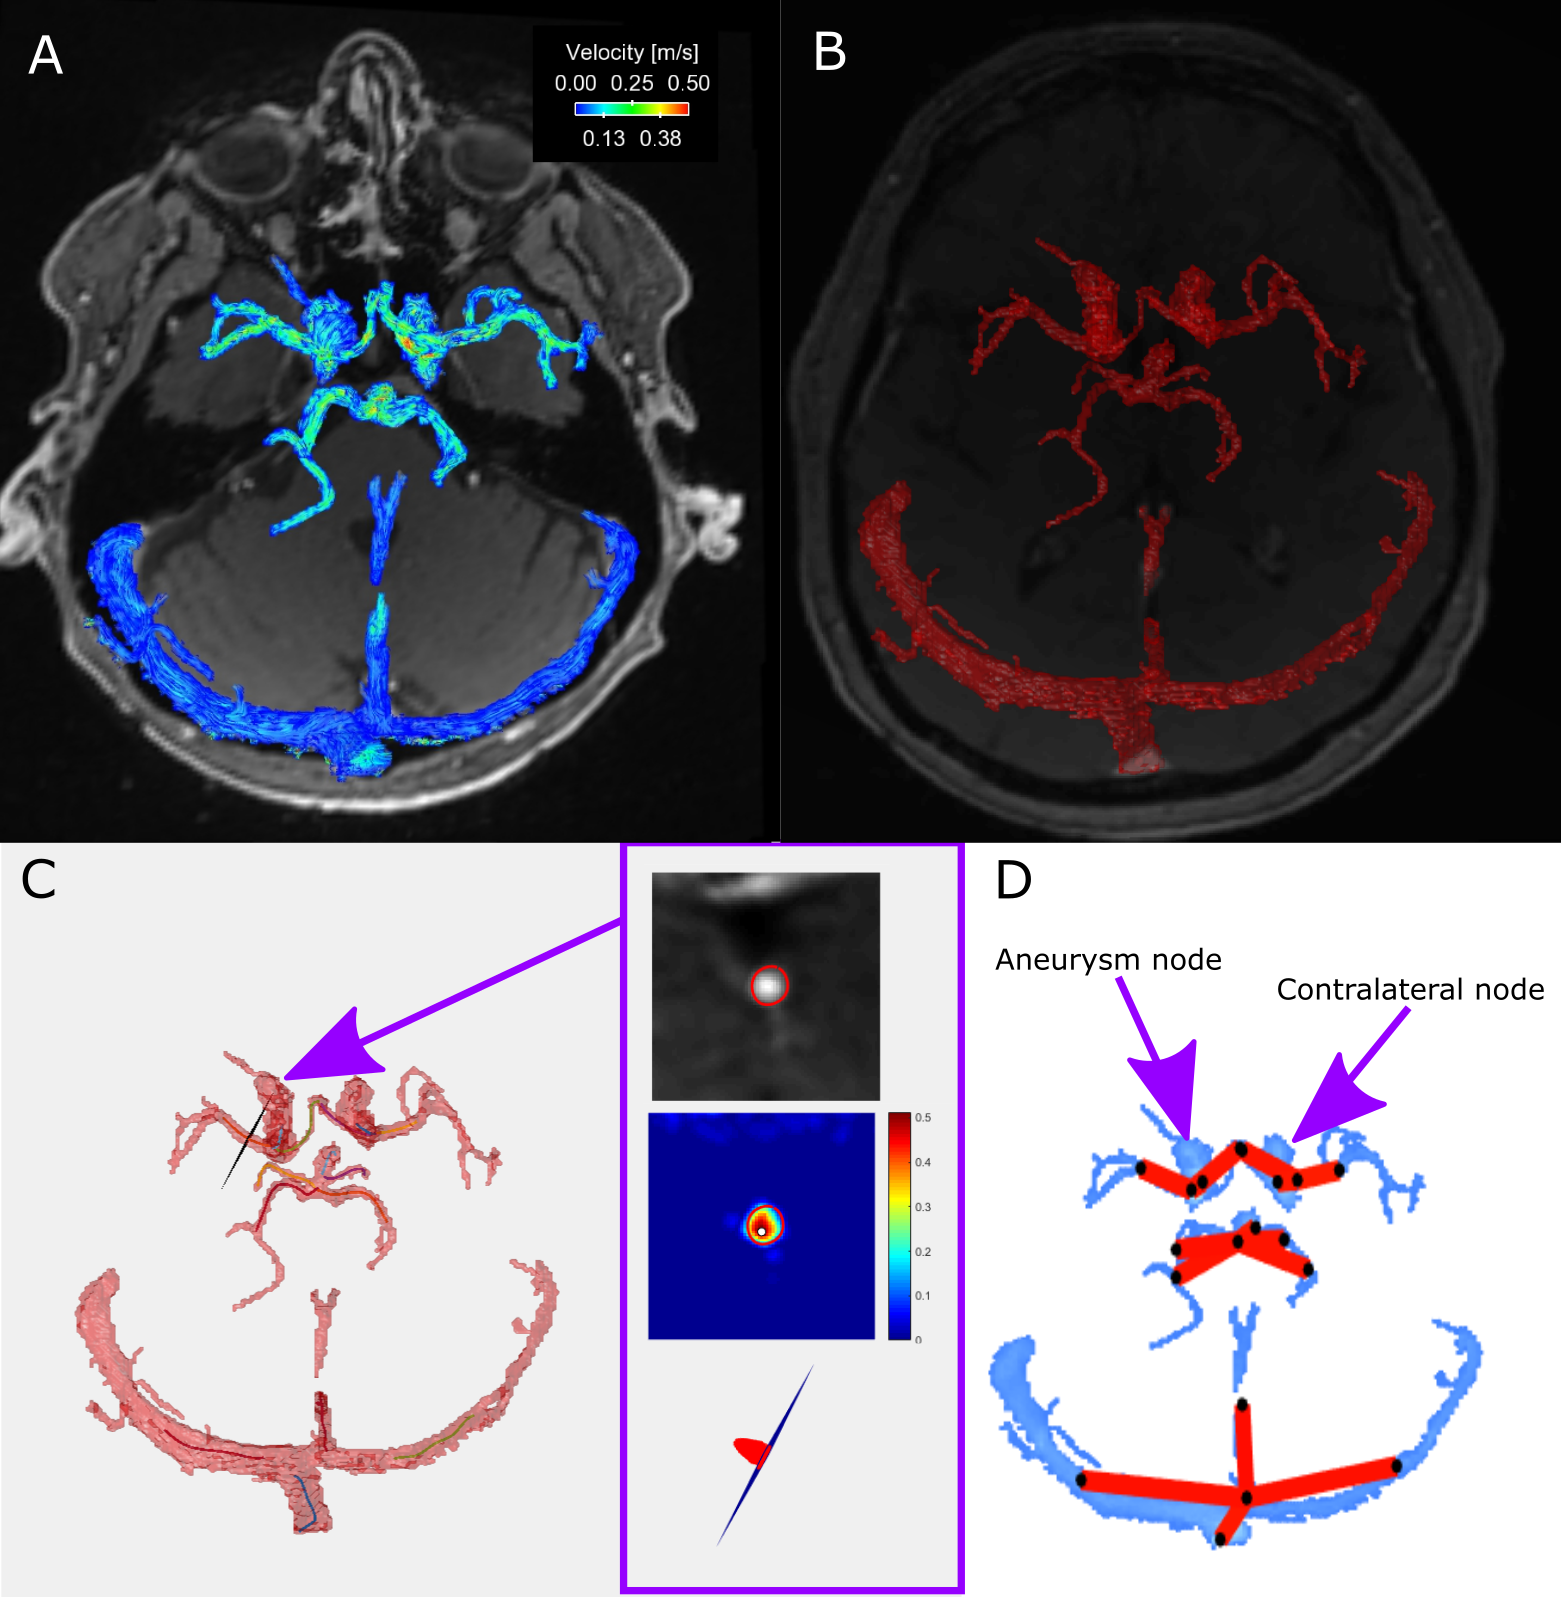
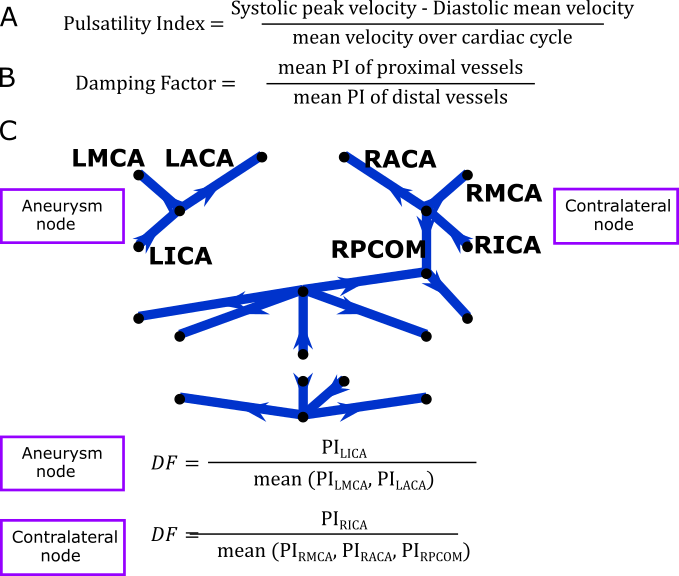
Dual-venc 4D Flow MRI was acquired in 10 intracranial aneurysm patients (age 61.6±8.8 years, 9 female, BMI 30.0±3.9 kg/m2) to obtain direct velocity measurements of blood flow in the Circle of Willis (scan parameters in Figure 1). Each subject had a distal internal carotid artery (ICA) aneurysm with normal contralateral ICA, size 4-25mm in greatest diameter, 8 saccular and irregular, 2 fusiform. The post-processing method6 consisted of segmentation of the vessel angiogram and automatic centerline identification to enable placement of evenly distributed cross-sectional analysis planes along each vessel. PI was quantified for each analysis plane and the median value was considered the PI for the vessel. Centerlines were also used to identify a network representation of the subject-specific anatomy (Figure 2). DF was calculated (Figure 3) for each junction between arteries (e.g., the “aneurysm node” and “contralateral node”). We were able to compare subjects with different underlying anatomy by using the “contralateral node” (i.e. unaffected vessel junction) as a subject-specific internal control. Based on Williams et al7 rupture risk is increased in aneurysms over 7mm, we subdivide our cohort into small (≤7mm) and large (>7mm) aneurysms. A linear model of aneurysm DF was developed based on the hypothesis that aneurysm DF depends on both systemic factors (described by contralateral DF) and local hemodynamics (influenced by size).Results
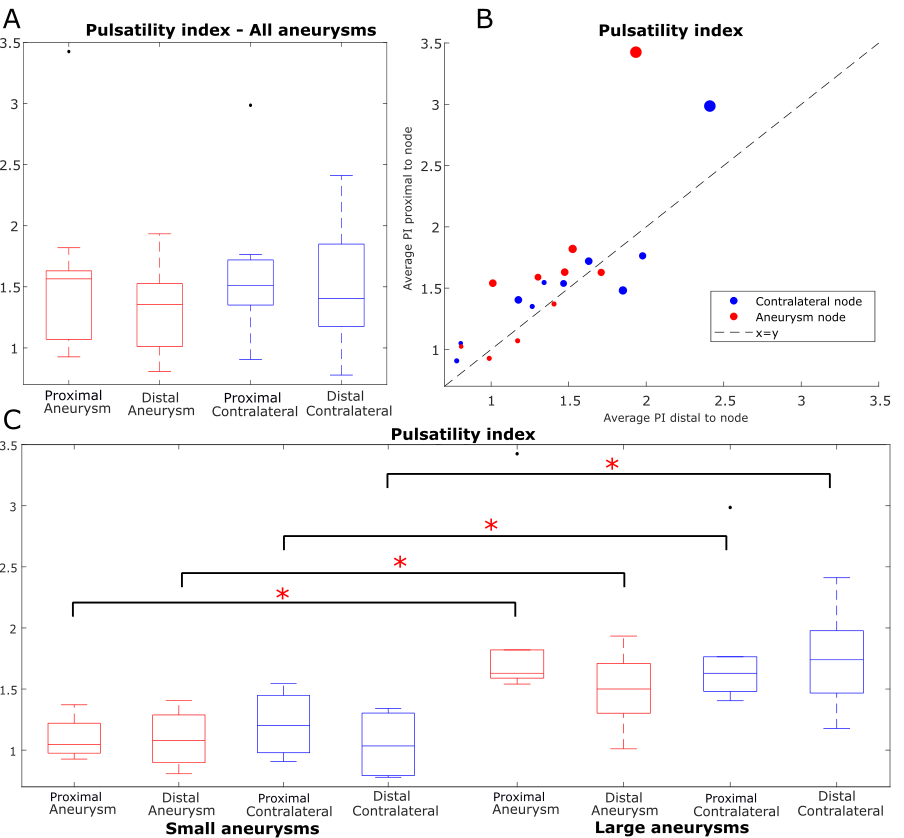
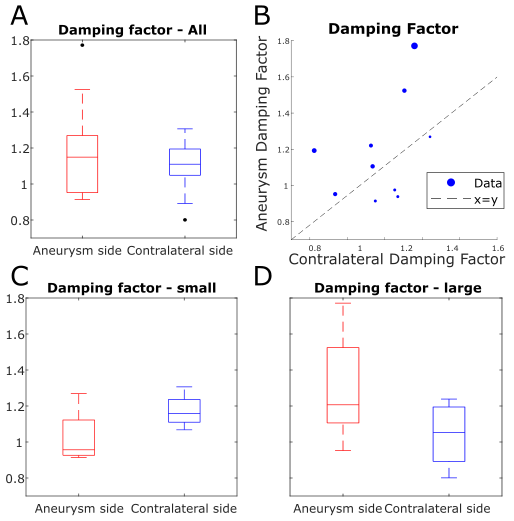
The mean PIs (Figure 4A-B) of vessels proximal and distal to nodes were 1.60 versus 1.57 for aneurysm nodes and 1.33 versus 1.47 for contralateral nodes (no significant differences by rank sum test). However, when subjects were stratified by aneurysm size, all PI values were significantly higher in subjects with large aneurysms, even PI of contralateral vessels (p = 0.005, 0.033, 0.033, 0.019 for PI proximal and distal to aneurysm and contralateral respectively, Figure 4C). When the aneurysm size was not accounted for, aneurysm DF was not significantly different from contralateral DF by signed rank test (p = 0.19, Figure 5A-B). Between-group DF differences between patients with small and large aneurysms were not significant (Figure 5D). Multivariate linear regression modeling showed a significant dependence of aneurysm DF on contralateral DF (coefficient = 0.80, p = 0.03) and aneurysm size (coefficient = 0.04 mm-1, p = 0.002, model p = 0.003; model R2 = 0.80).Discussion
Aneurysm and contralateral nodes had similar proximal and distal PI, which is expected given that both ICAs are downstream of the same pulsatile cardiac flow for a given subject. Moreover, anatomically normal contralateral nodes exhibited higher PI in patients with larger aneurysms, suggesting that other, systemic hemodynamic factors impact aneurysm patients’ vasculature outside the lesion. The coefficients of the linear regression model of DF indicate that the damping properties of aneurysms relative to the rest of the vasculature may be very different depending on aneurysm size. That is, depending on the specific contralateral DF and aneurysm size, smaller aneurysms may have lower DF than contralateral, while larger aneurysms have higher DF than contralateral.Conclusion
This study found that PI is increased in patients with large aneurysms, both at the aneurysm node and the anatomically normal contralateral node. Previous studies concluded that large aneurysms display increased damping; here we extend these findings with a multivariate linear model which suggests DF may be lower in smaller aneurysms than contralateral, but higher than contralateral in larger aneurysms. This suggests that the Windkessel properties of vessel junctions may be impacted by systemic factors such as overall vascular health of the patient. By applying dual-venc 4D flow MRI and a network-based post-processing method this effect can be characterized in a subject-specific way and compared across multiple subjects. This study was small and did not account for intra-aneurysmal flow features such as vortex formation and wall shear stress. Finally, this study is not designed to discern a mechanism for the observed relationship between aneurysm size and contralateral hemodynamics, which could be explored with post-treatment 4D Flow imaging. Future work includes expanding the study cohort for a detailed investigation of the impact of aneurysm shape and intra-aneurysmal flow patterns on the damping properties of aneurysms, correlation of these properties with clinical metrics of disease progression.Acknowledgements
NIH F30 HL140910 (Aristova)
NIH T32 GM815229 (Northwestern)
NIH R21NS106696 (Schnell)
AHA 16SDG30420005 (Schnell)
References
1. Hussein et al. Interv Neuroradiol. 2017 Aug; 23(4): 357–361. DOI: 10.1177/1591019917701100
2. Ivanov et al. J Neurosurg. 2016 Apr;124(4):1093-9. DOI: 10.3171/2015.4.JNS15134.
3. Zarrinkoob et al. J Cereb Blood Flow Metab. 2016 Sep; 36(9): 1519–1527. DOI: 10.1177/0271678X16629486
4. Schnell et al. J Cardiovasc Magn Reson. 2012; 14(Suppl 1): W2. DOI: 10.1186/1532-429X-14-S1-W2
5. Schnell et al. J Magn Reason Imaging 2017;46:102–114. DOI: 10.1002/jmri.25595
6. Aristova et al. J Magn Reason Imaging 2019; ePub DOI: 10.1002/jmri.26784
7. Williams et al. Neurol Clin Pract. 2013 Apr; 3(2): 99–108. DOI: 10.1212/CPJ.0b013e31828d9f6b
Figures