1606
Quantitation of penumbra volumes in acute ischemic stroke using susceptibility- weighted imaging and mapping1The First Teaching Hospital of Tianjin University of Traditional Chinese Medicine, Tianjin, China, 2Shanghai Fourth People’s Hospital, Shanghai, China, 3Translational Research Institute of Brain and Brain-Like Intelligence, Shanghai Fourth People’s Hospital Affiliated to Tongji University School of Medicine, Shanghai, China, 4Wayne State University, Detroit, MI, United States, 5Zhengzhou University People’s Hospital, Zhengzhou, China, 6Tianjin First Central Hospital, Tianjin, China, 7Third Central Hospital of Tianjin, Tianjin, China, 8Siemens Healthcare Ltd, Beijing, China
Synopsis
This study aimed to measure ischemic penumbra volumes using susceptibility-weighted imaging and mapping (SWIM). We compared the diagnostic accuracy between SWIvolume-diffusion-weighted imaging (DWI) and SWIASPECTS-DWI mismatches and analyzed the relationships among the SWIvolume-DWI, SWIASPECTS-DWI, and PWI-DWI mismatches and the different parameters and NIHSS. We found that quantitative SWIvolume-DWI mismatch volumes were more accurate than those of the SWIASPECTS-DWI mismatch in being able to evaluate ischemic penumbra. The asymmetrical prominent cortical vein volumes using SWIM showed hypoperfused regions and Tmax >6s volumes, based on perfusion-weighted imaging (PWI). The quantitative SWIvolume-DWI mismatch was highly consistent with the PWI-DWI mismatch.
Introduction
The diagnosis and treatment of acute ischemic stroke is mainly based on the estimation of the ischemic penumbra as defined by MRI.1 Early and accurate delineation of ischemic penumbras is critical for treatment strategies, including thrombolytic therapy, and long-term patient management.2 Mismatches between perfusion-weighted imaging (PWI) and diffusion-weighted imaging (DWI) have been used to detect ischemic penumbras and provide a useful tool in the clinical treatment of strokes.3-6 However, there are only a few reports quantitating penumbra volumes in acute ischemic stroke. Asymmetrical prominent cortical veins (APCVs) are associated with ischemic penumbras; however, they have not been used to assess penumbras quantitatively. We aimed to quantitate ischemic penumbra volumes using susceptibility-weighted imaging and mapping (SWIM) of APCVs in patients with acute ischemic stroke.Methods
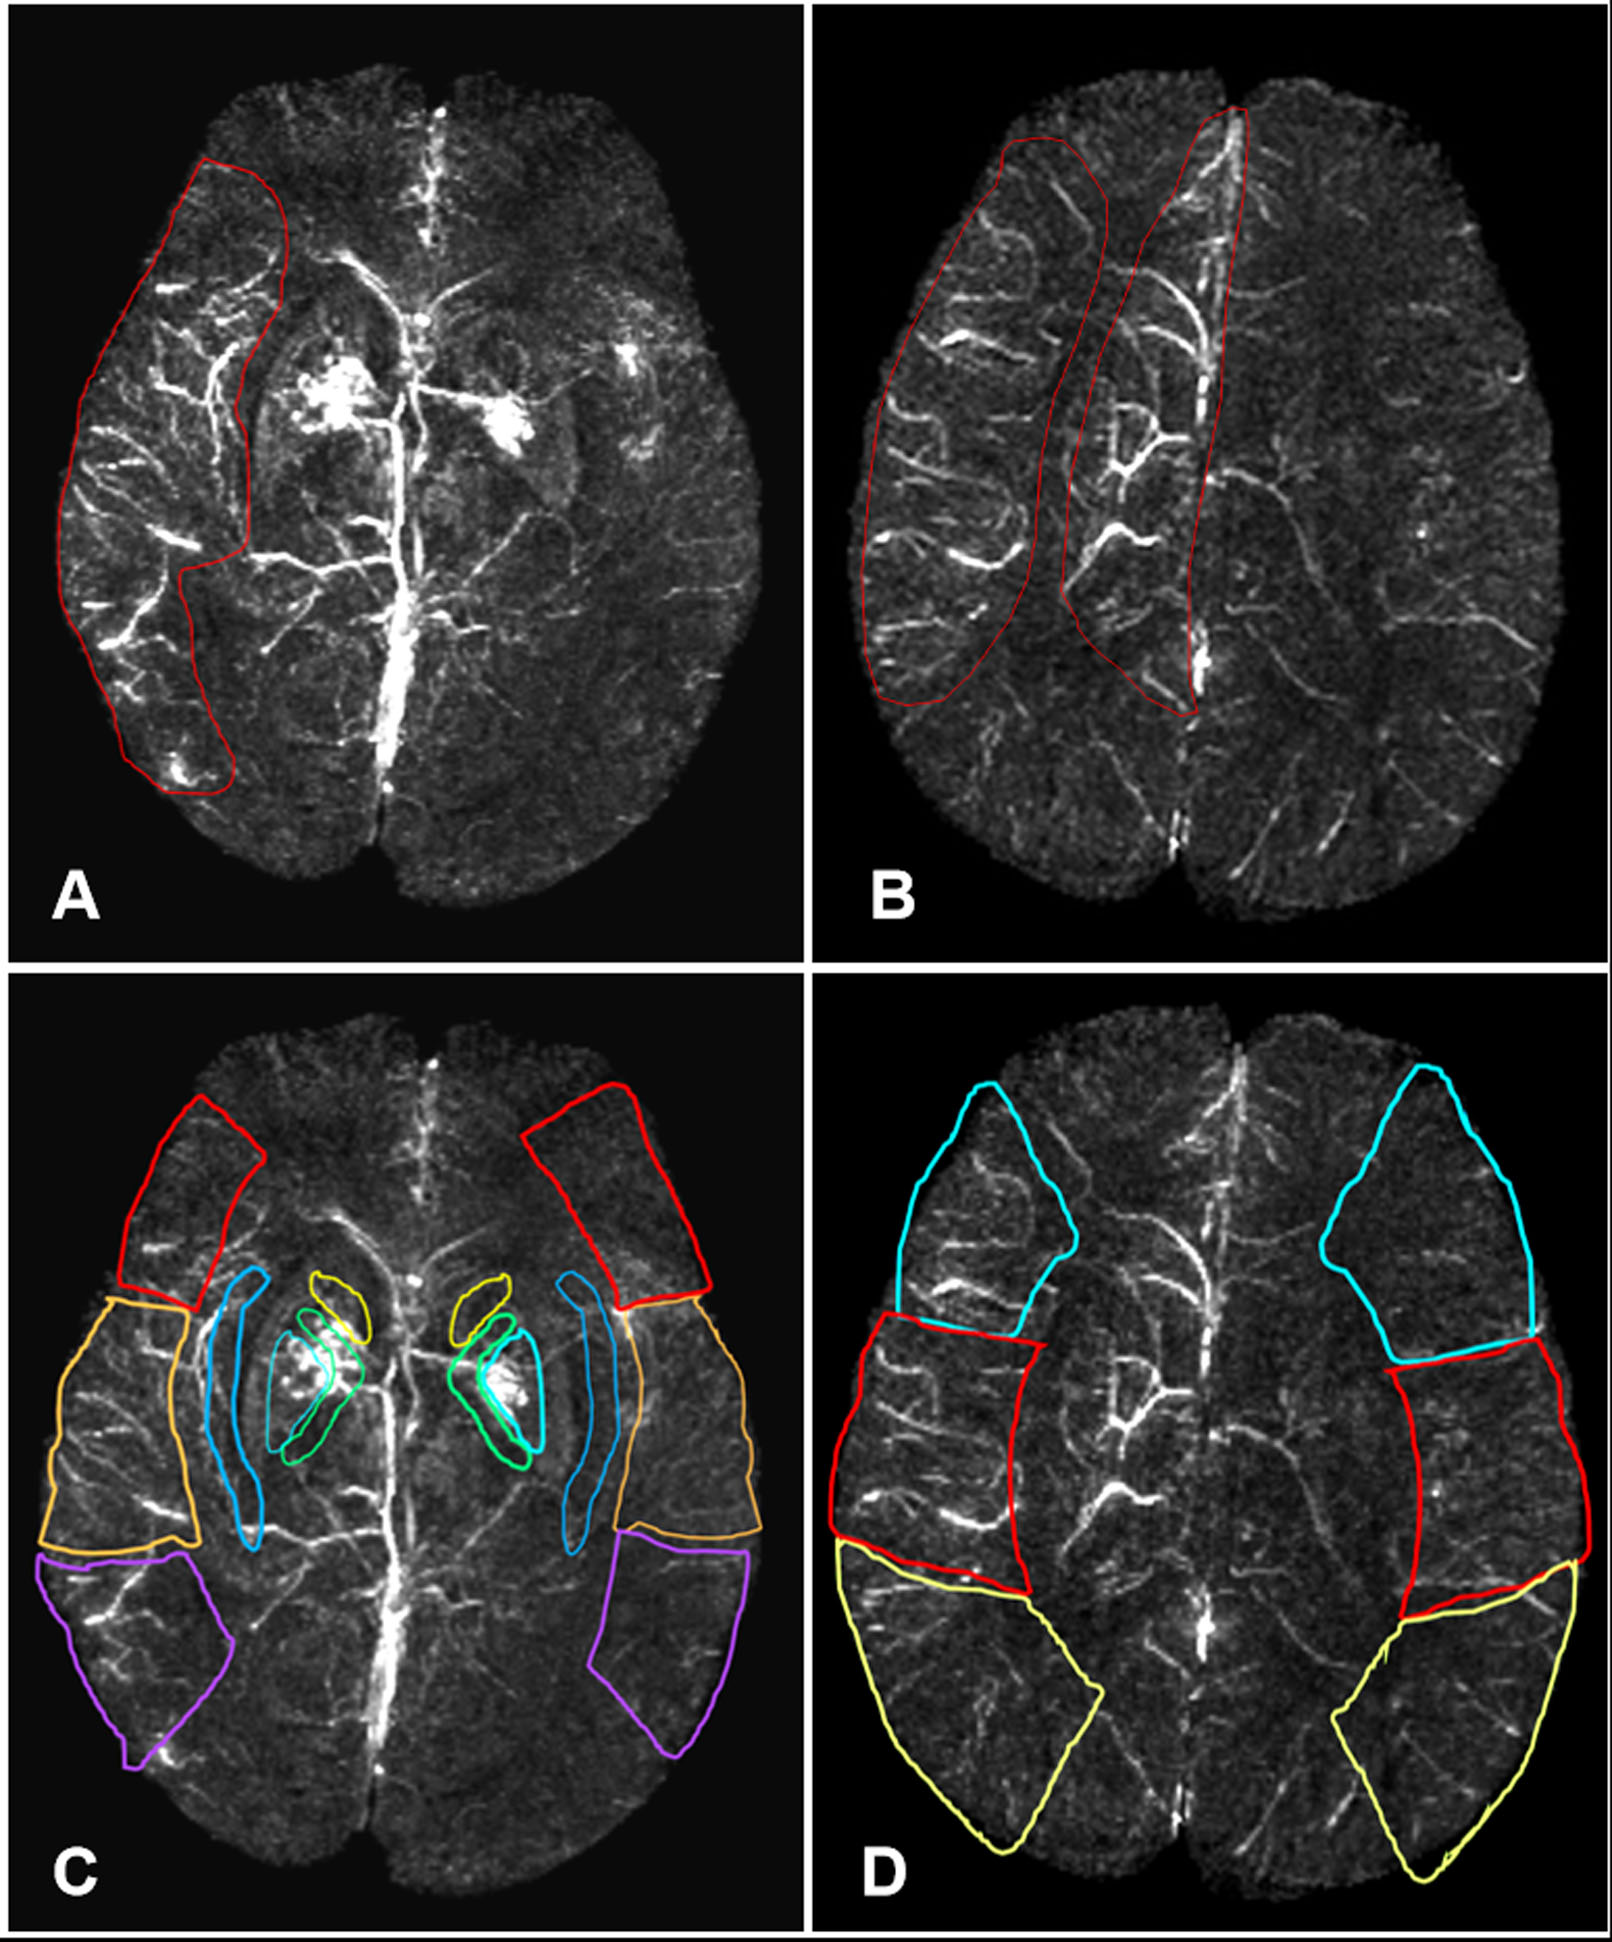
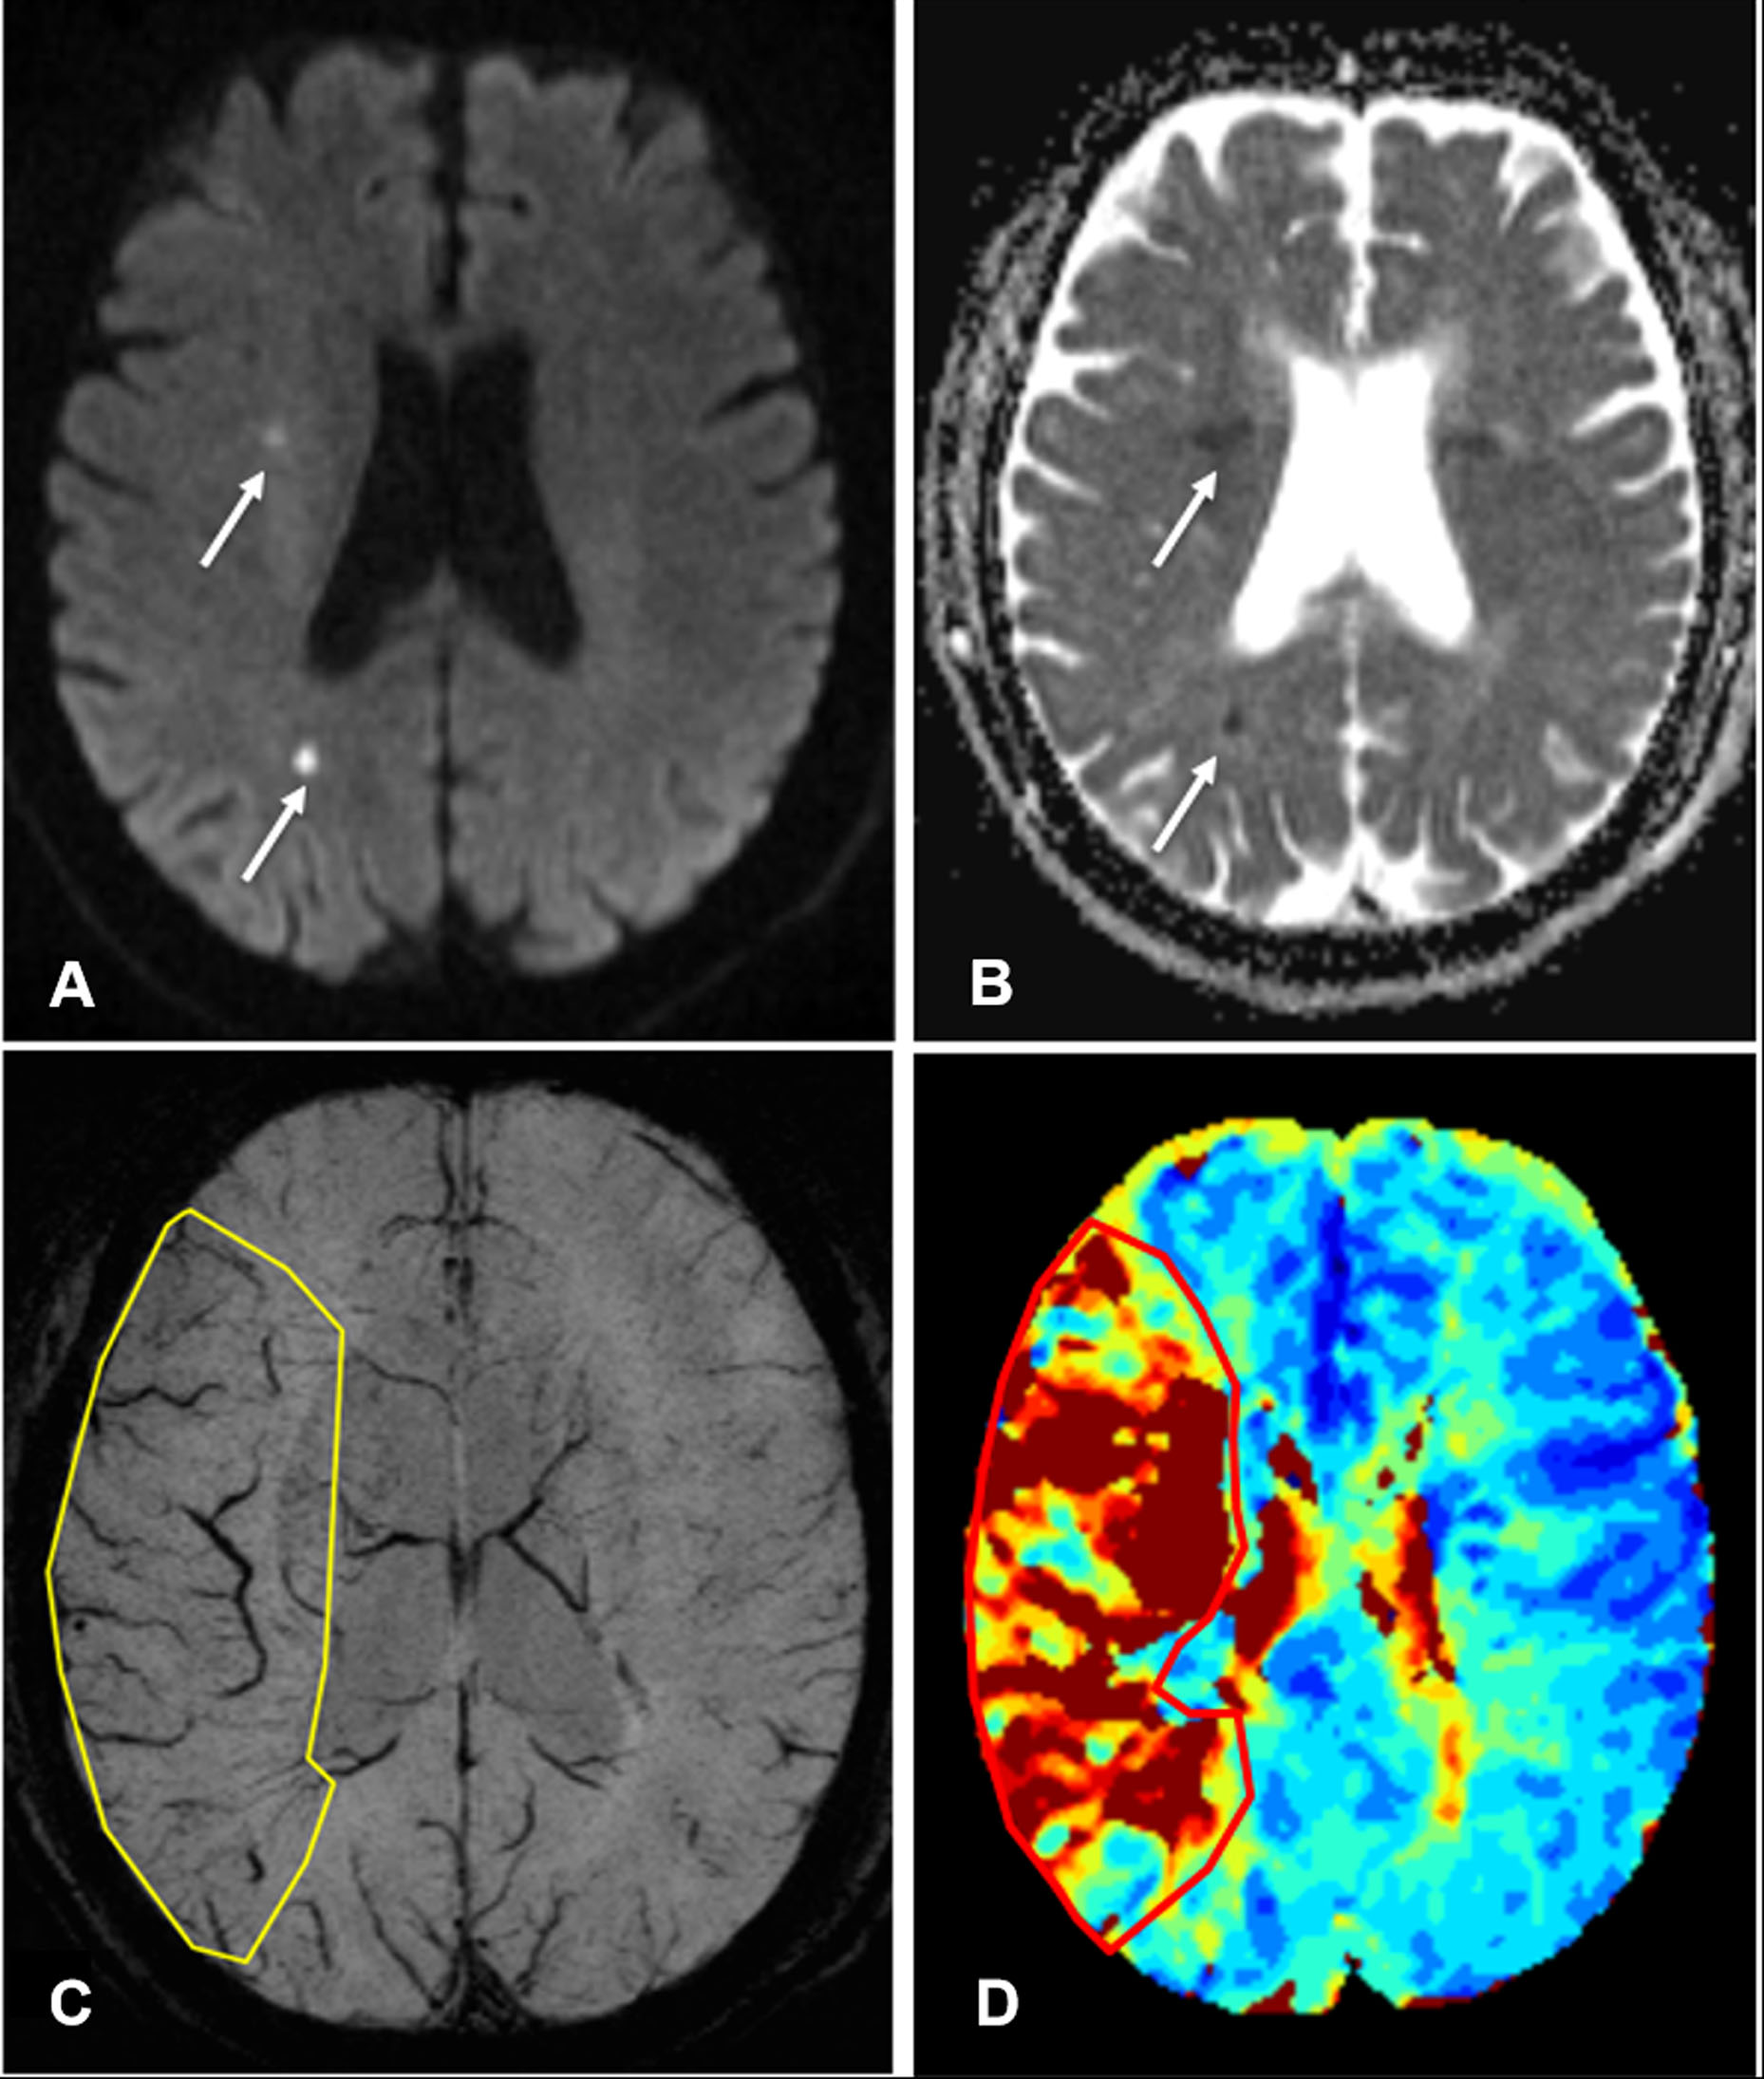
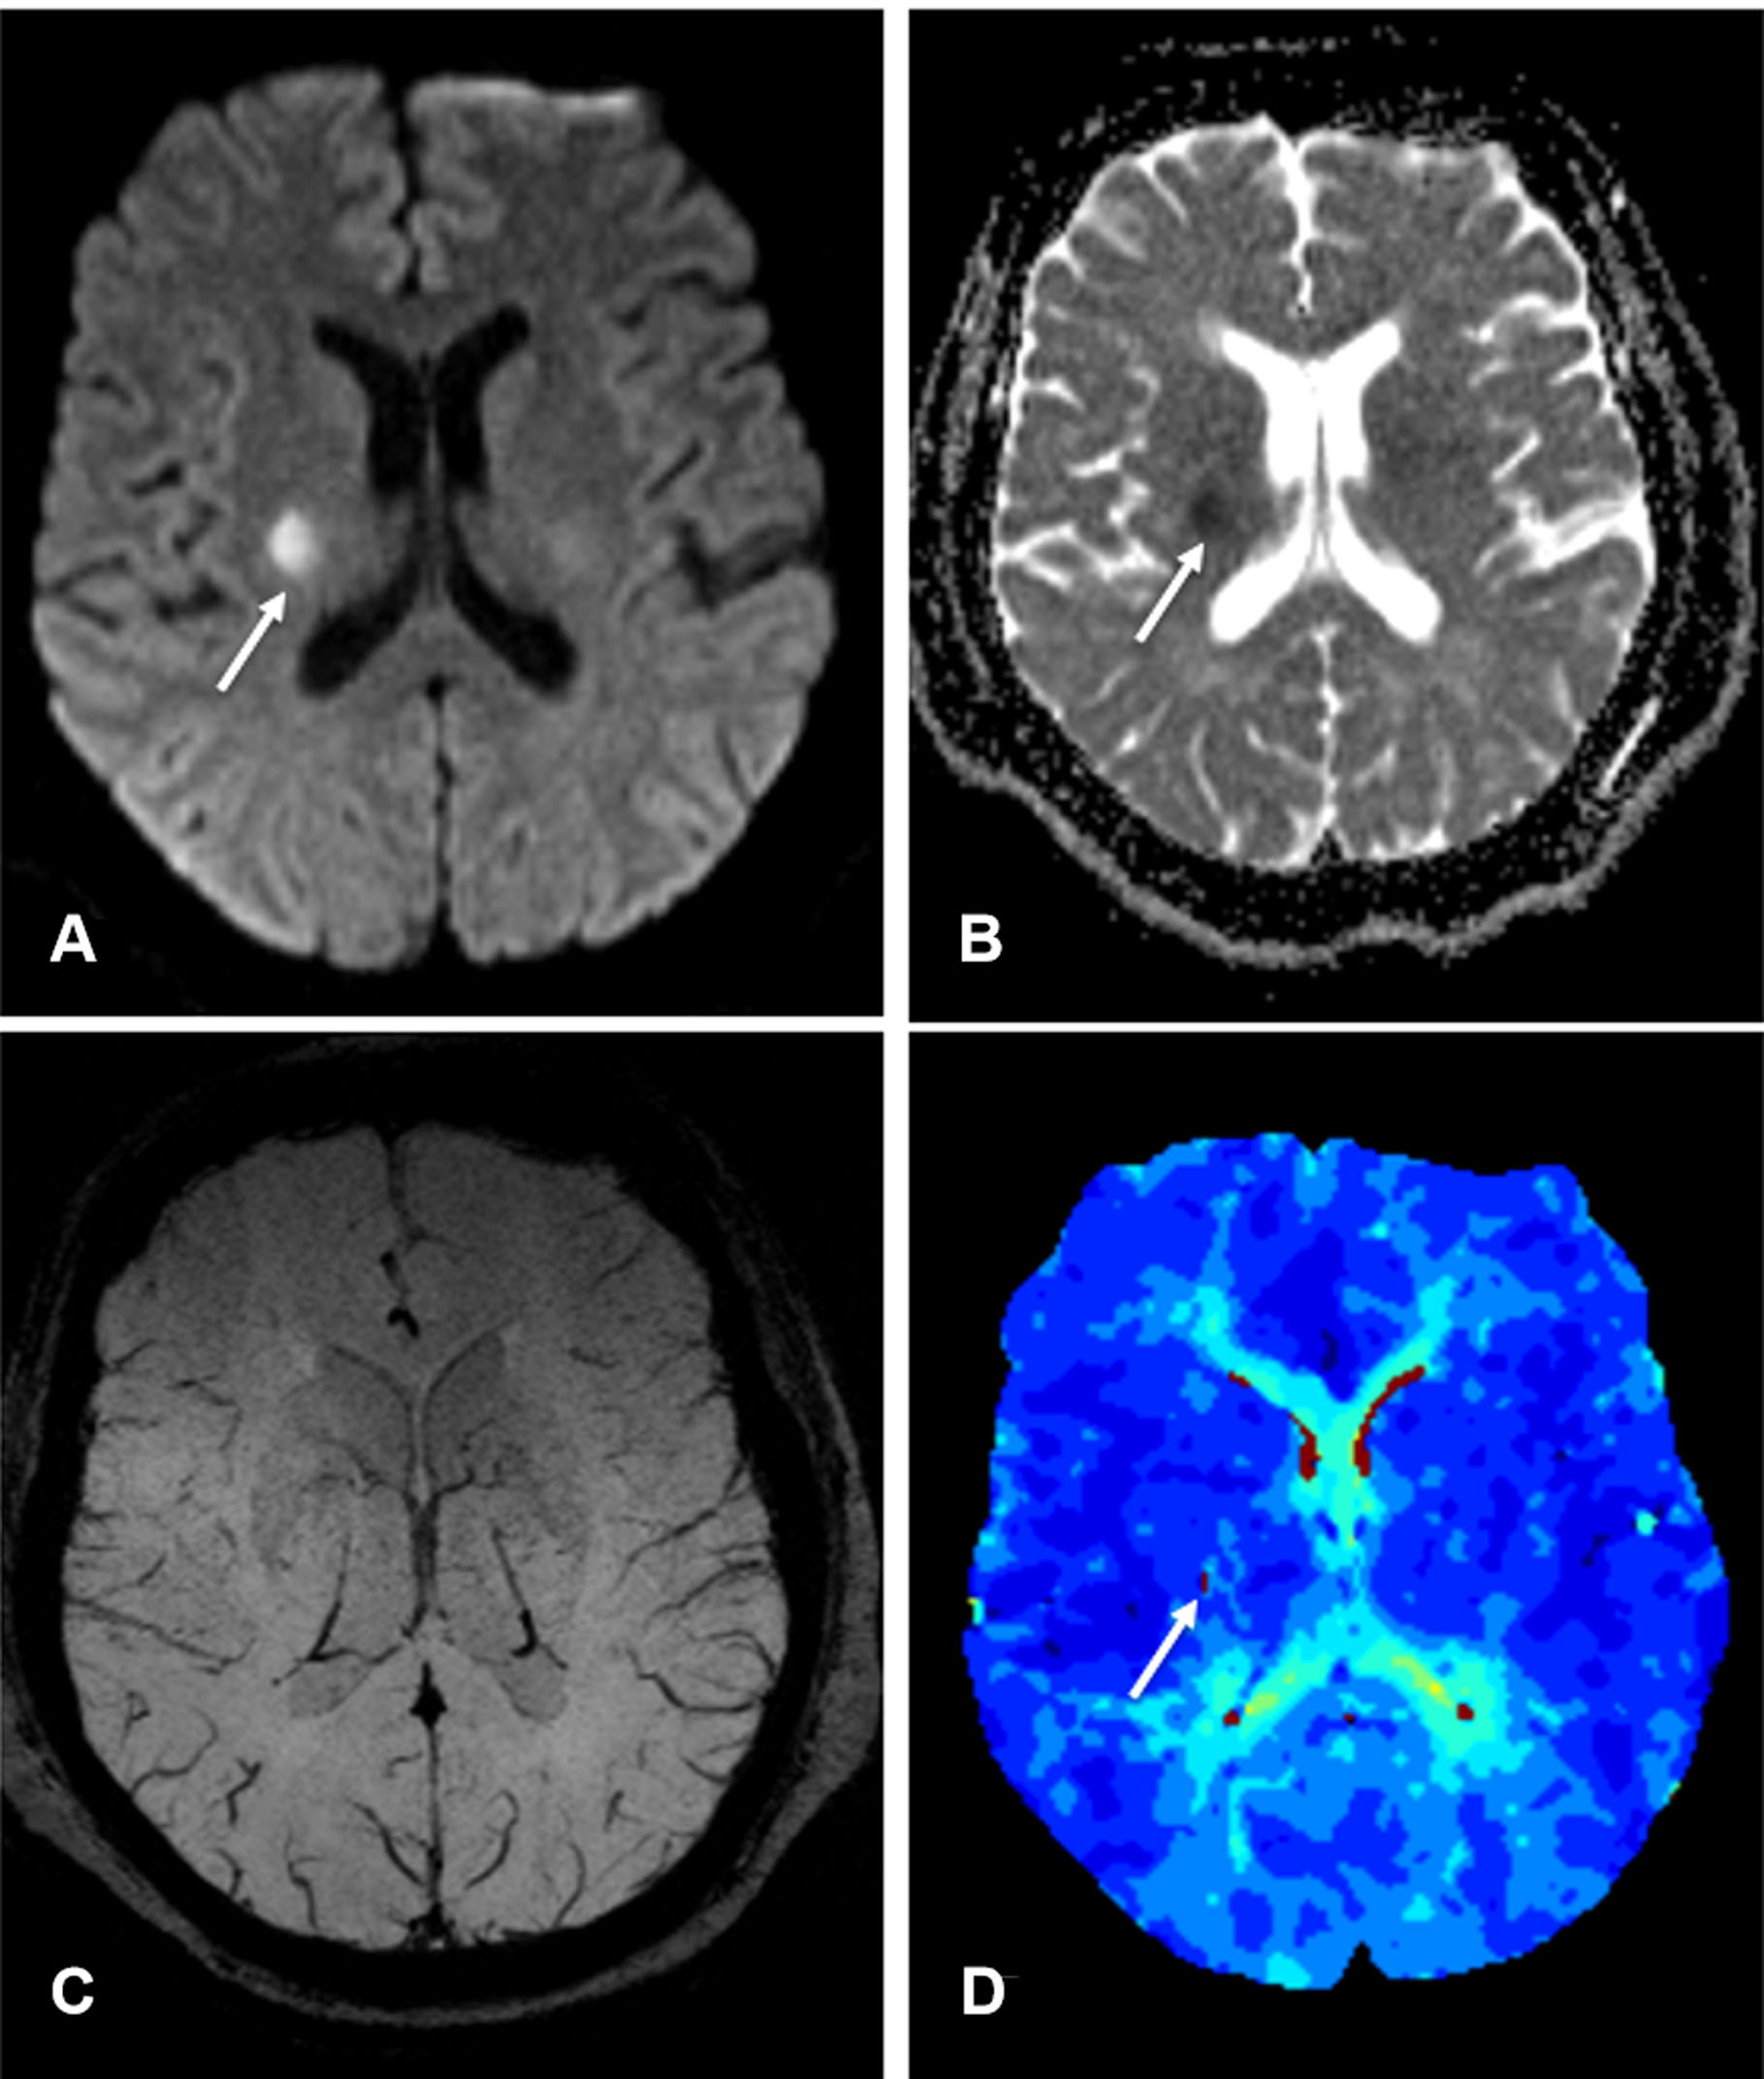
A retrospective analysis was performed in 41 eligible patients(33 male and 8 female; mean age, 73 years; range, 52–94 years)with acute ischemic stroke who had MRI data, APCVs on susceptibility-weighted imaging (SWI), and perfusion-diffusion-weighted imaging (PWI-DWI) mismatches available before treatment and within 12 hours of symptom onset. All MRIs were completed on a 1.5T scanner (MAGNETOM Avanto, Siemens Healthcare, Erlangen, Germany) using a standard 20-channel head coil. The scan protocols for each patient included T1WI, T2WI, FLAIR, DWI, TOF-MRA, SWI, and PWI. The APCVs were quantitatively (SWIvolume), and semi-quantitatively (SWI-Alberta Stroke Program Early CT Score, SWIASPECTS) evaluated to calculate mismatches. To assess the diagnostic accuracy of APCVs on SWIM, comparative analyses were performed between the SWIvolume-DWI and SWIASPECTS-DWI mismatches, using the PWI-DWI mismatches as a reference. Correlations were calculated between the SWIvolume-DWI and PWI-DWI mismatches, between the SWI-volume and Time-to-maximum(Tmax) >6s volume, as well as between SWIASPECTS-DWI and PWI-DWI mismatches. Additionally, each of these mismatches was correlated with the National Institute of Health Stroke Scale (NIHSS).Results
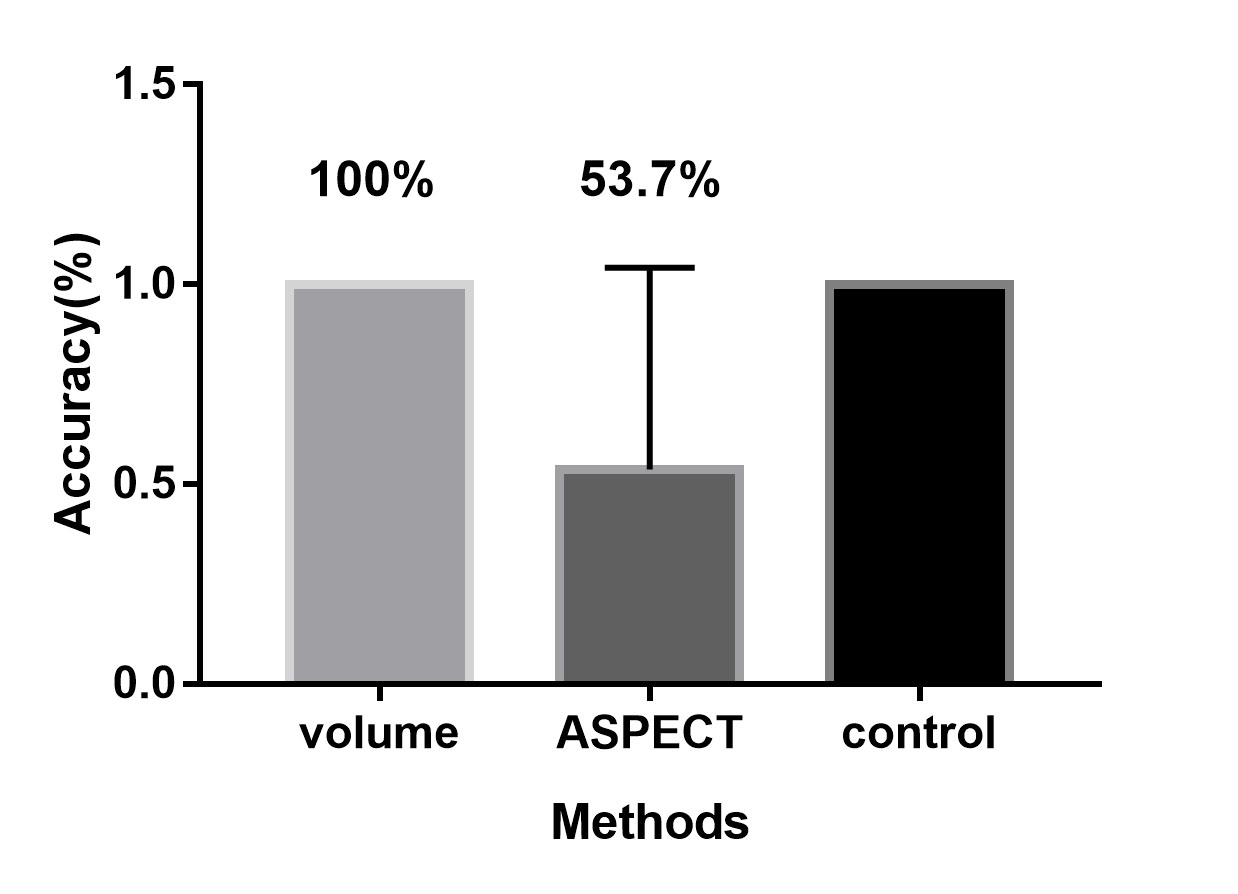
We first compared the diagnostic accuracy of the SWIvolume-DWI mismatch vs. the SWIASPECTS-DWI mismatch in being able to detect ischemic penumbras. Ischemic penumbras were identified in all 41 patients with the SWIvolume-DWI mismatch, whereas these areas were only identified in 22 patients with the SWIASPECTS-DWI mismatch (100% vs. 53.7%). Next, we analyzed the relationships among SWIvolume-DWI, SWIASPECTS-DWI, and PWI-DWI mismatches. A significant positive correlation was found between the SWIvolume-DWI and PWI-DWI mismatches (r=0.691, p<0.01), as well as between the SWI-volume and Tmax>6s volume (r=0.766, p<0.001), while no significant correlation was found between the SWIASPECTS-DWI and PWI-DWI mismatches (p>0.05). Finally, we analyzed the relationships among the SWIvolume-DWI, SWIASPECTS-DWI, PWI-DWI mismatches, and the NIHSS. A significant negative correlation was found between the SWIvolume-DWI mismatches and the NIHSS (r=-0.360, p=0.022) and between the SWIASPECTS-DWI mismatches and the NIHSS (r=-0.499, p=0.001).Discussion and Conclusion
Previous studies indicated that SWI could provide an alternative to PWI to assess penumbras and predict stroke progression.7, 8 Other studies had proposed that APCVs in ischemic areas represented salvageable tissue.9, 10 Using the ASPECTS to calculate DWI-SWI and DWI-PWI mismatches, Luo et. al11 found that the DWI-SWI mismatch was valuable for detecting ischemic penumbra in stroke patients with cerebral infarctions. While the ASPECTS has been widely used, it is a semi-quantitative indicator and does not accurately measure lesion volumes. In this study, we measured APCV volumes using SWIM and found these volumes to be in good agreement with Tmax >6s volumes on PWI, which demonstrated that APCV volumes could indicate the size of hyperperfused areas and Tmax >6s volumes, and that these measurements could more accurately delineate ischemic penumbras compared with the ASPECTS. APCVs can also occur in the medulla and cerebral cortex; however, the ASPECTS only indicates the extent of cortical infarction. Because of this, volumetric APCV measurements using SWIM could provide a more accurate and broadly applicable tool for defining ischemic penumbras. Using the PWI-DWI mismatch criteria to calculate SWIvolume-DWI mismatches, the present study showed significant positive correlations between the SWIvolume-DWI and PWI-DWI mismatches, which were consistent with previously published research.11,8-10 In conclusion, The SWIvolume-DWI mismatch is more accurate than the SWIASPECTS-DWI mismatch in being able to define ischemic penumbra and provides an alternative to PWI-DWI mismatches for the management of acute ischemic stroke cases. APCV volume quantifications using SWIM provides an accurate method to determine hypoperfused areas.Acknowledgements
This work is supported by the Natural Scientific Foundation of China (grant number 81871342 to Shuang Xia; grant number 81971590 to Yu Luo; grant number 81901728 to Chao Chai), Shanghai Health Bureau Science and Research Projects Foundation (grant number 201740137 to Yu Luo).References
- Astrup J, Siesjo BK, Symon L. Thresholds in cerebral ischemia-the ischemic penumbra. Stroke. 1981;12:723-5.
- Copen WA, Schaefer PW, Wu O. MR perfusion imaging in acute ischemic stroke. Neuroimaging Clin N Am. 2011;21:259-83.
- Schlaug G, Benfield A, Baird AE, Siewert B, Lövblad KO, Parker RA, et al. The ischemic penumbra: operationally defined by diffusion and perfusion MRI. Neurology. 1999; 53:1528-37.
- Albers GW, Thijs VN, Wechsler L, Kemp S, Schlaug G, Skalabrin E, et al. Magnetic resonance imaging profiles predict clinical response to early reperfusion: the diffusion and perfusion imaging evaluation for understanding stroke evolution (DEFUSE) study. Ann Neurol. 2006;60:508-17.
- Hjort N, Butcher K, Davis SM, Kidwell CS, Koroshetz WJ, Röther J, et al. Magnetic resonance imaging criteria for thrombolysis in acute cerebral infarct. Stroke. 2005; 36:388-97.
- Davis SM, Donnan GA, Parsons MW, Levi C, Butcher KS, Peeters A, et al. Effects of alteplase beyond 3 h after stroke in the echo planar imaging thrombolytic evaluation trial (EPITHET): a placebo-controlled randomised trial. Lancet Neurol. 2008;7:299-309.
- Kao HW, Tsai FY, Hasso AN. Predicting stroke evolution: comparison of susceptibility-weighted MR imaging with MR perfusion. Eur Radiol. 2012;22:1397-403.
- Viallon M, Altrichter S, Pereira VM, Nguyen D, Sekoranja L, Federspiel A, et al. Combined use of pulsed arterial spin-labeling and susceptibility-weighted imaging in stroke at 3T. Eur Neurol. 2010;64:286-96.
- Kesavadas C, Thomas B, Pendharakar H, Sylaja PN. Susceptibility weighted imaging: does it give information similar to perfusion weighted imaging in acute stroke? J Neurol. 2011;258:932-4.
- Huang P, Chen CH, Lin WC, Lin RT, Khor GT, Liu CK. Clinical applications of susceptibility weighted imaging in patients with major stroke. J Neurol. 2012;259:1426-32.
- Kao HW, Tsai FY, Hasso AN. Predicting stroke evolution: comparison of susceptibility-weighted MR imaging with MR perfusion. Eur Radiol. 2012;22:1397-403.
Figures