1602
Combination of Plaque Characteristics and Hemodynamics Predicts Neurological Impairment in Infarction and TIA Patients1Radiology Department, Tianjin Huanhu Hospital, Tianjin, China, 2Radiology Department, Beijing Friendship Hospital, Capital Medical University, Beijing, China, 3Radiology Department, Shanghai Fourth People's Hospital, Shanghai, China, 4Tianjin Huanhu Hospital, Tianjin, China, 5Tianjin First Central Hospital, Tianjin, China
Synopsis
Ischemic stroke is the second frequent cause of death worldwide. Some patients have transient symptoms of neurological defect without parenchymal damage, irreversible cerebral tissue injury happens in someone else. How to discriminate TIA from acute stroke needs further study. This study uses muti-modal MRI scaning to investigate the difference of plaque characteristics in Middle Cerebral Artery (MCA) between patients with infarction and transient ischemic attack (TIA), and to explore the predictive model for infarction region and neurological impairment.
Purpose
Ischemic stroke is the second frequent cause of death worldwide. Some patients have transient symptoms of neurological defect without parenchymal damage, irreversible cerebral tissue injury happens in someone else. How to discriminate TIA from acute stroke needs further study. This study uses muti-modal MRI scaning to investigate the difference of plaque characteristics in Middle Cerebral Artery (MCA) between patients with infarction and transient ischemic attack (TIA), and to explore the predictive model for infarction region and neurological impairment.Materials and Methods
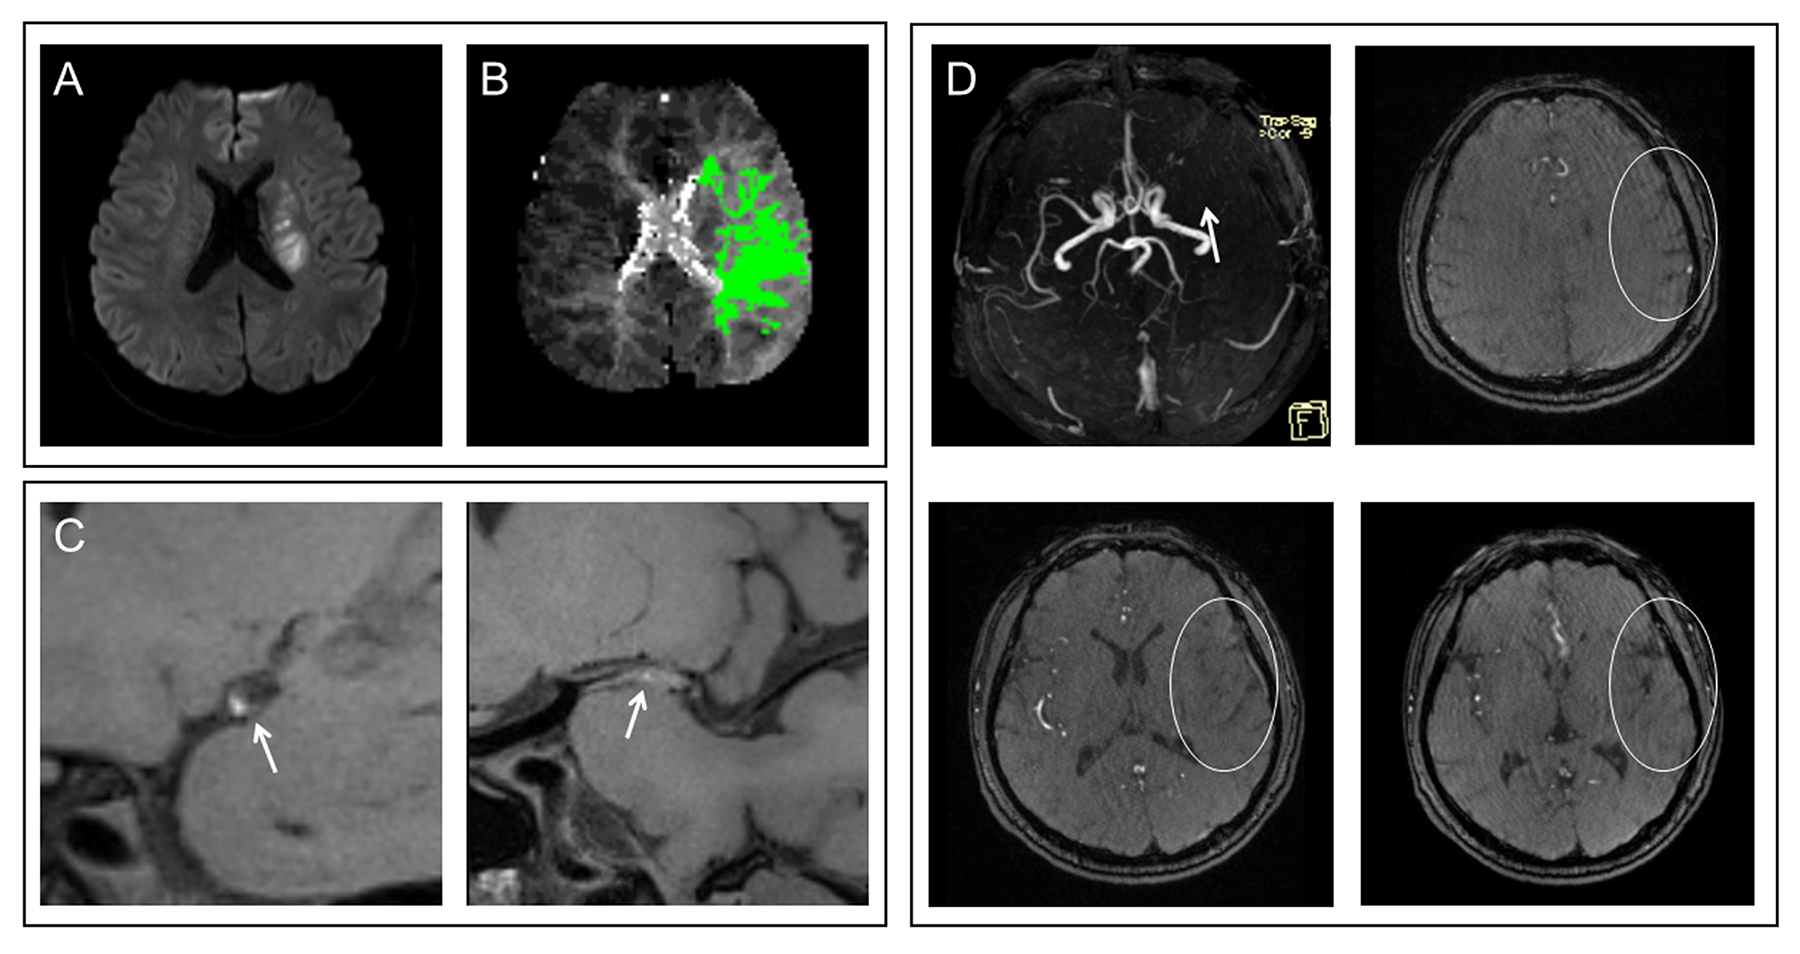
In this retrospective study, 67 patients with acute ischemic events in MCA territory who underwent high-resolution vessel wall imaging between September 2016 and August 2018 were reviewed. Patients were assigned to either the infarction group or the TIA group, according to diffusion-weighted imaging (DWI) and neurological examination. Among the 67 patients included in the study, 45 were categorized as infarction patients and 22 as TIA patients.MRI scans of patients were obtained on a 3T MRI System (MAGNETOM Prisma, Siemens Healthcare, Erlangen, Germany) using a 64-channel head-neck coil. All patients underwent follows sequence, including DWI, TOF-MRA, IR-SPACE, and DSC-PWI. The parameters of the IR-SPACE were as follows: TR/TE=900/14 ms; field of view = 210 × 164 mm2; matrix size = 384 × 300; and slice thickness = 0.55 mm. The IR-SPACE were acquired before and after contrast agent injection. The parameters of DSC-PWI acquisition were as follows: TR/TE = 2210/32 ms; field of view = 230 × 230 mm2; matrix size = 128 × 128; and slice thickness = 3.0 mm. The DSC-PWI was scanned with intravenous injection of gadolinium-based contrast agent at third frame (a rate of 4 ml/s with a dose of 0.2 mmol/kg and a saline flush).The plaque characteristics, such as vessel wall area, lumen area, wall area, stenosis percentage, normalized wall index, arterial remodeling pattern, plaque length, configuration and enhanced behavior. PCs were assessed on the raw axial images of TOF-MRA using a method proposed by Yuan et al [5]. A semi-quantitative limited diffusion evaluation known as DWI-ASPECTS was assessed [6]. Rapid processing of perfusion and diffusion (RAPID, Stanford University, USA) was used to compute Tmax maps from DSC-MRI[7]. Independent sample t test, Mann-Whitney U test, Chi-square test and Fisher’s exact test were performed in the difference of plaque characteristics, PCs and Tmax>6.0 s volume between infarction group and TIA group. Multivariate logistic regression analysis and receiver operating characteristic (ROC) curve and multiple linear regression analysis were performed to find the variables affecting the DWI and NIHSS.Results
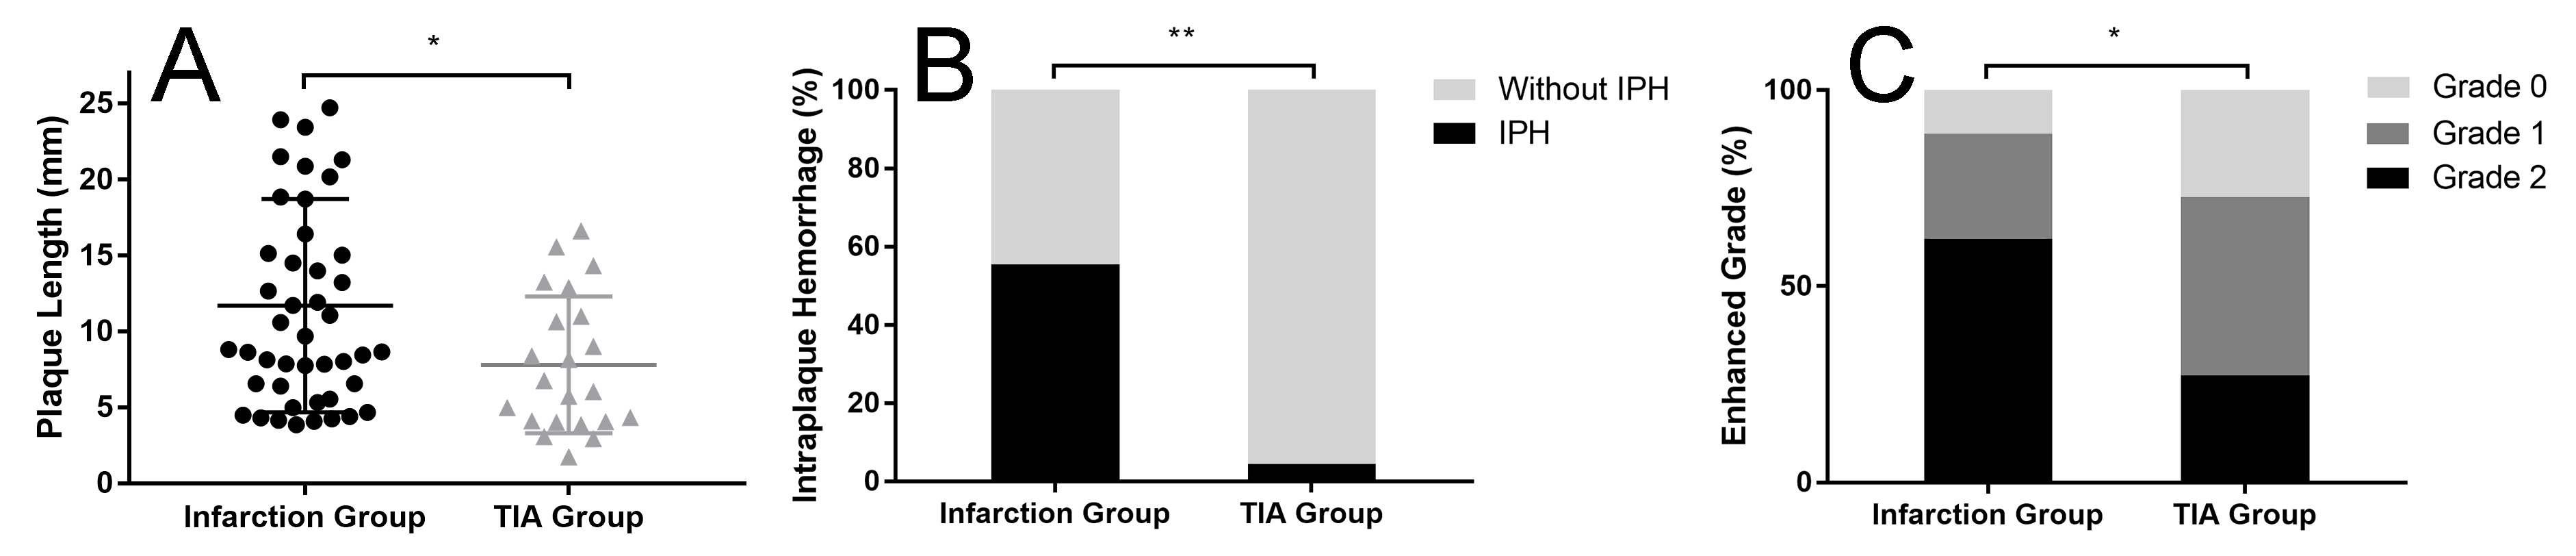
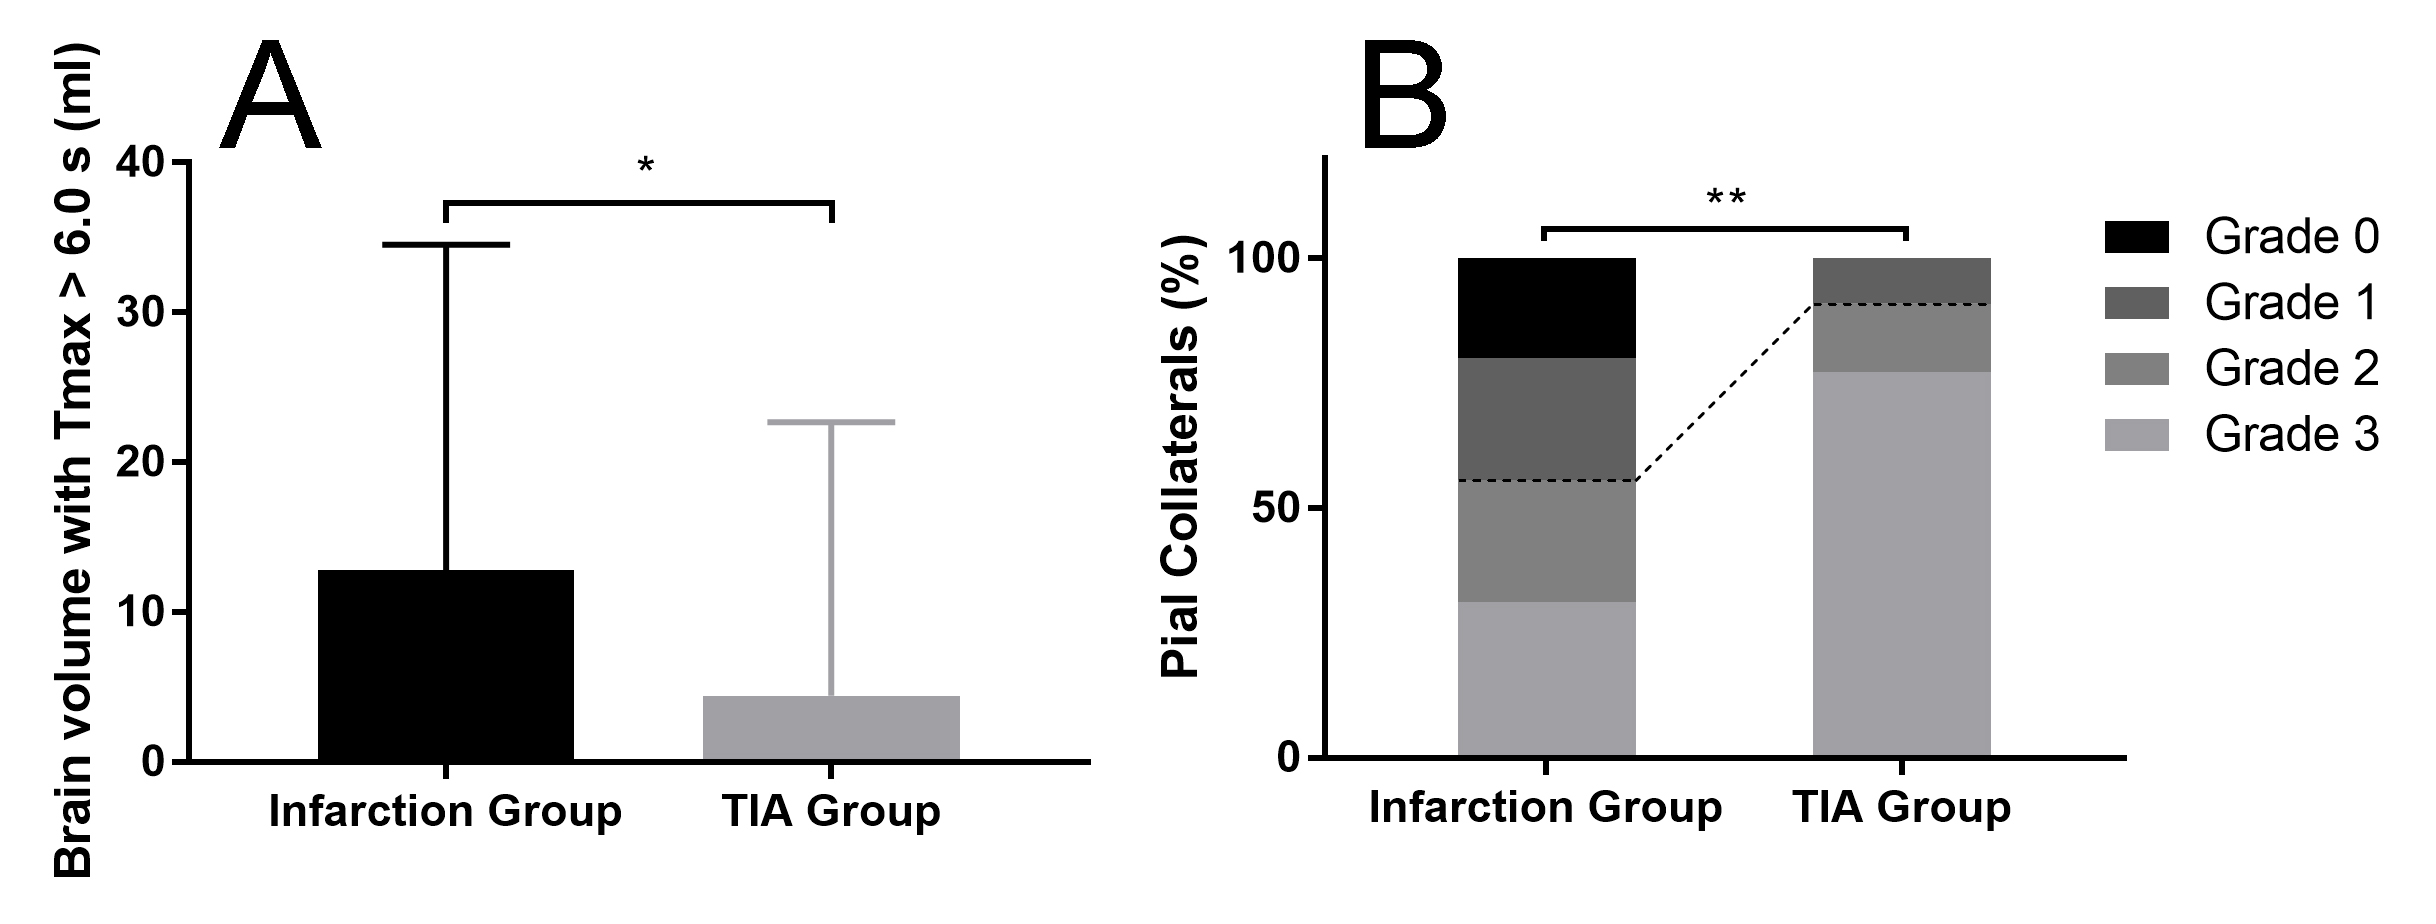
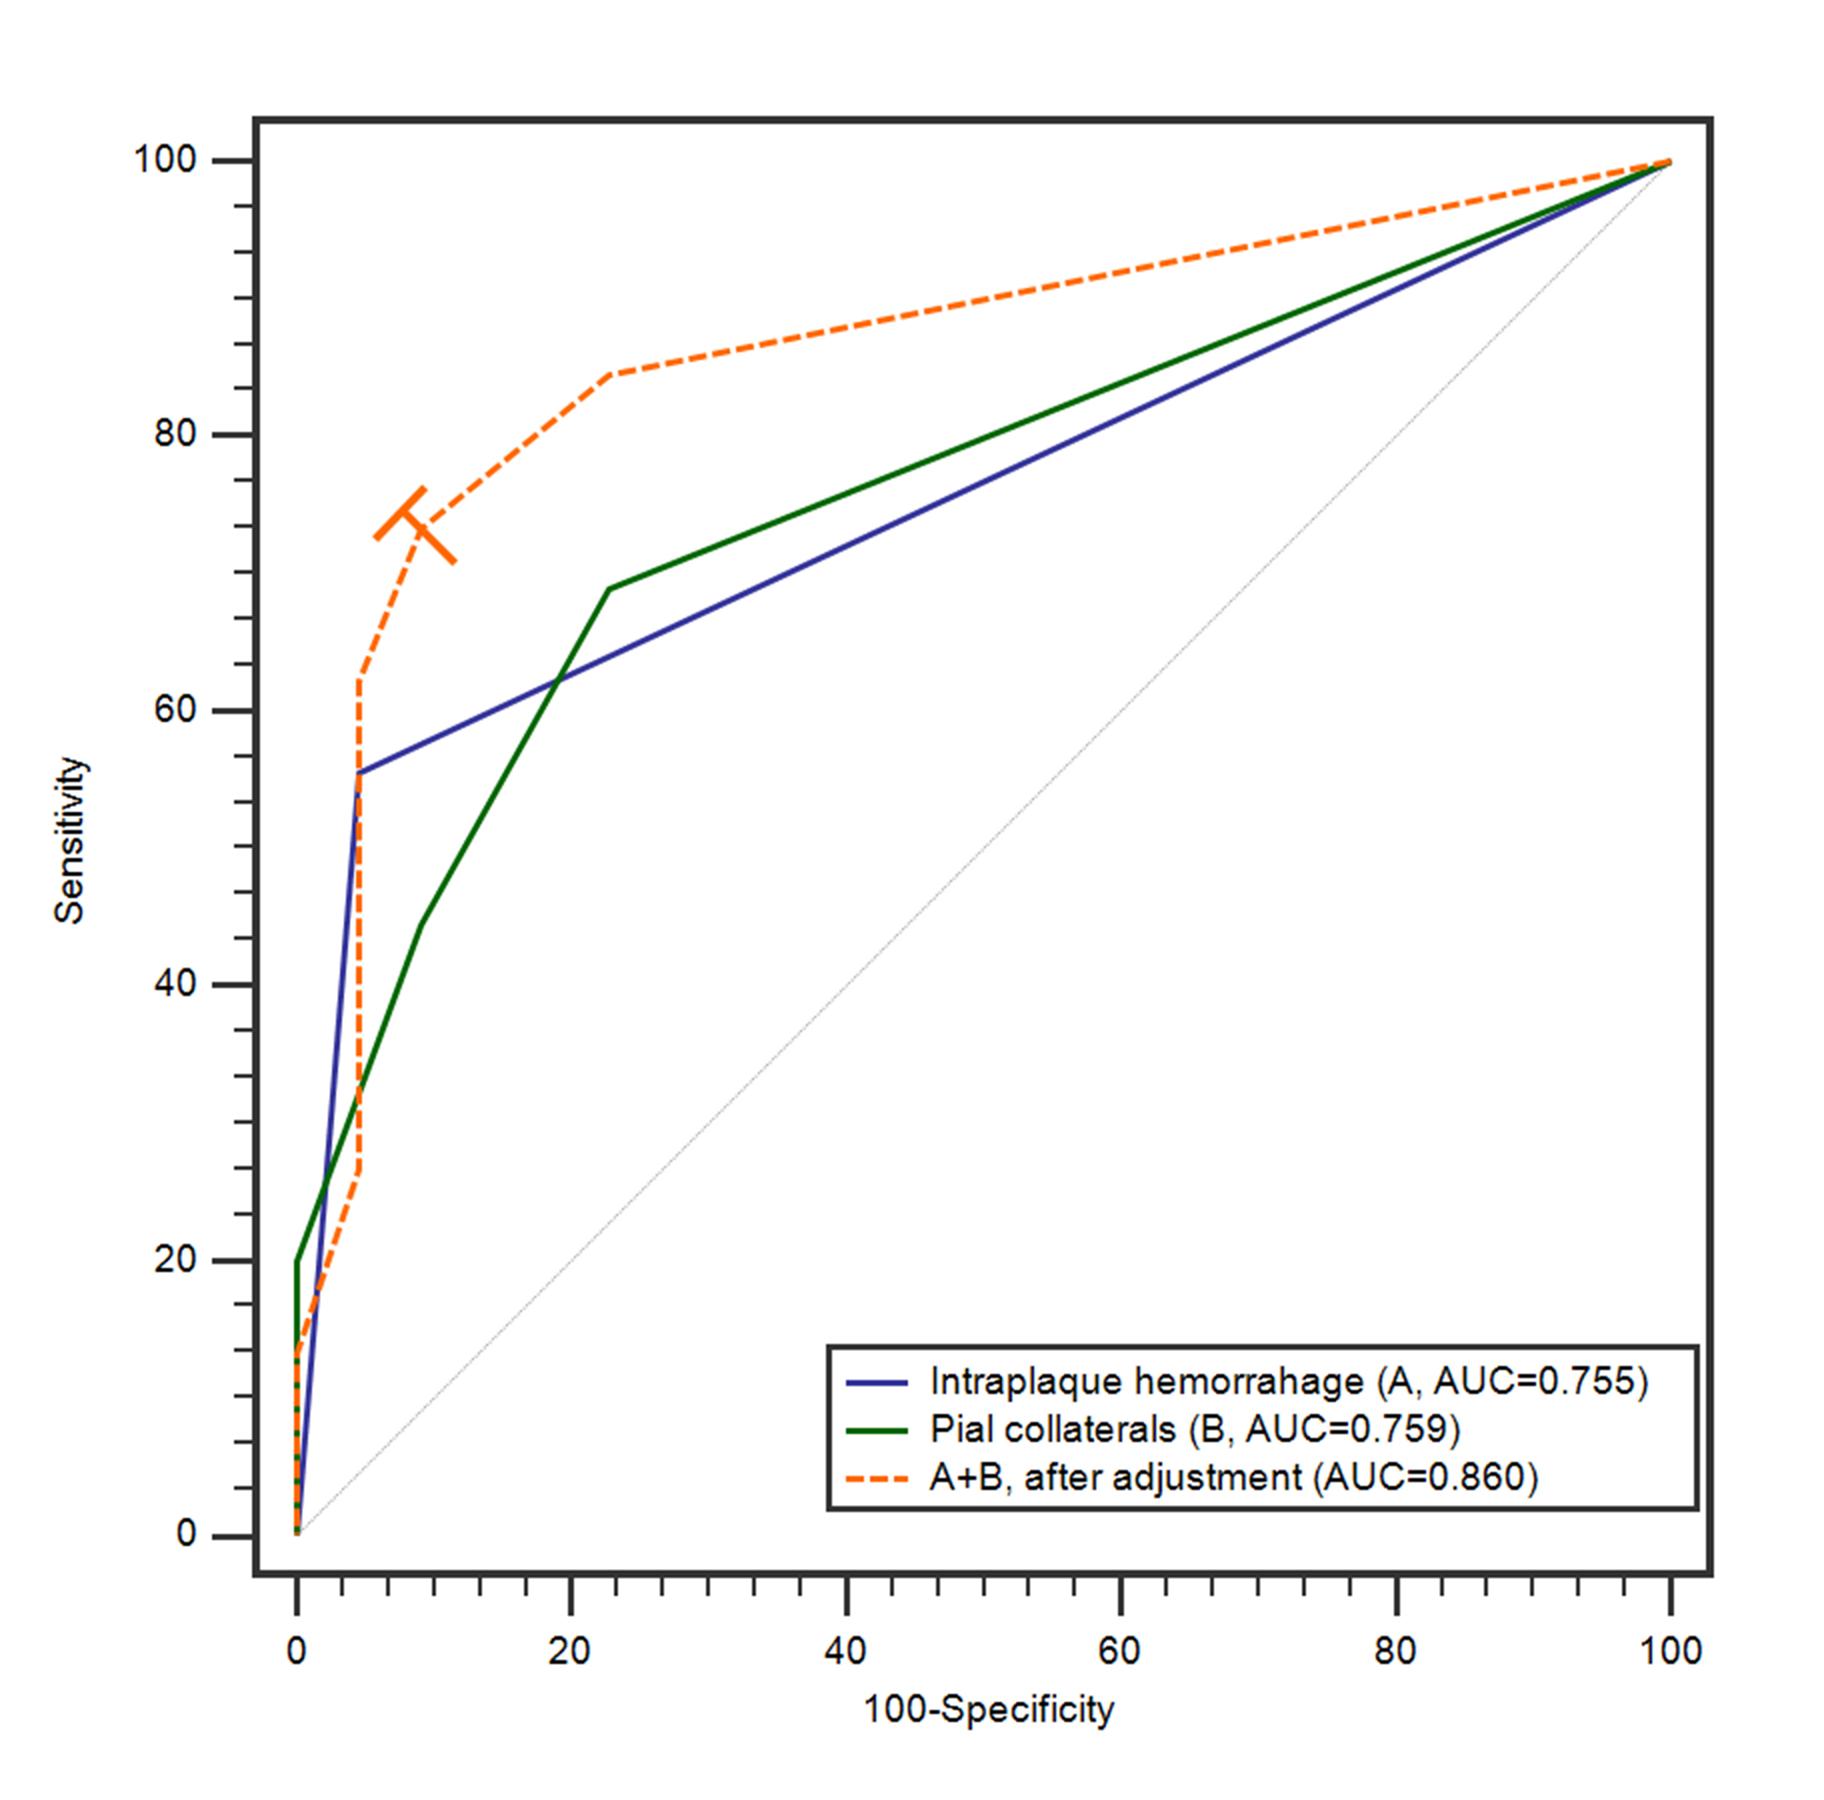
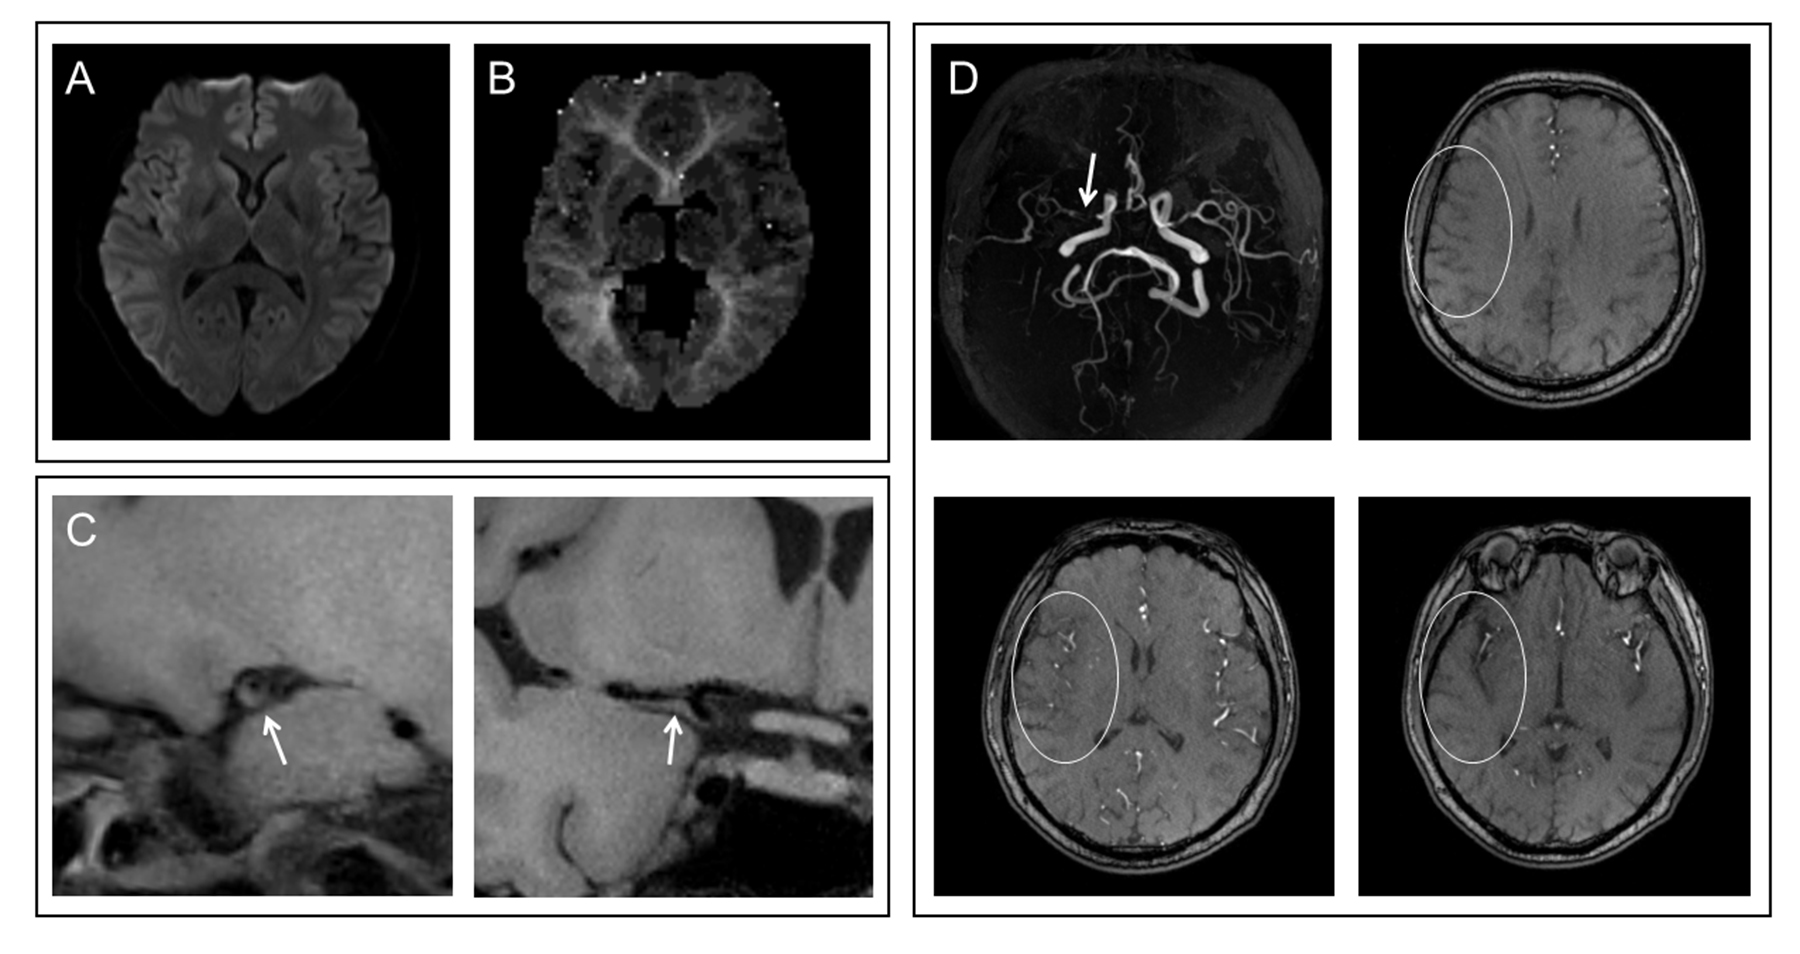
The median plaque length in the infarction group was 8.63 (5.97-15.78) mm, significantly longer than that of the TIA group (median 6.40, interquartile range 4.06-11.46) (Z = -2.283, P = .022). IPH was more commonly seen in patients with infarction (55.56% [25/45] versus 4.55% [1/22], P < .001) than in patients with TIA. Higher grade plaque enhancement was more commonly seen in the infarction group (grade 0, 11.11% [5/45] versus 27.27% [6/22]; grade 1, 26.67% [12/45] versus 45.46% [10/22]; grade 2, 62.22% [28/45] versus 27.27% [6/22]; P = .021) (Figure 1). Poor PCs were more common in patients with infarction but good PCs were more common in patients with TIA (grade 0, 20.00% versus 0%; grade 1, 24.44% versus 9.09%; grade 2, 24.44% versus 13.64%; grade 3, 31.12% versus 77.27%; P = .003). Larger Tmax > 6.0 s volume was found in the infarction group (12.81 ± 21.72 ml versus 4.41 ± 18.27 ml, P = .020) (Figure 2). IPH (OR 13.577, 95% CI 1.542-119.535, P = .019) and PCs (OR 0.453, 95%CI 0.210-0.975, P = .043) were found to be risk factors for patients with acute stroke in multivariable logistic analysis, after adjustment for age, sex, and cerebrovascular risk factors. The AUC of IPH, PCs and combination were 0.755, 0.759, and 0.860, respectively, in differentiating patients with infarction from those with TIA (Figure 3). The combination of IPH and PCs had a sensitivity of 73.33%, a specificity of 90.91%, and an accuracy of 80.60%. A linear regression model showed that Tmax > 6.0 s volume (β = 0.342, 95%CI 0.021-0.078, P = .001), IPH (β = 0.283, 95%CI 0.537-2.918, P = .005), hypertension (β = 0.260, 95%CI 0.431-2.845, P = .009) and PCs (β = -0.227, 95%CI -1.211- -0.060, P = .031) were significant in the model (R = 0.725, and adjusted R2 = 0.494). ANOVA test showed that F (4, 58) = 16.108, P < .001, which suggested that the regression model had statistical significance.Discussion and Conclusion
We have demonstrated that longer plaque length, IPH, a higher grade for enhancement of MCA plaque, poor PCs, and larger Tmax > 6.0 s volumes are more strongly associated with acute infarction than with TIAs. Additionally, evaluation of IPH and PCs are useful in predicting the occurrence of irreversible infarction. Finally, we provide a multi-parameter model to predict NIHSS scores; positive IPH and Tmax > 6.0 s volumes of greater than 16 ml are associated with neurological deficits. This study provides valuable methods of predicting clinical outcomes for patients with acute stroke.Acknowledgements
No acknowledgement found.References
[1] Kumar A, Kumar P, Kathuria P, et al. Genetics of ischemic stroke: An Indian scenario. Neurol India. 2016;64(1):29-37.
[2] Feigin VL, Forouzanfar MH, Krishnamurthi R, et al. Global and regional burden of stroke during 1990-2010: findings from the Global Burden of Disease Study 2010. Lancet. 2014;383(9913):245-254.
[3] Simmatis LER, Scott SH, Jin AY. The Impact of Transient Ischemic Attack (TIA) on Brain and Behavior. Front Behav Neurosci. 2019;13:44.
[4] Easton JD, Saver JL, Albers GW, et al. Definition and evaluation of transient ischemic attack: a scientific statement for healthcare professionals from the American Heart Association/American Stroke Association Stroke Council; Council on Cardiovascular Surgery and Anesthesia; Council on Cardiovascular Radiology and Intervention; Council on Cardiovascular Nursing; and the Interdisciplinary Council on Peripheral Vascular Disease. The American Academy of Neurology affirms the value of this statement as an educational tool for neurologists. Stroke. 2009;40(6):2276-2293.
[5] Yuan HW, Ji RJ, Wang AL, et al. A Grading Scale for Pial Collaterals in Middle Cerebral Artery Total Occlusion Based on Time-of-flight MR Angiography Source Images. Magn Reson Med Sci. 2019;18:62-69.
[6] Aoki J, Kimura K, Shibazaki K, Sakamoto Y. DWI-ASPECTS as a predictor of dramatic recovery after intravenous recombinant tissue plasminogen activator administration in patients with middle cerebral artery occlusion. Stroke. 2013;44(2):534-537.
[7] Albers GW, Marks MP, Kemp S, et al. Thrombectomy for Stroke at 6 to 16 Hours with Selection by Perfusion Imaging. N Engl J Med. 2018;378(8):708-718.
Figures