1589
White Matter Structural Changes after Multiple Concussions in Adolescents and Young Adults1Physics, University of Rochester, Rochester, NY, United States, 2Radiology, University of Rochester, Rochester, NY, United States, 3Imaging Sciences, University of Rochester, Rochester, NY, United States
Synopsis
Diffusion MRI (dMRI)-based studies in Traumatic Brain Injury have elucidated local and global WM alterations after injury. However, no studies have quantified how repeated concussions affect WM microstucture and coherence. We, therefore, sought to udnerstand how the number of previous concussions impact diffusion metrics. We found that, compared to the control group, there were significant decreases in FA and increases in MD and RD in the corticospinal tract. With respect to the number of concussions, we found that FA actually increased and was related with higher uniformity of the fibers. We believe this is related to aberrant remyelination.
Introduction
Multiple studies have elucidated the connection between multiple concussive impacts and depression1, reduced cognitive performance2, 3, and post-mortem findings consistent with tauopathy4, 5. Further studies incorporating diffusion MRI (dMRI) to understand post-concussive White Matter (WM) changes found local (region-based)6-9 and global (network-based)10, 11 alterations. None of these studies, however, quantified how the number of concussions affect WM despite evidence in the rat model12. In this study, we attempt to analyze two questions related to TBI: 1) How does the presence of concussion influence diffusion metrics in regions known to be implicated? and 2) Are there regional changes in these metrics specific to number of previous concussions?Methods
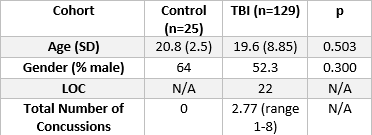
MRI Acquisition and Processing – All data are acquired on a 3T Siemens Skyra Scanner (Erlangen, Germany). Acquisition includes T1-MPRAGE (1x1x1 mm, TR/TE=1200/2.29 ms) and dMRI (2x2x2 mm, TR/TE=9000/99 ms, 64 directions with 1 b=0). GRE data is collected with TEs = 4.92, 7.38 ms. Diffusion images are corrected for susceptibility distortions using the GRE-generated fieldmap followed by eddy correction using FSL eddy13. These images are then reconstructed using the Constrained Spherical Deconvolution (CSD) model to produce the fiber Orientation Distribution Function (fODF)14. 129 patients with clinically diagnosed TBI and 25 controls are included in the study (Table 1).Diffusion Metrics – We use two sets of metrics: those derived from the Diffusion Tensor Imaging (DTI) model, and those derived from CSD. From the DTI model, we derive Fractional Anisotropy (FA), Mean Diffusivity (MD), Radial Diffusivity (RD), Axial Diffusivity (AD), and Geodesic Anisotropy (GA). From the fODF, a metric called the Fiber Coherence Index (FCI) is derived. The fODF represents the angular distribution of fiber populations in a voxel and is represented as a vector of spherical harmonics coefficients. The FCI is defined as the average L2 distance between each fODF in a region of interest (ROI) subtracted from the average fODF vector in the ROI; essentially, it is a measure of variance of the fODF in the ROI. In addition, we have used previously validated metrics of Apparent Fiber Density (AFD)15 and Number of Fiber Orientations (NuFO)16, 17. ROIs were defined using the JHU WM atlas18; notably, for the FCI, the Corticospinal Tract (CST) is divided into three regions: Cerebral Peduncle (CST 1), anterior limb of the internal capsule (CST 3), and the region between (CST 2). Clinical Scores – Total number of concussions and age are collected from patient records.
Results
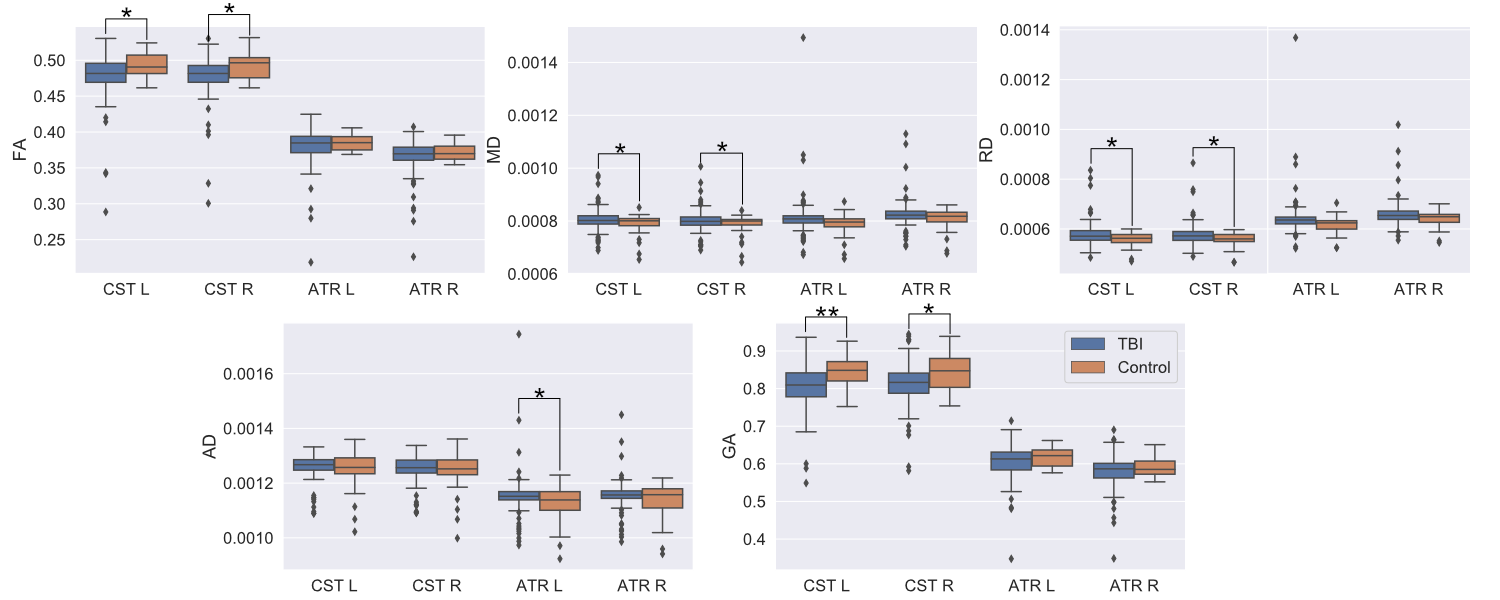
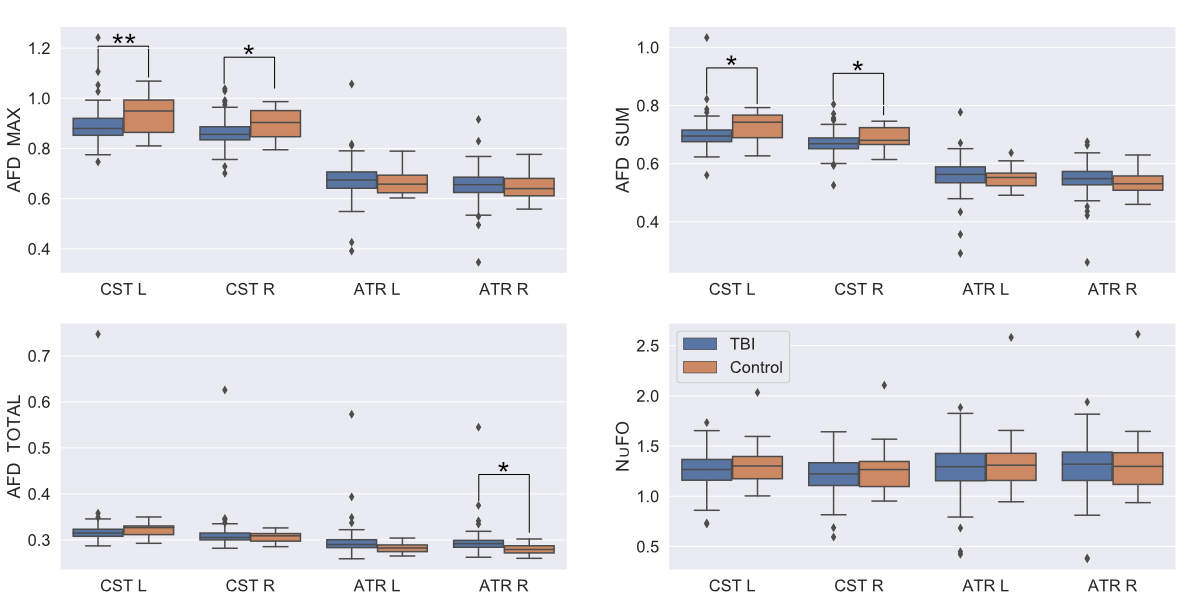
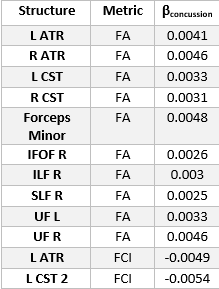
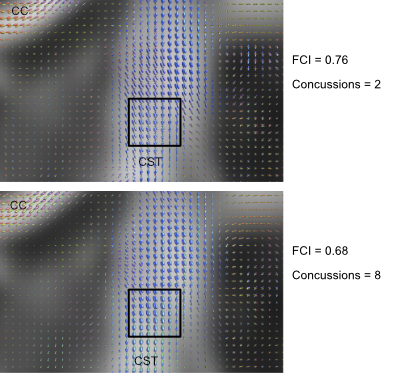
We use a two-sample t-test between the TBI and Control groups involving the diffusion metrics discussed. We choose two structures that are thought to be implicated in TBI: the CST and Anterior Thalamic Radiation (ATR). The results of this analysis are shown in Figure 1 for DTI metrics and Figure 2 for fODF metrics. We then examine if changes in FA and FCI in regions across the brain are related to the number of concussions after controlling for age. To do this, we use only the TBI cohort and generate a linear model to quantify the relationship between the number of concussions and diffusion metrics after age correction. Regions and metrics that are statistically significant are given in Table 2. Comparison of the fODF in CST 2 region between two subjects with different FCI is shown in Figure 3.Discussion
In Figure 1, we see that FA and GA are significantly decreased in the CST bilaterally with significant decreases in MD and RD. In addition, a significant reduction in AD was seen in the left ATR. These regions were shown to be implicated in previous studies19, 20. Figure 2 shows a similar pattern with AFD decreasing in the TBI group, consistent with the idea that there is WM loss in the acute setting. While Figure 1 showed decreases in FA in the TBI group, we found that the slope of the relationship between number of concussions and FA is positive in a variety of regions. We believe this to be due to remyelination in the chronic state of TBI, which has been previously seen in the semi-acute stage of TBI21. In order to better understand how the process of healing/attempted repair occurs, we look to the FCI metric, which is seen to significantly decrease in the left CST 2 and ATR as a function of number of concussions. This suggests that fibers become less varied with repeated concussion, as indicated in representative images shown in Figure 3. Increasing uniformity of fibers could potentially relate to incomplete or erroneous remyelination of axons. In fact, a previous study22 found changes in myelin structure related to remyelination after repeated TBI in a mouse model. We, therefore, hypothesize that increased FA in the presence of decreasing FCI reflects erroneous remyelination of axons.Conclusion
We find that group-level comparisons between TBI and control cohorts show diffusion metrics that are consistent with WM microstructural destruction/alteration. However, analysis of the influence of repeated concussion in the TBI group show that these same metrics may have different trends, e.g. FA decreased relative to control group, but increases as a function of number of concussions. We hypothesize that this relationship along with our FCI measure may indicate erroneous remyelination in repeated TBI.Acknowledgements
I would like to acknowledge Giovanni Schifitto and NIH Grant 5R01MH118020-02 for funding. As a whole, we would like to acknowledge the subjects of the study.References
1. Guskiewicz, K.M., et al., Recurrent concussion and risk of depression in retired professional football players. Med Sci Sports Exerc, 2007. 39(6): p. 903-9.
2. Collins, M.W., et al., Relationship between concussion and neuropsychological performance in college football players. Jama-Journal of the American Medical Association, 1999. 282(10): p. 964-970. 3. Guskiewicz, K.M., et al., Cumulative effects associated with recurrent concussion in collegiate football players: the NCAA Concussion Study. JAMA, 2003. 290(19): p. 2549-55.
4. Omalu, B.I., et al., Chronic traumatic encephalopathy in a national football league player: part II. Neurosurgery, 2006. 59(5): p. 1086-92; discussion 1092-3.
5. Omalu, B.I., et al., Chronic traumatic encephalopathy in a National Football League player. Neurosurgery, 2005. 57(1): p. 128-34; discussion 128-34.
6. Zhang, K., et al., Are functional deficits in concussed individuals consistent with white matter structural alterations: combined FMRI & DTI study. Exp Brain Res, 2010. 204(1): p. 57-70.
7. Zhang, L., et al., Diffusion anisotropy changes in the brains of professional boxers. AJNR Am J Neuroradiol, 2006. 27(9): p. 2000-4.
8. Cubon, V.A., et al., A diffusion tensor imaging study on the white matter skeleton in individuals with sports-related concussion. J Neurotrauma, 2011. 28(2): p. 189-201.
9. Maugans, T.A., et al., Pediatric sports-related concussion produces cerebral blood flow alterations. Pediatrics, 2012. 129(1): p. 28-37.
10. Bazarian, J.J., et al., Subject-specific changes in brain white matter on diffusion tensor imaging after sports-related concussion. Magn Reson Imaging, 2012. 30(2): p. 171-80.
11. Caeyenberghs, K., et al., Altered structural networks and executive deficits in traumatic brain injury patients. Brain Struct Funct, 2014. 219(1): p. 193-209.
12. Prins, M.L., et al., Repeat traumatic brain injury in the juvenile rat is associated with increased axonal injury and cognitive impairments. Dev Neurosci, 2010. 32(5-6): p. 510-8.
13. Andersson, J.L.R. and S.N. Sotiropoulos, An integrated approach to correction for off-resonance effects and subject movement in diffusion MR imaging. Neuroimage, 2016. 125: p. 1063-1078.
14. Tournier, J.D., F. Calamante, and A. Connelly, Robust determination of the fibre orientation distribution in diffusion MRI: non-negativity constrained super-resolved spherical deconvolution. Neuroimage, 2007. 35(4): p. 1459-72.
15. Raffelt, D., et al., Apparent Fibre Density: a novel measure for the analysis of diffusion-weighted magnetic resonance images. Neuroimage, 2012. 59(4): p. 3976-94.
16. Nedjati-Gilani, S., G. Parker, and D. Alexander. Mapping the number of fibre orientations per voxel in diffusion MRI. in Proc. Intl. Soc. Mag. Reson. Med. 2006.
17. Dell'Acqua, F., et al., Can spherical deconvolution provide more information than fiber orientations? Hindrance modulated orientational anisotropy, a true-tract specific index to characterize white matter diffusion. Hum Brain Mapp, 2013. 34(10): p. 2464-83.
18. Mori, S., et al., MRI atlas of human white matter. 2005: Elsevier.
19. Bendlin, B.B., et al., Longitudinal changes in patients with traumatic brain injury assessed with diffusion-tensor and volumetric imaging. Neuroimage, 2008. 42(2): p. 503-514.
20. Seo, J.P. and S.H. Jang, Traumatic axonal injury of the corticospinal tract in the subcortical white matter in patients with mild traumatic brain injury. Brain Inj, 2015. 29(1): p. 110-4.
21. Ling, J.M., et al., Biomarkers of increased diffusion anisotropy in semi-acute mild traumatic brain injury: a longitudinal perspective. Brain, 2012. 135(Pt 4): p. 1281-92.
22. Mierzwa, A.J., et al., Components of myelin damage and repair in the progression of white matter pathology after mild traumatic brain injury. J Neuropathol Exp Neurol, 2015. 74(3): p. 218-32.
Figures