1581
White matter degeneration in Papez circuit is associated with memory function in patients with mesial temporal lobe epilepsy1Institute of Medical Device and Imaging, National Taiwan University College of Medicine, Taipei, Taiwan, Taipei, Taiwan, 2Department of Diagnostic Radiology, Singapore General Hospital, Singapore, Singapore, Singapore, Singapore, 3Department of Neurology, National Taiwan University Hospital and College of Medicine, Taipei, Taiwan, Taipei, Taiwan, 4Department of Psychology, College of Science, National Taiwan University, Taipei, Taiwan, Taipei, Taiwan, 5AcroViz Technology, Inc., Taipei, Taiwan, Taipei, Taiwan, 6Molecular Imaging Center, National Taiwan University, Taipei, Taiwan, Taipei, Taiwan
Synopsis
Previous studies did not characterize side-specific associations between structural integrity of the Papez circuit and memory function in patients with mesial temporal lobe epilepsy (MTLE). Here, we used diffusion spectrum imaging (DSI) and T1-weighted MRI to calculate the white matter integrity and gray matter volume, respectively. The structural metrics were correlated with visual and verbal memory function scores assessed by neuropsychological test. The results showed distinct brain-behavior associations in two subtypes of MTLE.
Introduction
Mesial temporal lobe epilepsy (MTLE) with mesial temporal sclerosis is a common type of epilepsy characterized by seizures arising from the limbic system1,2. The Papez circuit is a neural circuit representing one of the anatomic substrates of memory and emotion3, which is one of the major pathways in the limbic system. MTLE at left lesion (L-MTLE) and that with right lesion (R-MTLE) behave distinct patterns of alteration of brain structures4 in both white matter and gray matter. Neuropsychological studies have reported that L-MTLE and R-MTLE present different brain dysfunctions in memory, emotion and executive function5,6. In this study, we aimed to investigate the degeneration patterns of the Papez circuit in L-MTLE and R-MTLE, and their associations with memory functions.Methods
Subjects: We recruited 18 L-MTLE (10 men, mean age ± standard deviation: 37.4 ± 8.5 years) and 17 R-MTLE (9 men, 37.9 ± 8.1 years) patients, and 37 age-matched controls (17 men, 38.4 ± 8.3 years).Imaging: The MRI data were acquired on a 3T MRI system (TIM Trio, Siemen) with a 32-channel phased-array head coil. The imaging included T1-wighted imaging (T1WI) and diffusion spectrum imaging (DSI). T1WI utilized a 3D magnetization-prepared rapid gradient echo pulse sequence: TR/TE = 2000/3 ms, flip angle = 9°, FOV = 256 x 192 x 208 mm^3, and acquisition matrix = 256 x 192 x 208. DSI used a pulsed gradient twice-refocused spin-echo diffusion echo-planar imaging sequence7: TR/TE = 9600/130 ms, flip angle = 90°, FOV = 200 x 200 mm^2, acquisition matrix = 80 x 80, and section thickness = 2.5 mm. A total of 102 diffusion-encoding gradients were applied using the maximum diffusion sensitivity of 4000 s/mm^2; the encoding gradients corresponded to the grid points filled within the half sphere with a radius of three units in diffusion-encoding space8.
Clinical test: Neuropsychological test (NPT) constitutes specifically designed tasks used to measure a psychological function known to be linked to a particular brain structure or pathway. Tests last for about three hours, containing many assessments such as similarity, spatial span, face name test, etc. In this study, 14 L-MTLE and 14 R-MTLE patients completed the test.
Analysis: White matter tract integrity indices were calculated from the DSI data including generalized fractional anisotropy (GFA), axial diffusivity (AD), radial diffusivity (RD), and mean diffusivity (MD)9 (Fig. 1). We quantified tract alterations using a normative model which transformed the diffusion indices into the z-scores by comparing them to the age- and sex-matched population. A higher z-score represent larger deviation from the normal population. We used voxel-based morphometry (VBM) to investigate the local distribution of gray matter volume10. To evaluate the group differences among the L-MTLE, R-MTLE and the control group, we used analysis of covariance (ANCOVA), controlling age and sex. Within the MTLE groups, we divided all the white matter tracts and gray matter ROIs in the Papez circuit into those related to verbal memory and those related to visual memory. NPT scores were also assessed for association with averaged z-scores by correlation analysis.
Results
Comparing white matter integrity to the control group by using ANCOVA, the number of significantly impaired tracts in R-MTLE was higher than L-MTLE, especially in AD, RD and MD (Table 1). Using VBM to compare structural differences between right and left MTLE patients, extensive gray matter volume reduction beyond the affected mesial temporal regions was more obvious in R-MTLE than in L-MTLE (Table 2). The correlation analysis between averaged z-scores of white matter integrity and verbal memory showed that the number of tracts with significant association in L-MTLE was more than that in R-MTLE, but in visual memory R-MTLE had more tracts with significant association than L-MTLE (Table 3). The results in gray matter volume did not show any differences between L-MTLE and R-MTLE for both verbal and visual memory (Table 4).Discussion
Patients with R-MTLE exhibited more alterations in white matter integrity and gray matter volume than patients with L-MTLE and the controls, suggesting a more aggravated demyelination and axonal injury in R-MTLE. In addition, MTLE patients also have neuropsychological deterioration. L-MTLE tends to have affected tracts related to verbal memory disability and R-MTLE tends to have affected tracts related to visual memory deficits.Conclusion
Memory impairment is one of the most prominent cognitive deficits in MTLE. By utilizing MRI parameters and NPT, we evaluated the association of side-specific MTLE with memory deficits. Our findings reveal the side-specific associations of brain degeneration in the Papez circuit and suggest different neuropathology and clinical manifestation between in two subtypes of MTLE.Acknowledgements
This research was partially supported by Ministry of Science and Technology (MOST) Taiwan (grant: 108-2314-B-002 -004).References
1. Pustina, D. et al. (2015), 'Increased Microstructural White Matter Correlations in Left, But Not Right, Temporal Lobe Epilepsy', Human Brain Mapping, 36, 85–98
2. Engel, J.Jr. (2001), 'Mesial temporal lobe epilepsy: what have we learned? ', The Neuroscientist : a review journal bringing neurobiology, neurology and psychiatry, 7, 340–352
3. Oikawa, H. et al. (2001), 'The circuit of Papez in mesial temporal sclerosis: MRI', Neuroradiology, 43, 205–210
4. Besson, P. et al. (2014), 'Structural connectivity differences in left and right temporal lobe epilepsy', Neuroimage, 100, 135 –144
5. Frisk,V. et al. (1990), 'The role of the left hippocampal region in the acquisition and retention of story content', Neuropsychologia, 28, 349–359
6. Hocking, J. et al. (2013), 'Disentangling the cognitive components supporting Austin Maze performance in left versus right temporal lobe epilepsy', Epilepsy & Behavior, 29, 485–491
7. Reese, T.G. et al. (2003), 'Reduction of eddy-current-induced distortion in diffusion MRI using a twice-refocused spin echo', Magnetic Resonance in Medicine, 49(1), 177–182
8. Kuo, L.W. et al. (2013), 'Diffusion spectrum MRI using body-centered-cubic and half-sphere sampling schemes', Journal of Neuroscience Methods , 212, 143–155
9. Chen, et al. (2015), 'Automatic whole brain tract‐based analysis using predefined tracts in a diffusion spectrum imaging template and an accurate registration strategy' , Human brain mapping, 36(9), 3441–3458
10. Pail, M. et al. (2010), 'An optimized voxel-based morphometric study of gray matter changes in patients with left-sided and right-sided mesial temporal lobe epilepsy and hippocampal sclerosis (MTLE/HS)' , Epilepsia, 51, 511–518
Figures
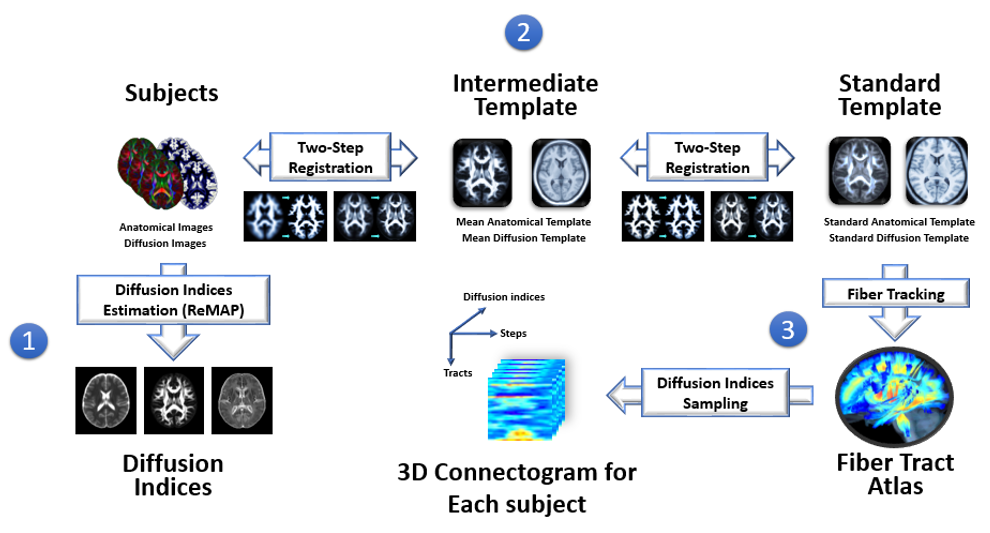
Figure 1: Flow chart of tract-based automatic analysis.
1) Diffusion indices were estimated by ReMAP MRI.
2) Deformation maps were calculated from each individual’s native space to standard template space.
3) The coordinates of 76 tracts predefined in the standard template were transformed to native space to sample the diffusion indices.
4) The output of tract-based analysis was formatted into a three-dimensional connectogram for each participant.
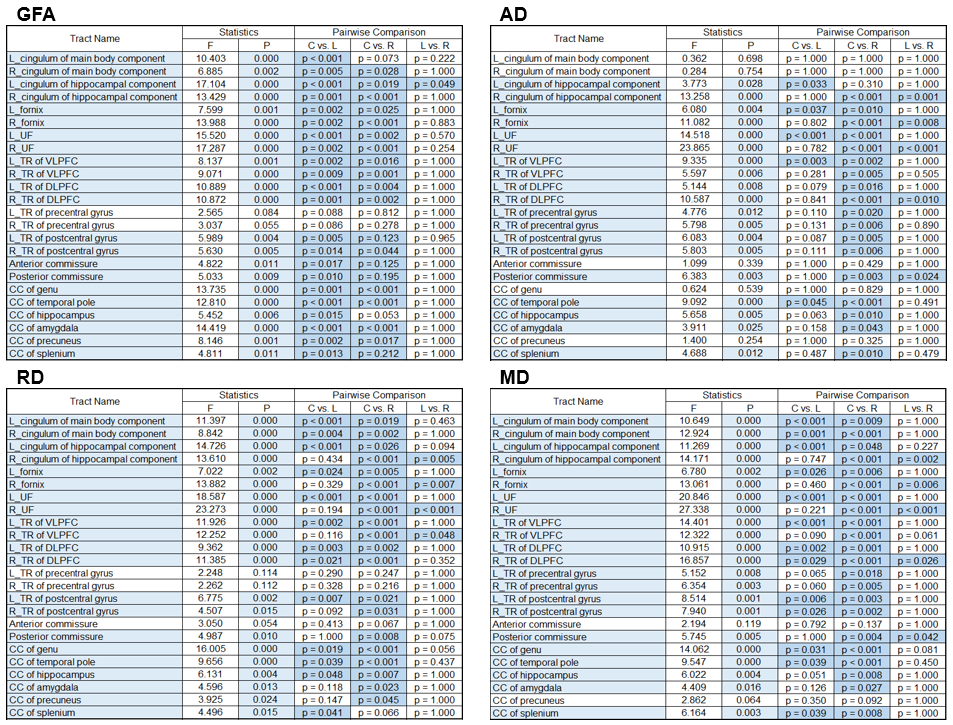
Table 1: ANCOVA of diffusion indices in L-MTLE, R-MTLE and control group.
Note: Tracts with blue background showed significance in ANCOVA after Bonferroni correction.
CC: corpus callosum; DLPFC: dorsal lateral prefrontal cortex; L: left; R: right; TR: thalamic radiation; UF: uncinate fasciculus; VLPFC: ventral lateral prefrontal cortex.

Table 2: ANCOVA of gray matter volumes in L-MTLE, R-MTLE and control group.
Note: Tracts with green background showed significance in ANCOVA after Bonferroni correction.
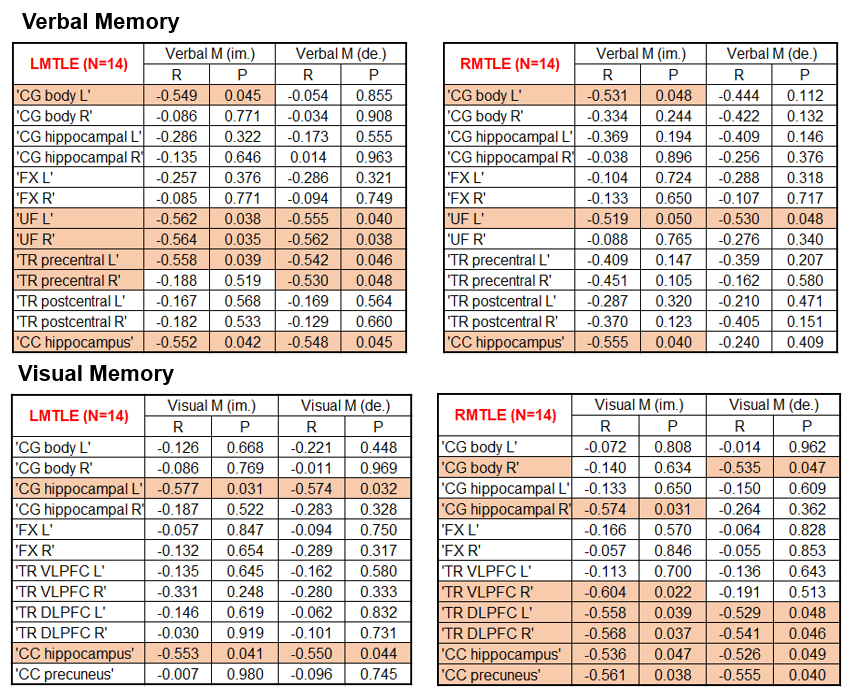
Table 3: Correlation between averaged z-scores and NPT in L-MTLE and R-MTLE.
Note: Tracts with orange background showed significant associations with p < 0.05.
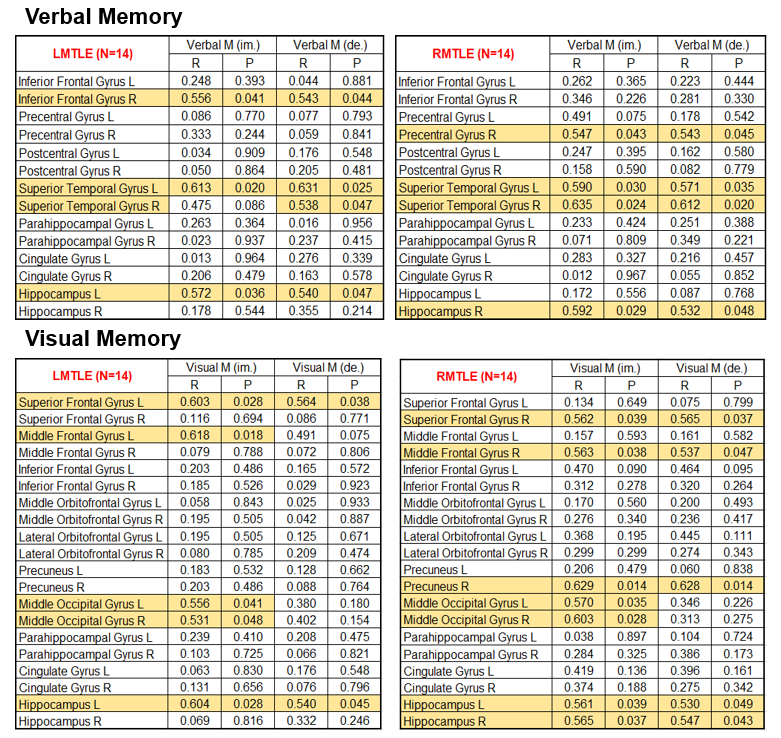
Table 4: Correlation between gray matter volume and NPT in L-MTLE and R-MTLE.
Note: Gray matter regions with yellow background showed significant associations with p < 0.05.