1580
Linking priors-assisted Meyer’s loop tractography with visual field deficits in patients undergoing temporal lobe epilepsy surgery
Dmitri Shastin1,2, Sanchita Bhatia2, Chantal M. W. Tax1, Greg Parker1, Stefan Schwartz2, Khalid Hamandi1,2, William Gray2,3, Derek Jones1, and Maxime Chamberland1
1School of Psychology, Cardiff University Brain Research Imaging Centre, Cardiff, United Kingdom, 2School of Medicine, Cardiff University Brain Research Imaging Centre, Cardiff, United Kingdom, 3BRAIN Biomedical Research Unit, Cardiff, United Kingdom
1School of Psychology, Cardiff University Brain Research Imaging Centre, Cardiff, United Kingdom, 2School of Medicine, Cardiff University Brain Research Imaging Centre, Cardiff, United Kingdom, 3BRAIN Biomedical Research Unit, Cardiff, United Kingdom
Synopsis
Pre-operative reconstruction of the Meyer’s loop (ML) using diffusion MRI has a clinical utility when planning temporal lobe resection in order to avoid post-operative visual field deficit. Due to its complex anatomy, precise reconstruction of the ML is challenging. Previous literature has suggested that state-of-the-art hardware and tractography using oriented priors better approximates reconstruction to the reported histological prosections. This pilot work evaluates the ability of these improvements to predict visual field deficit in surgical patients. We report a good association in three out of four cases and suggest that simplistic metrics may not necessarily correlate with function.
Introduction
Temporal lobe epilepsy is the most common form of focal epilepsy, with resection of temporal lobe structures dominating the epilepsy surgery caseload.1 Damage to the Meyer’s loop (ML), the portion of the optic radiation that courses through the temporal lobe from the lateral geniculate body (LGN) to the occipital cortex, represents a significant risk of surgery, 2,3 with potential implications to driving and lifestyle.3 Accurate pre-operative delineation of the ML using diffusion MRI (dMRI) is of major clinical interest; however, the acute bend of this tract and its passage through regions with multiple kissing and crossing white matter fibres has made tractography challenging, typically under-estimating its full extent.4 When leveraging state-of-the-art hardware 5 and incorporating anatomical priors, 6 ML reconstruction compares closely with reported histological prosections.4 The aim of this work is to evaluate how those improvements translate to predicting post-operative visual field deficit in clinical set-up.Methods
Clinical information: Following written consent, four patients undergoing resective surgery for temporal lobe epilepsy (age: 19-55, M:F=1:3) were recruited. Postoperative visual field deficit was tested 1-2 weeks after surgery using Humphrey’s perimetry.Acquisition and processing: Patients were scanned on a 3T Siemens Connectom system two months prior to operation. An anatomical T1 volume (voxel size: 1x1x1 mm3, TR/TE 2300/2.81 ms) and a dMRI dataset (voxel size: 1.2×1.2×1.2 mm3; b=0/1200/3000/5000 s/mm2 in 16/60/60/60 directions, respectively; TR/TE 5400/68 ms) were procured. dMRI datasets were denoised7, corrected for signal drift 8 and slicewise 9 intensity outliers, Eddy current distortion and motion artefact ,10 EPI distortion, 11 gradient non-linearity 12 and Gibbs ringing.13 A post-operative T1 volume was acquired 2-3 months following surgery.
Tractography and analysis: Fibre orientation distribution functions 14 were derived using multi-shell multi-tissue constrained spherical deconvolution.15 ML tractography was performed using real-time multi-peak tractography in FiberNavigator 16 (angular threshold 56∘, step size 1.0 mm, min/max length 30/200 mm) based on seed-ROI (5x10³ seeds) placed at the LGN with an inclusion planar ROI through the retrosplenial occipital cortex. To capture the full extent of ML, a 20x60x30 mm3 directional ROI with anatomical priors was placed in the anterior temporal lobe (Fig.1) as previously described.4 Streamlines were truncated at the LGN and pruned. Pre- and post-operative T1 were brought into dMRI space with non-affine registration 17 masking resection cavity used in the latter. Streamlines intersecting the surgical cavity were labelled as “damaged”. To quantify the damage to ML in each subject, the following normalised index (DI) was derived: damaged/total number of streamlines.
Results
The four cases were examined qualitatively and a correlation with visual field deficits was made. First, the patient undergoing a lateral resection presumed to be in proximity to but not in direct contact with ML was used as a negative control (Fig.2); indeed, tractography showed no “damaged” streamlines (DI=0%) corresponding to full visual fields. Next, a patient with a clear visual field defect was used as a positive control (Fig.3); as expected, a dense bundle of “damaged” streamlines was demonstrated (DI=14.3%). Finally, the remaining two patients were examined. In one case (Fig.4), a minimal field deficit correlated with the small portion of “damaged” streamlines revealed by tractography (DI=6.5%). In the other (Fig.5), there was no significant visual field deficit yet the proportion of “damaged” streamlines appeared substantial (DI=16.4%). Contrary to the positive control, here the “damaged” streamlines were scattered across the ML with only a minority terminating in the mesial occipital cortex. There was no correlation between DI and the proportion “blind” points on Humphrey’s perimetry (data not shown) although the correlation became strong (p=0.023) if the latter case was excluded.Discussion
Previous studies have attempted to model the ML using tractography for surgical planning 18 suggesting a link between the ML-temporal pole distance and visual field deficit. While not assessing this distance, our pilot study suggested that the degree of ML damage during surgery may be linked to post-operative visual field deficit. In three cases out of four, there was a good association between the ratio of “damaged” streamlines and visual field deficit. In the fourth case, this association was not demonstrated. This could be due to a number of factors. First, the retinotopic organisation of ML 3 means that some fibres may be more functionally important than others. Indeed, projections to the primary visual cortex carrying macular information would cause a disproportionately large visual field deficit. Our future direction will be to explore this association by mapping the “damaged” fibres onto the parcellated visual cortex in a larger population. Second, the significant brain shift that occurs following surgery means that precise pre- to post-operative T1 co-registration is complex. We addressed this by masking the resected region and applying non-affine registration, although a degree of inaccuracy still remained.Conclusions
We evaluated the ability of state-of-the-art imaging to predict visual defects in surgical patients by comparing tractography with post-operative visual field maps. While a good association was demonstrated in three out of four cases, this was not present in the fourth suggesting that simplistic metrics (such as DI) may not necessarily correlate with function. Such anatomical validation of ML is paramount for the full clinical translation of diffusion tractography.Acknowledgements
DS is supported by the Wellcome Trust-funded GW4 Clinical Academic Training fellowship and Welsh Clinical Academic Track fellowship. SB is supported by the Wellcome Trust Inspire Vacation Studenship. CMWT is supported by a Rubicon grant (680-50-1527) from the Netherlands Organisation for Scientific Research (NWO) and a Sir Henry Wellcome Fellowship (215944/Z/19/Z).References
- de Tisi J, Bell GS, Peacock JL, et al. The long-term outcome of adult epilepsy surgery, patterns of seizure remission, and relapse: a cohort study. Lancet 2011;378(9800):1388-1395.
- Hader WJ, Tellez-Zenteno J, Metcalfe A, et al. Complications of epilepsy surgery: a systematic review of focal surgical resections and invasive EEG monitoring. Epilepsia 2013;54(5):840-847.
- Winston GP. Epilepsy surgery, vision, and driving: what has surgery taught us and could modern imaging reduce the risk of visual deficits? Epilepsia 2013;54(11):1877-1888.
- Chamberland M, Tax CMW, Jones DK. Meyer's loop tractography for image-guided surgery depends on imaging protocol and hardware. Neuroimage Clin 2018;20:458-465.
- Jones DK, Alexander DC, Bowtell R, et al. Microstructural imaging of the human brain with a 'super-scanner': 10 key advantages of ultra-strong gradients for diffusion MRI. Neuroimage 2018;182:8-38.
- Chamberland M, Scherrer B, Prabhu SP, et al. Active delineation of Meyer's loop using oriented priors through MAGNEtic tractography (MAGNET). Hum Brain Mapp 2017;38(1):509-527.
- Veraart J, Novikov DS, Christiaens D, et al. Denoising of diffusion MRI using random matrix theory. Neuroimage 2016;142:394-406.
- Vos SB, Tax CM, Luijten PR, et al. The importance of correcting for signal drift in diffusion MRI. Magn Reson Med 2017;77(1):285-299.
- Sairanen V, Leemans A, Tax CMW. Fast and accurate Slicewise OutLIer Detection (SOLID) with informed model estimation for diffusion MRI data. Neuroimage 2018;181:331-346.
- Andersson JLR, Sotiropoulos SN. An integrated approach to correction for off-resonance effects and subject movement in diffusion MR imaging. Neuroimage 2016;125:1063-1078.
- Andersson JL, Skare S, Ashburner J. How to correct susceptibility distortions in spin-echo echo-planar images: application to diffusion tensor imaging. Neuroimage 2003;20(2):870-888.
- Glasser MF, Sotiropoulos SN, Wilson JA, et al. The minimal preprocessing pipelines for the Human Connectome Project. Neuroimage 2013;80:105-124.
- Kellner E, Dhital B, Kiselev VG, et al. Gibbs-ringing artifact removal based on local subvoxel-shifts. Magn Reson Med 2016;76(5):1574-1581.
- Tournier JD, Calamante F, Connelly A. Robust determination of the fibre orientation distribution in diffusion MRI: non-negativity constrained super-resolved spherical deconvolution. Neuroimage 2007;35(4):1459-1472.
- Jeurissen B, Tournier JD, Dhollander T, et al. Multi-tissue constrained spherical deconvolution for improved analysis of multi-shell diffusion MRI data. Neuroimage 2014;103:411-426.
- Chamberland M, Whittingstall K, Fortin D, et al. Real-time multi-peak tractography for instantaneous connectivity display. Front Neuroinform 2014;8:59.
- Jenkinson M, Beckmann CF, Behrens TE, et al. Fsl. Neuroimage 2012;62(2):782-790.
- Meesters S, Ossenblok P, Wagner L, et al. Stability metrics for optic radiation tractography: Towards damage prediction after resective surgery. J Neurosci Methods 2017;288:34-44.
Figures
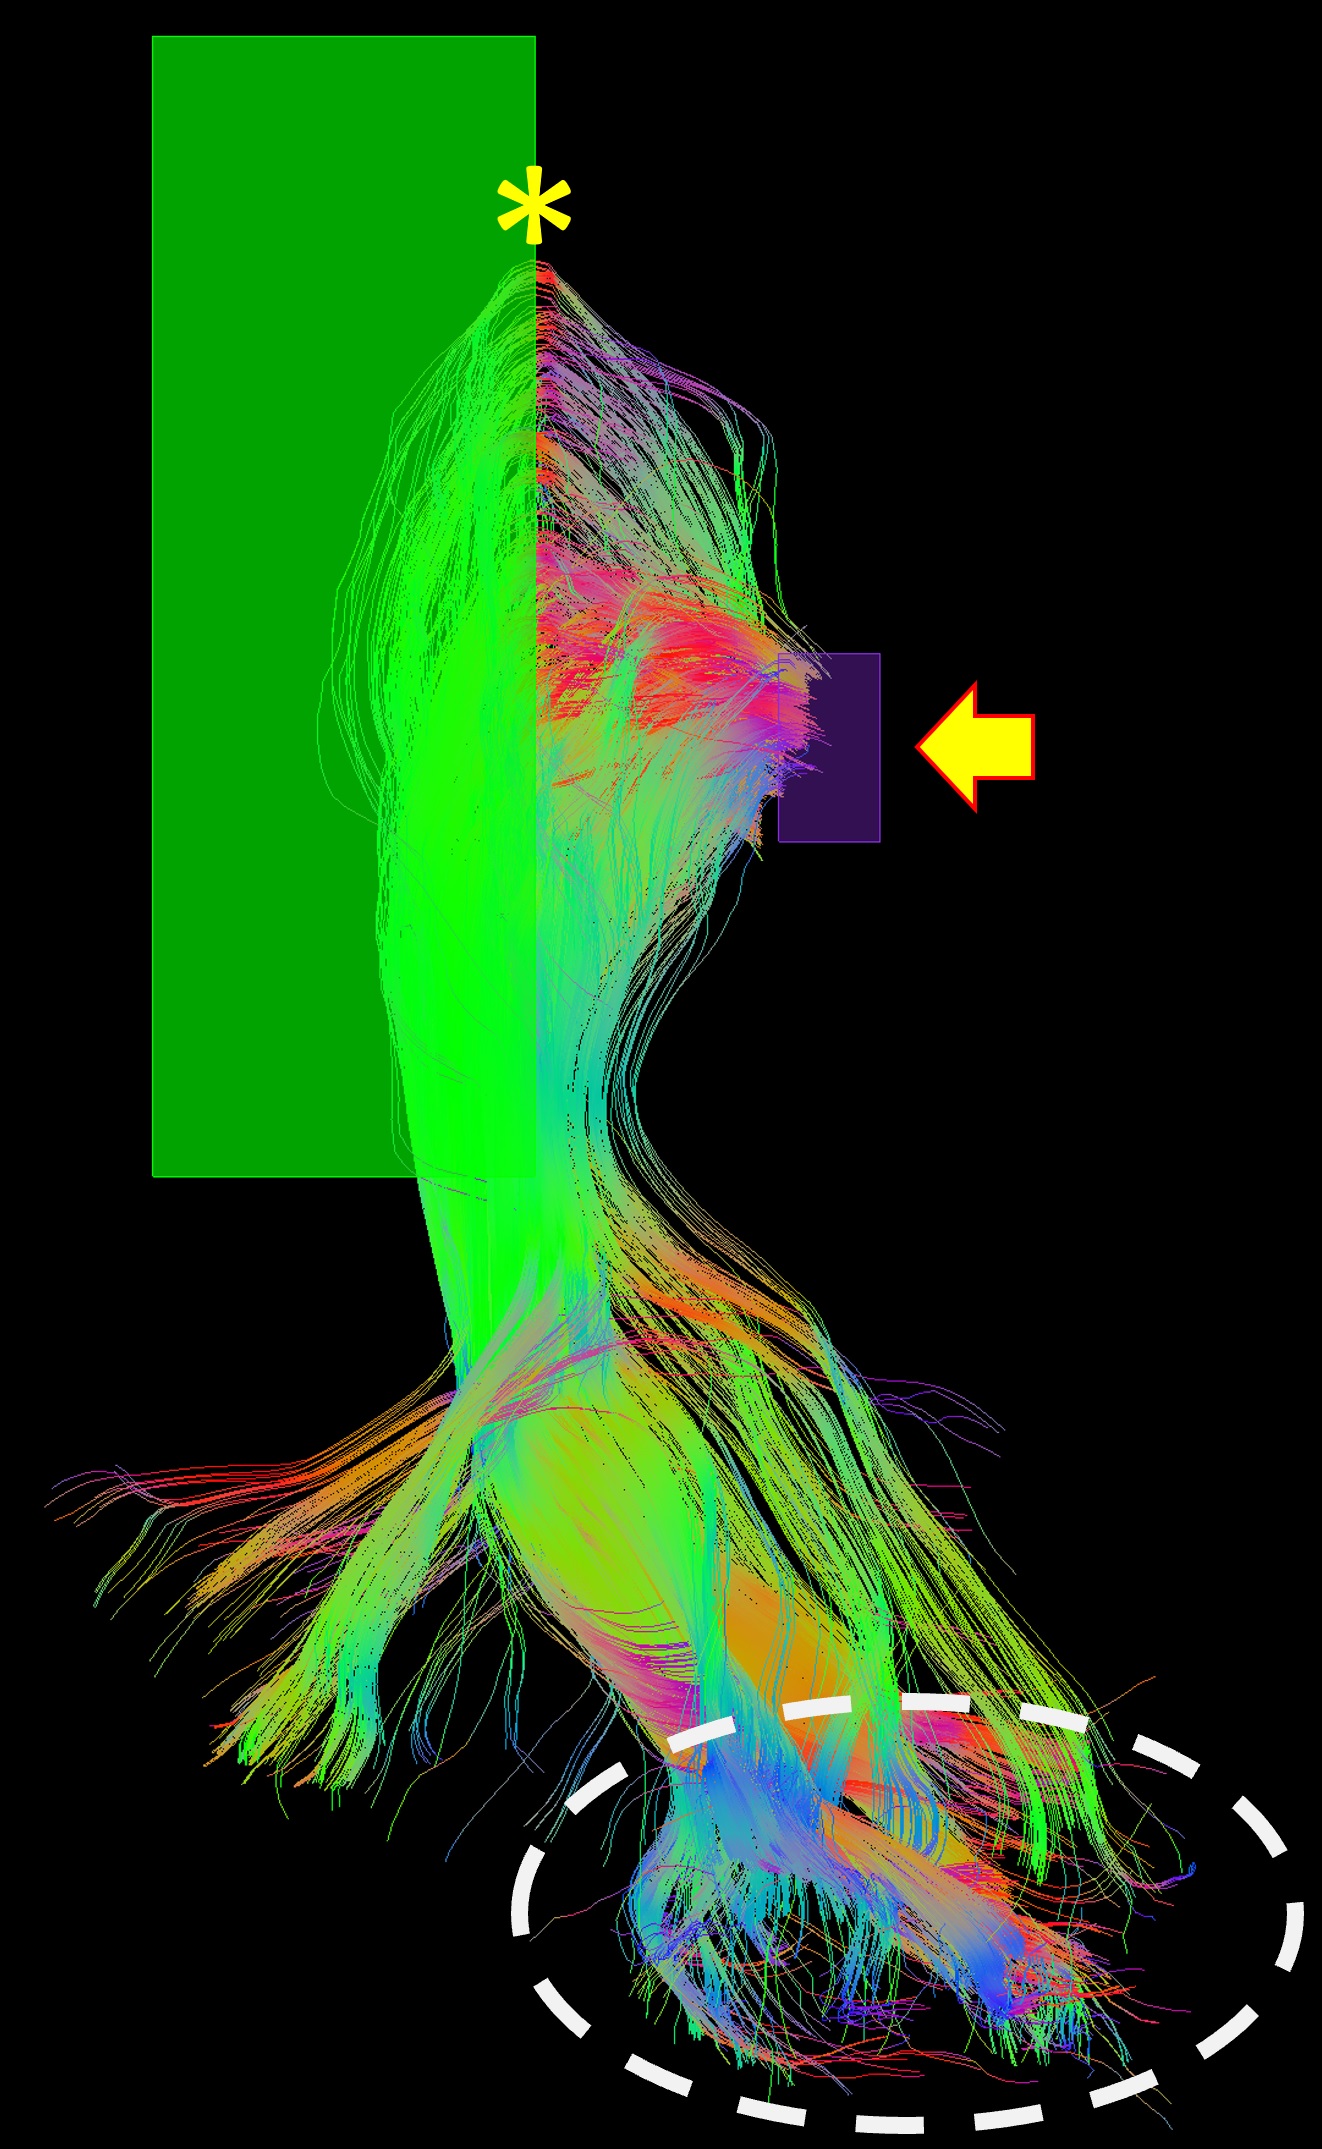
Demonstration of the placement of the seed-ROI (purple,
yellow arrow) and the directional ROI (green). Anterior bend of ML, yellow
asterisk. Occipital pole, white dashed line.
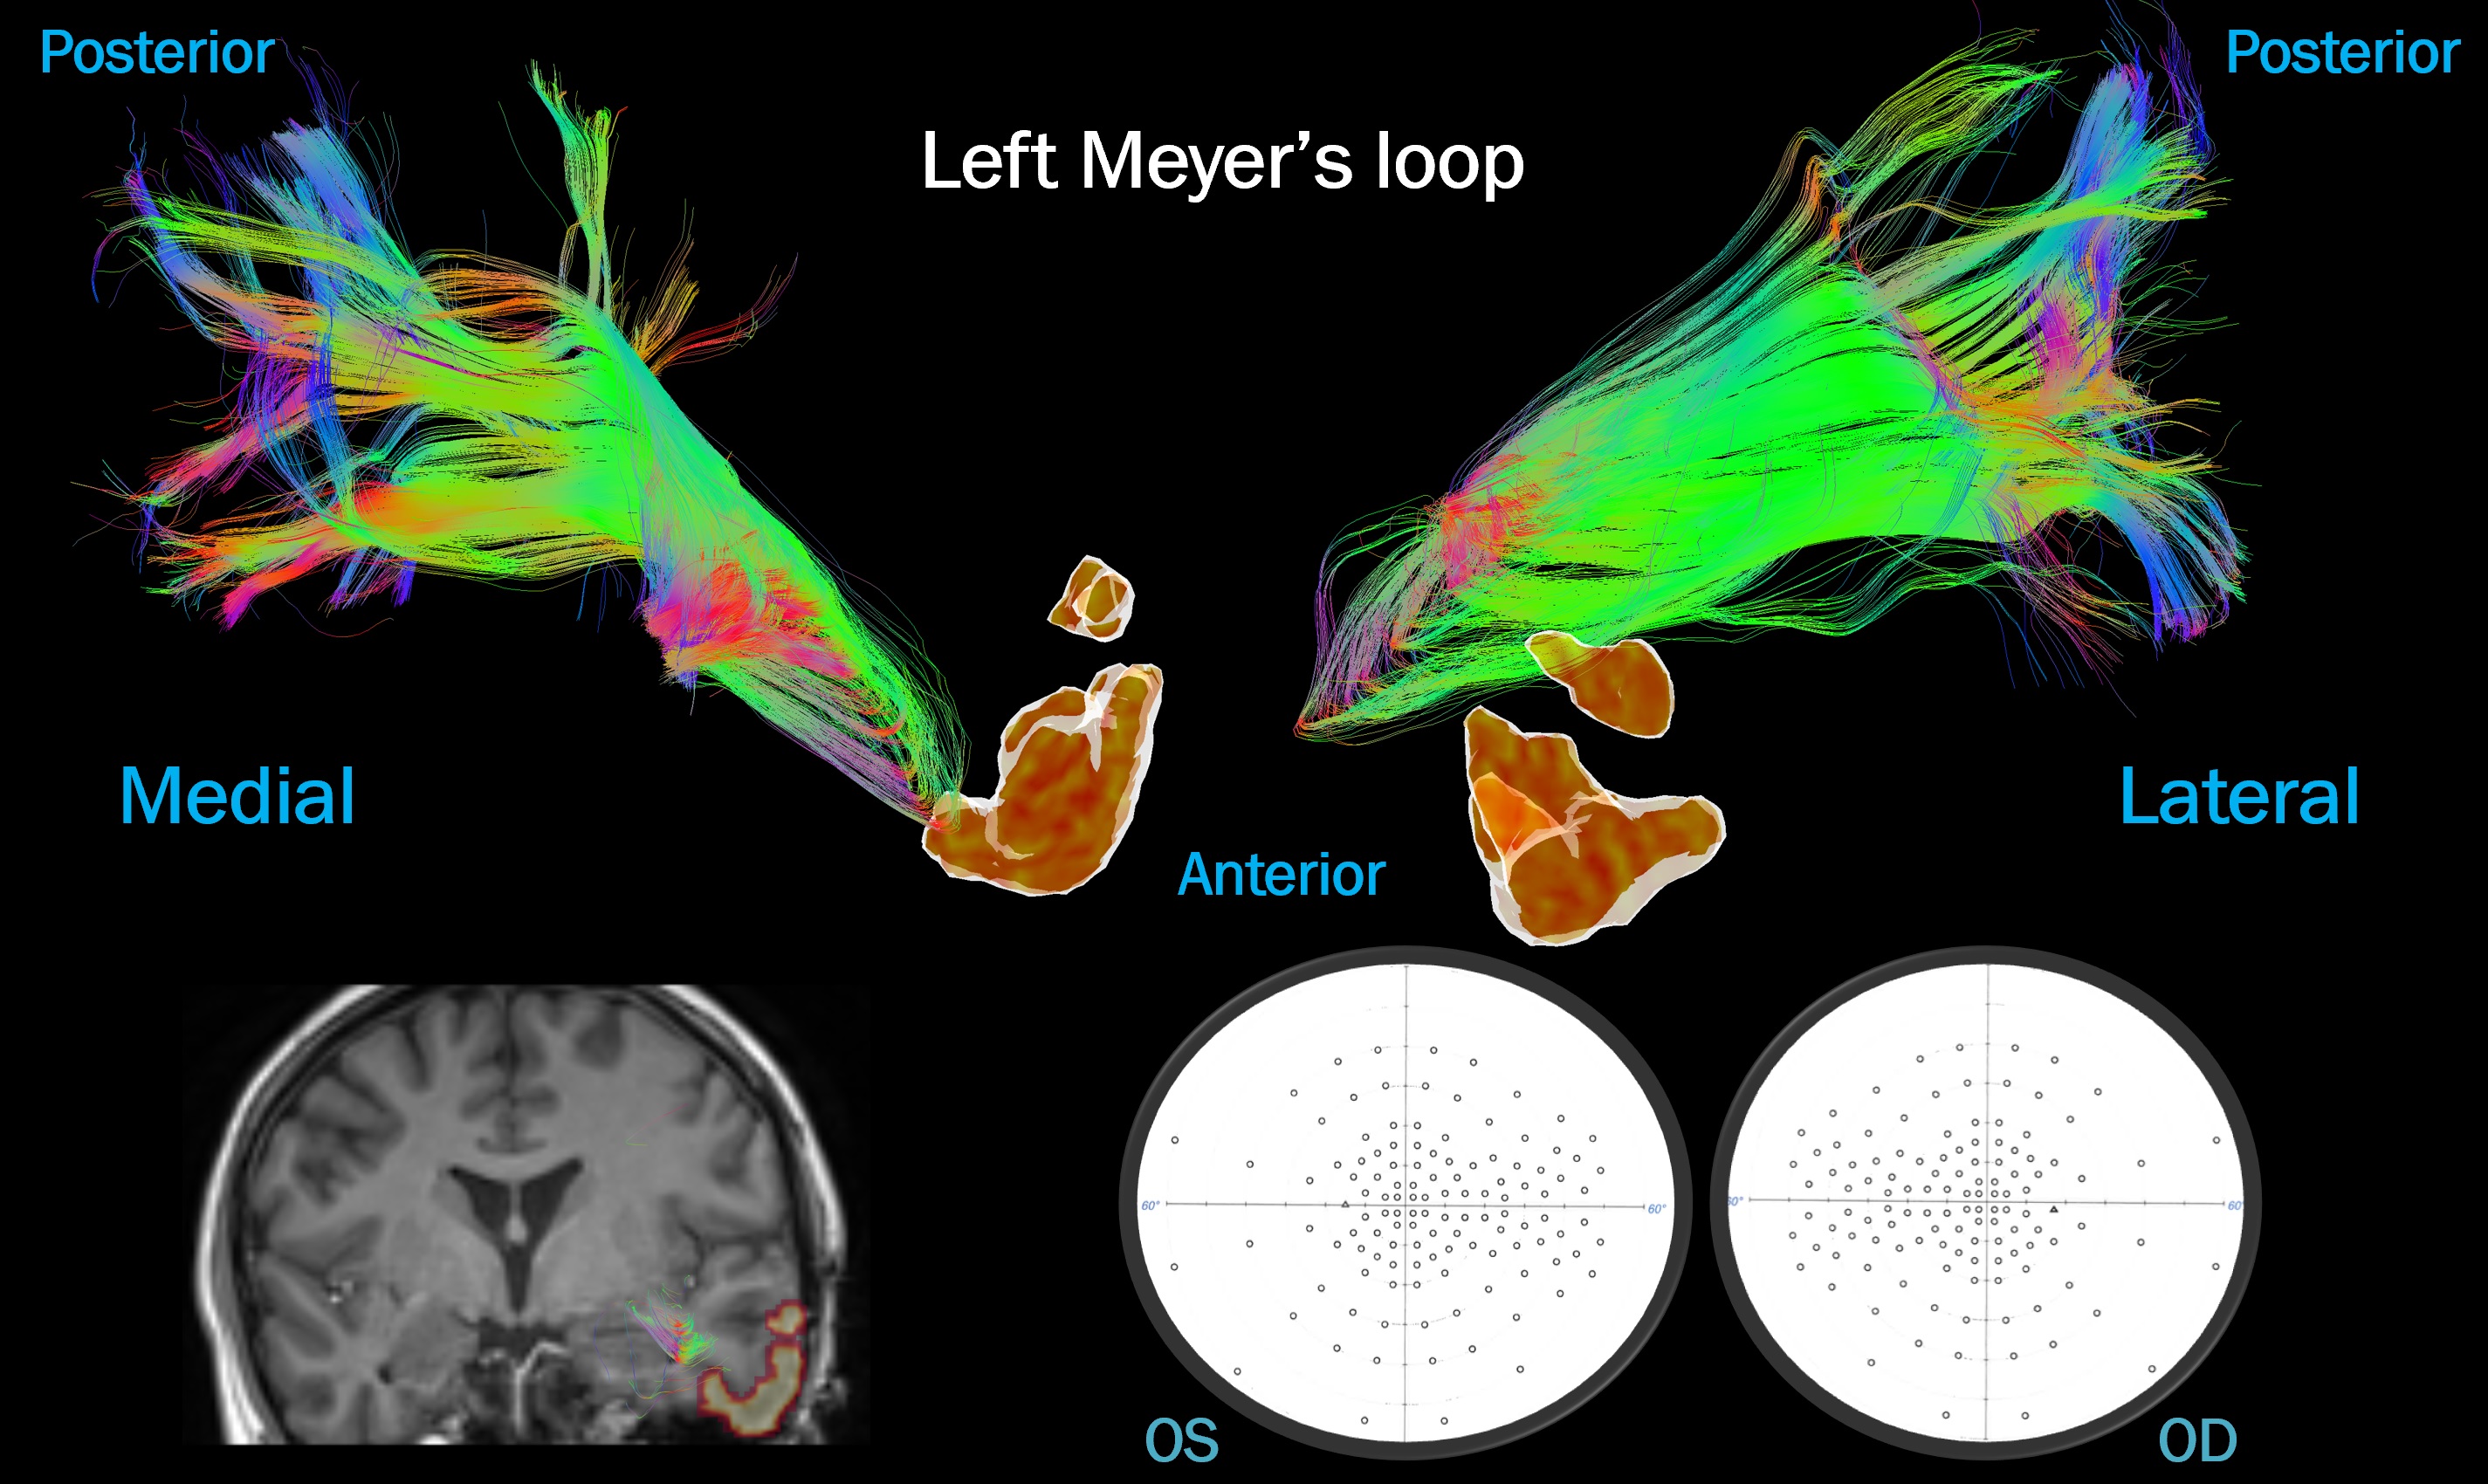
Case
1: lateral temporal resection. No streamlines were “damaged”, correlating with
preserved visual fields postoperatively. Top: ML viewed medially and laterally
next to an isosurface of the surgical mask. Bottom left: surgical cavity
(yellow) over the post-op T1 next to the pre-op ML. Bottom right: visual
fields.
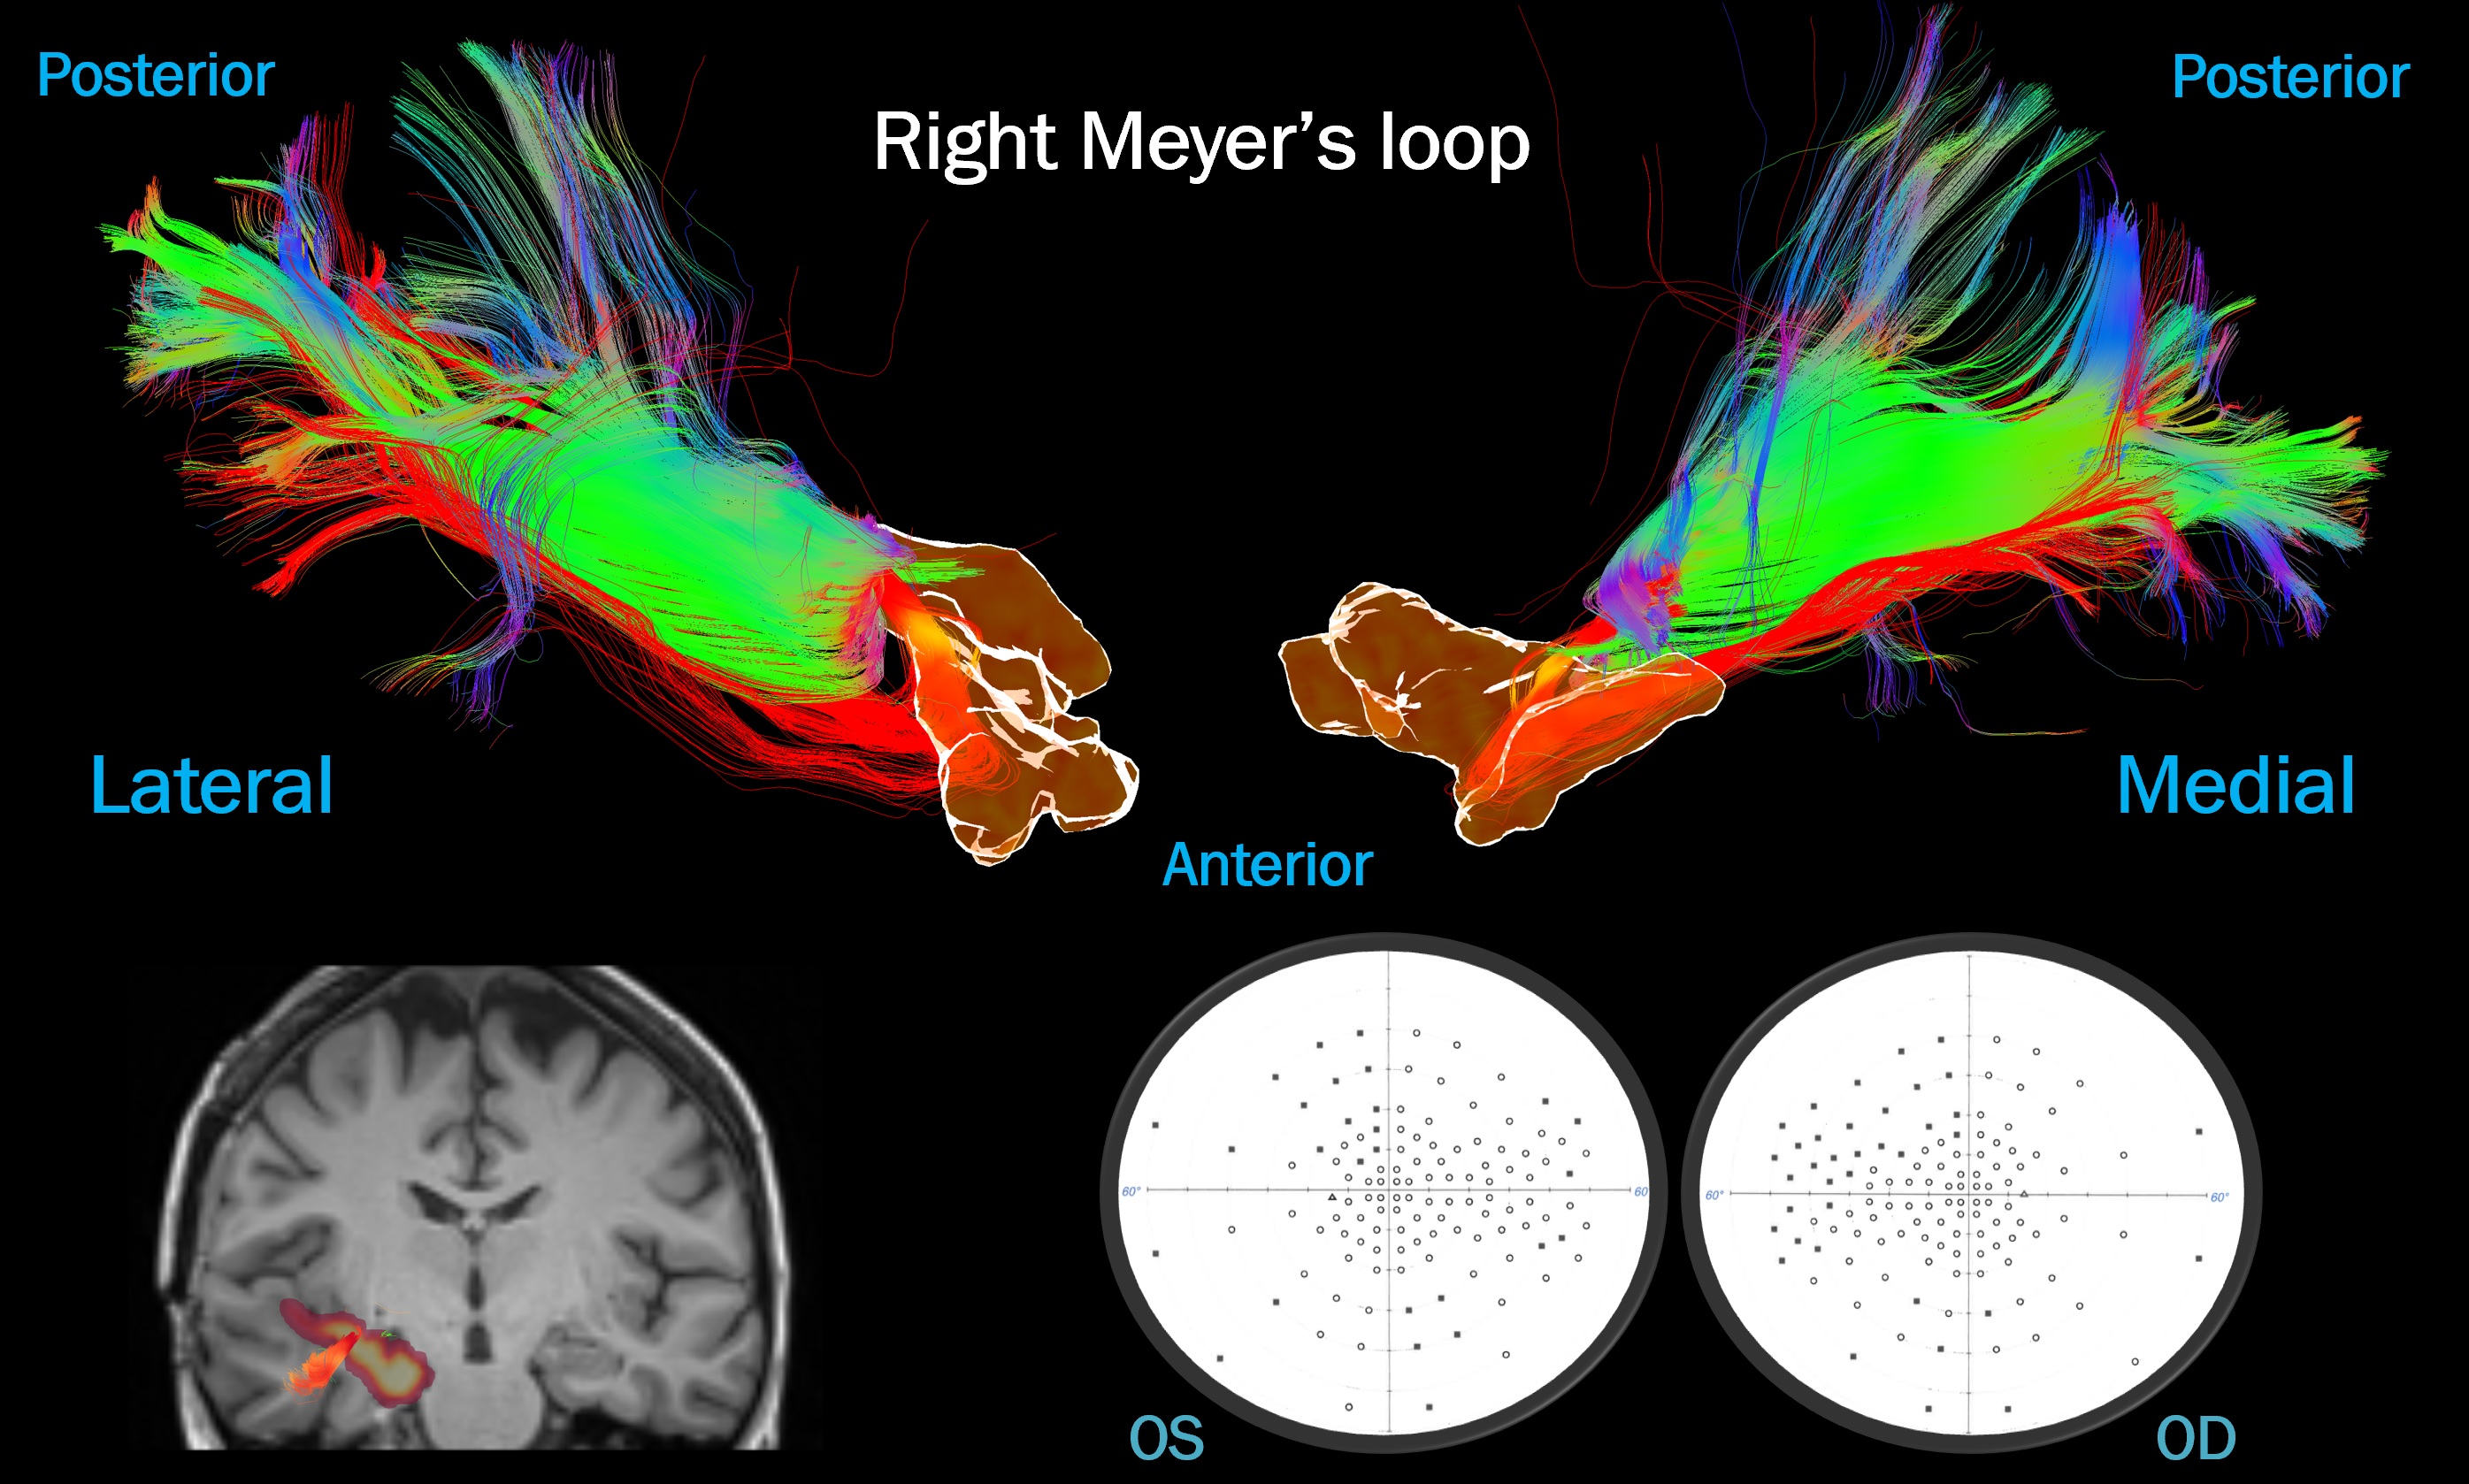
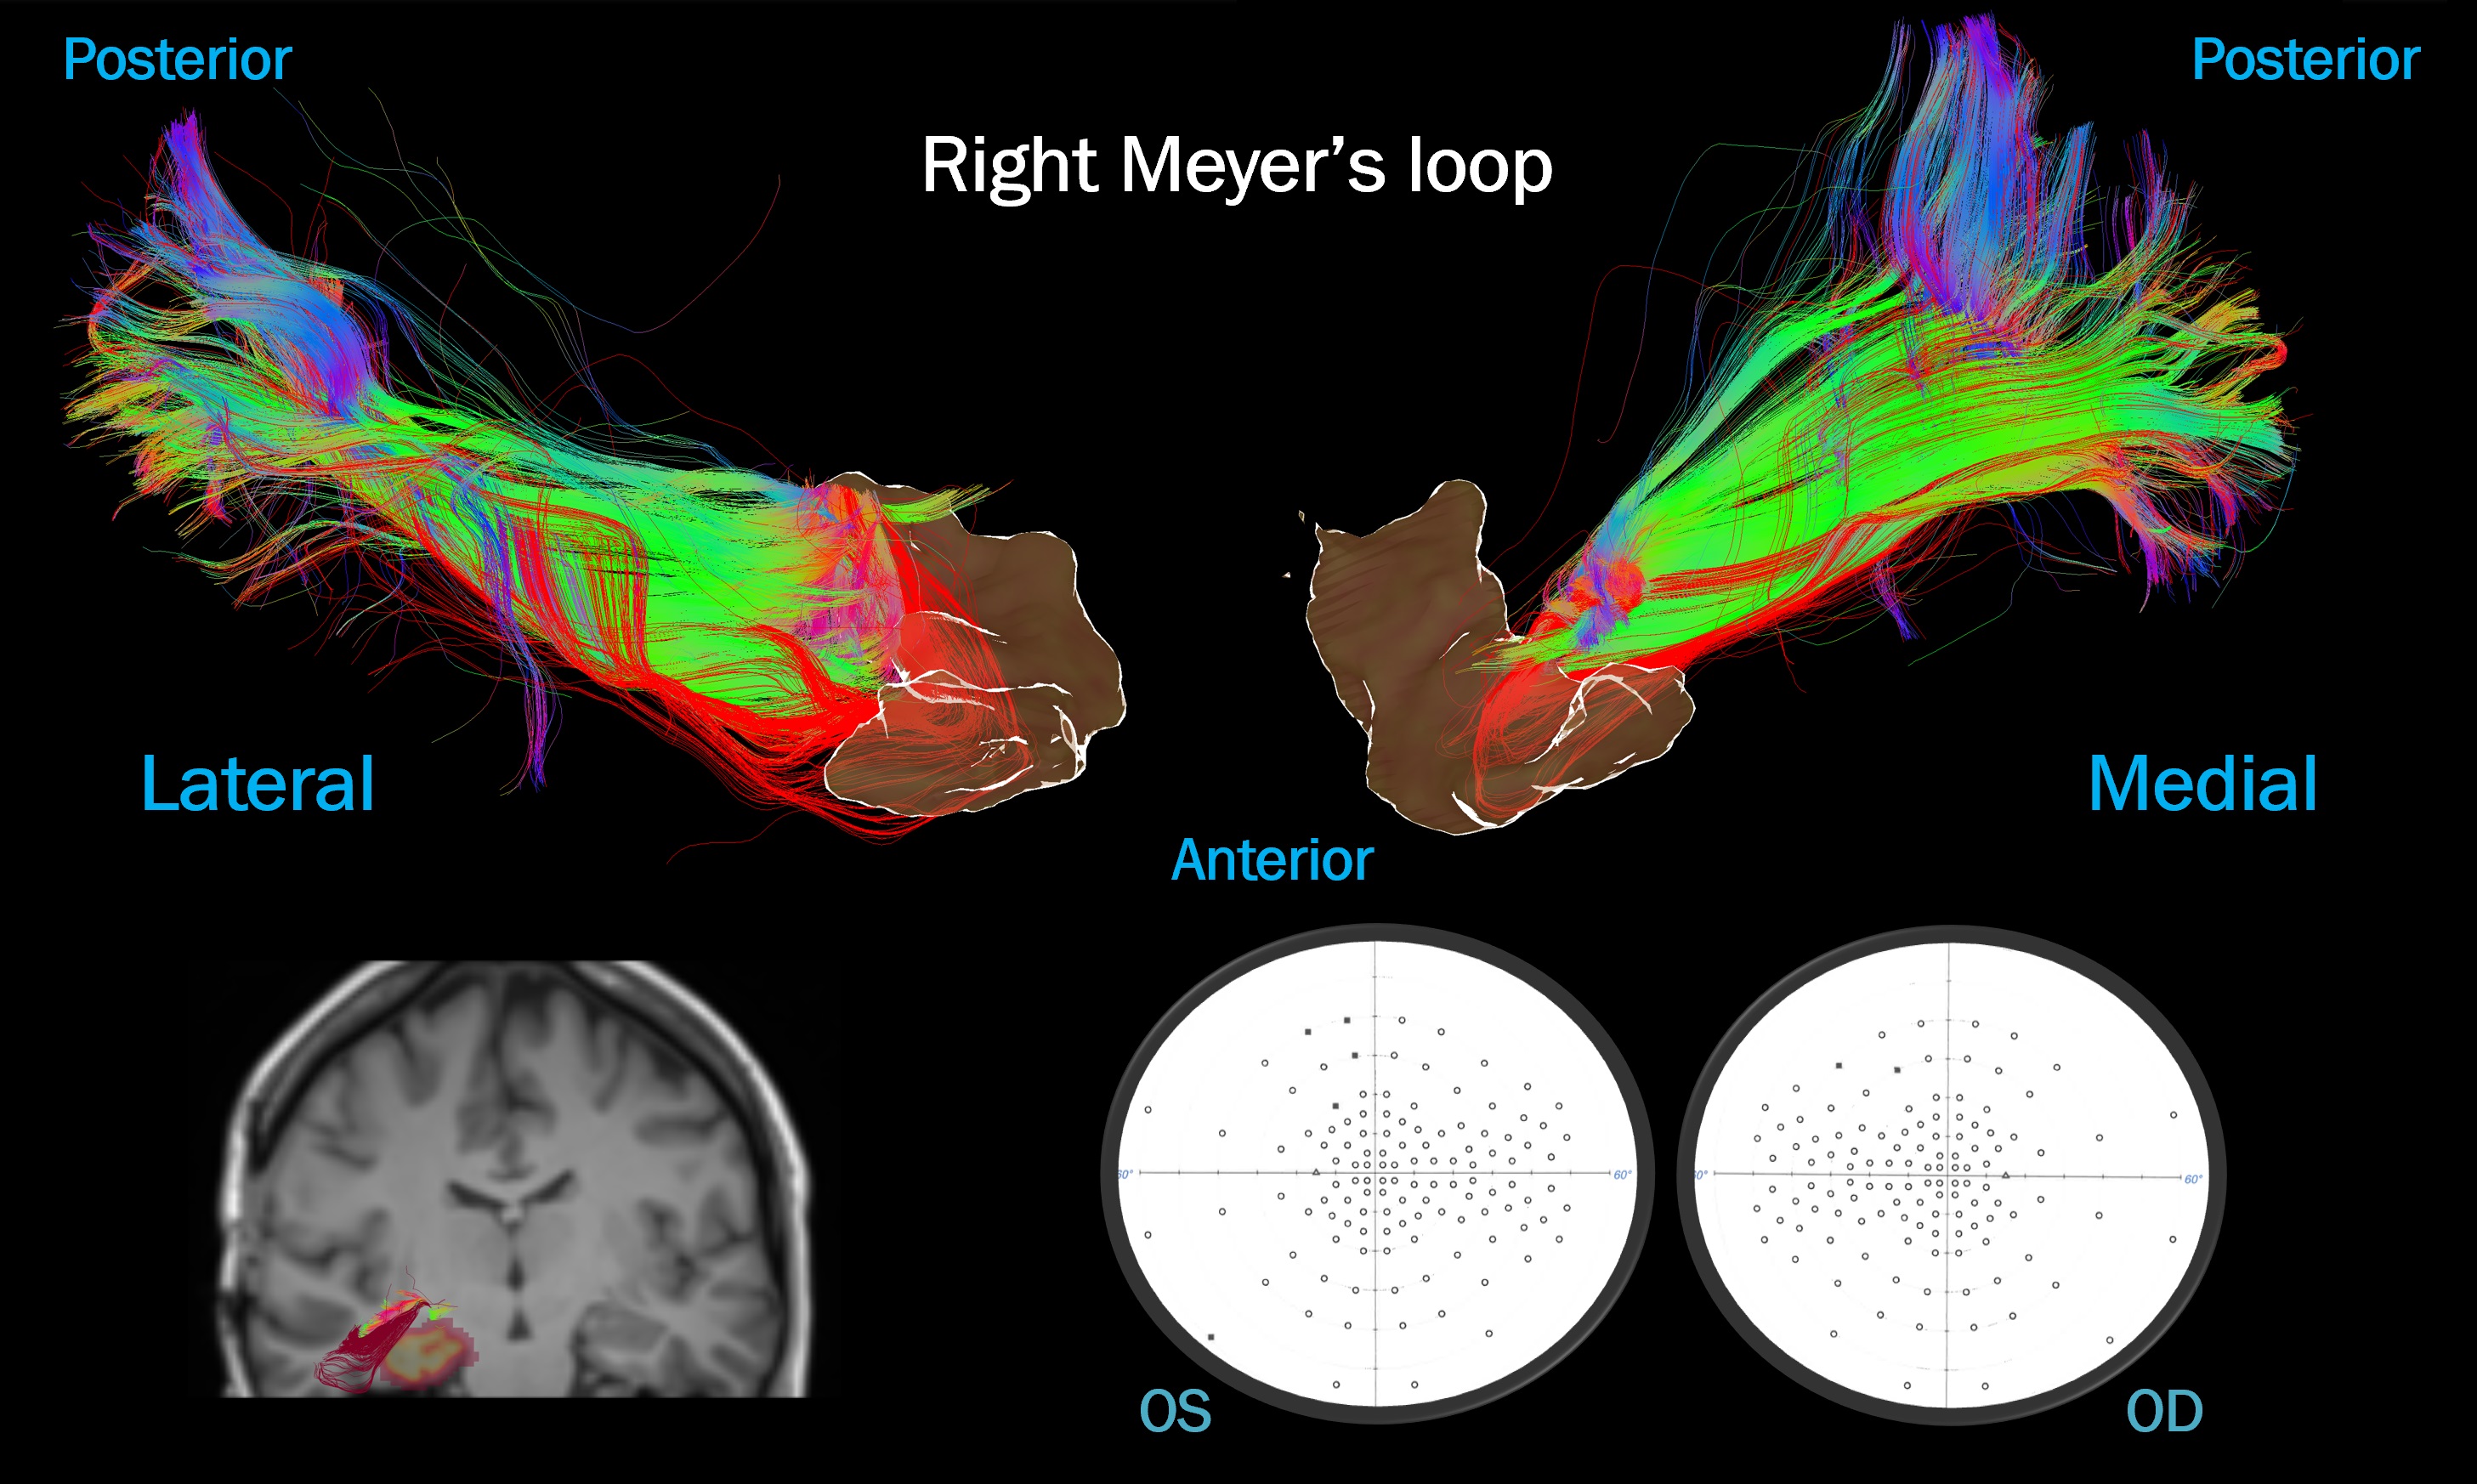
Case
2: mesial temporal resection. A thick bundle of “damaged” streamlines (in red),
correlating with contralateral quadrantanopia. Top: ML viewed laterally and
medially next to an isosurface of the surgical mask. Bottom left: surgical
cavity (yellow) over the post-op T1 next to the pre-op ML. Bottom right: visual
fields.
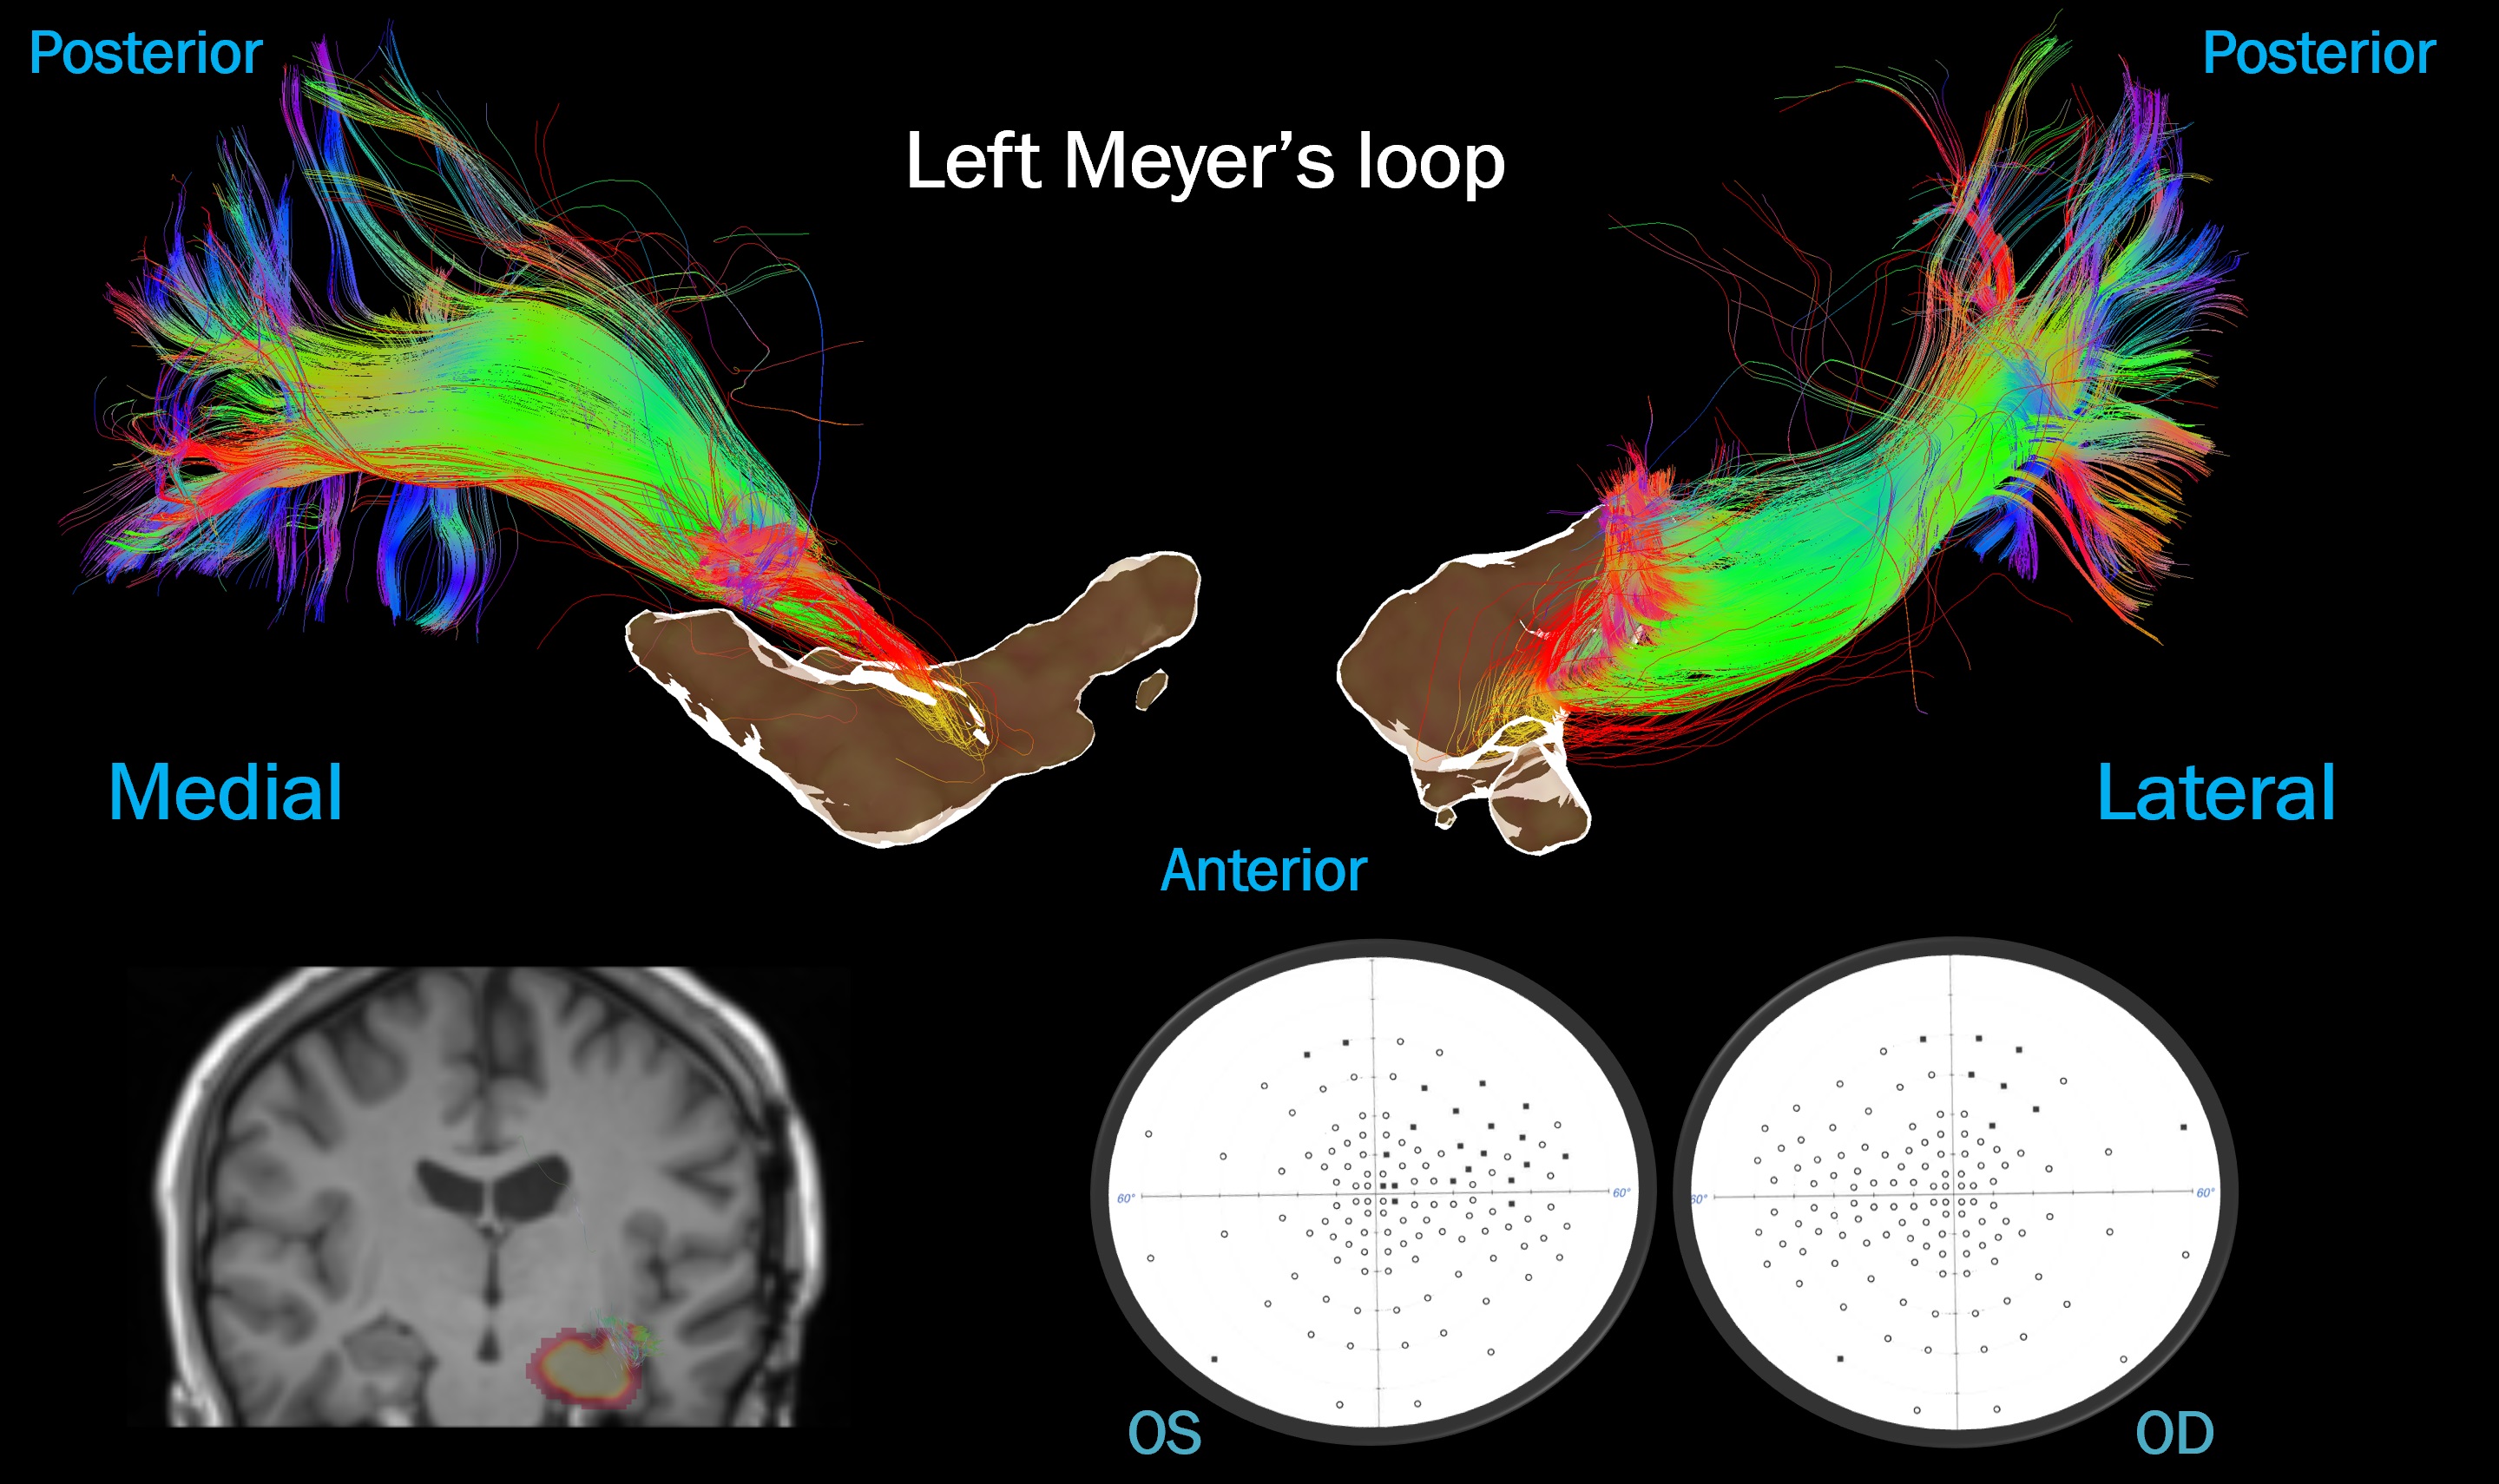
Case 3: mesial temporal resection. A few “damaged”
streamlines (in red), correlating with minimal visual field deficit. Top: ML
viewed medially and laterally next to an isosurface of the surgical mask.
Bottom left: surgical cavity (yellow) over the post-op T1 next to the pre-op
ML. Bottom right: visual fields.
Case 4: mesial temporal resection. A substantial number of
diffusely distributed “damaged” streamlines (in red), contrasting with intact visual
fields. Top: ML viewed laterally and medially next to an isosurface of the
surgical mask. Bottom left: surgical cavity (yellow) over the post-op T1 next
to the pre-op ML. Bottom right: visual fields.