1579
Lesion distribution and substrate in Type 1 Myotonic Dystrophy: comparison with Multiple Sclerosis1Brighton and Sussex University Hospitals Trust, Brighton, United Kingdom, 2Neuroimaging Laboratory, Santa Lucia Foundation, Rome, Italy, 3Department of Vascular and Endovascular Surgery, University of Florence, Florence, Italy, 4University of, Rome, Italy, 5Department of Geriatrics, Orthopedics and Neuroscience, Catholic University of Sacred Heart Fondazione Policlinico Universitario A. Gemelli IRCCS, Rome, Italy, 6UOC Neurologia e Neurofisiopatologia, AO San Camillo Forlanini, Rome, Italy, 7Department of Neurorehabilitation Sciences, Casa di Cura Policlinico, Milan, Italy, 8Department of Neuroscience, University of Sussex, Brighton, United Kingdom
Synopsis
This study compares the lesion distribution and substrate (by means of quantitative MRI) between patients with type 1 Myotonic Dystrophy (DM1) and patients with Multiple Sclerosis (MS). The main differences in anatomical distribution are the prevalence of anterior temporal lobe lesions in the former group, in the absence of cerebellum and brainstem lesions. MRI markers of myelination were not different between the normal appearing white matter of DM1 and healthy controls. By contrast they were reduced in lesions, but larger than in MS lesions.
Introduction
Myotonic Dystrophy type 1 (DM1) is an autosomal dominant condition caused by expansion of the CTG triplet repeats within the myotonic dystrophy protein of the kinase (DMPK) gene [1]. The central nervous system is known to be involved in the disease, with multiple symptoms including cognitive impairment [2]. A typical feature of DM1 is the presence of widespread white matter lesions, whose total volume is associated with CTG triplet expansion [3]. The aim of this study was to characterize the distribution and pathological substrate of these lesions using quantitative magnetization transfer MRI, and comparing data from DM1 patients with those from patients with multiple sclerosis (MS).Methods
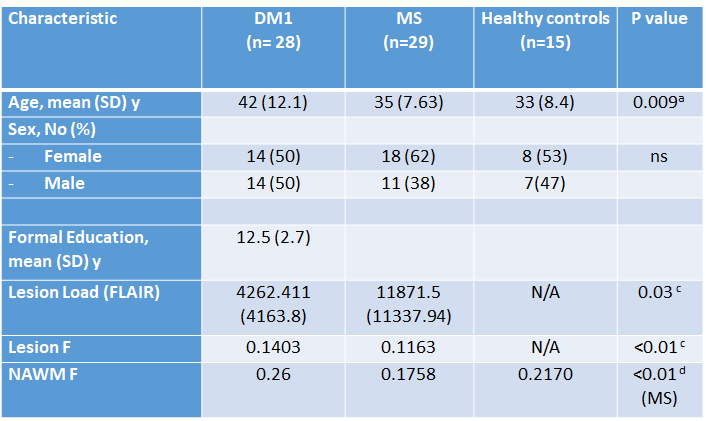
Data were collected from 28 patients with DM1 (mean age [SD]=42 [12.1] years, M/F=14/14), 29 patients with relapsing remitting MS (mean age [SD] =35 [7.63] years, M/F=11/18), and 15 healthy controls (mean age [SD] =33 [8.4] years, M/F=7/8). All participants received an MRI scan at 3T, including diffusion-weighted MRI (b=1000 smm-2, 60 diffusion directions, 7 b=0 images) and quantitative magnetization transfer MRI [4]. In addition, dual-echo and FLAIR scans were collected, as well as MPRAGE. Blood samples were taken from DM1 patients to detect expanded alleles. The volume of white matter lesions was assessed using a semi-automated local thresholding contouring software (Jim 7.0, Xinapse Systems) on FLAIR scans. Lesion masks were then created and coregistered with every patient’s MPRAGE. Magnetization transfer data were processed using customized software to yield maps of the pool size ratio (F), known to correlate with myelin content [5]. The MPRAGE scans were segmented using SPM to yield maps of the white matter, thresholded at 0.8. In the presence of lesions a normal appearing white matter (NAWM) mask was obtained by subtracting the lesion mask from the white matter mask. The average F was computed within lesions and NAWM for every participant. The lesion masks were warped into MNI space and lesion probability maps were obtained for each patient group. The total lesion load, and the tissue-specific mean F were compared between groups.Results
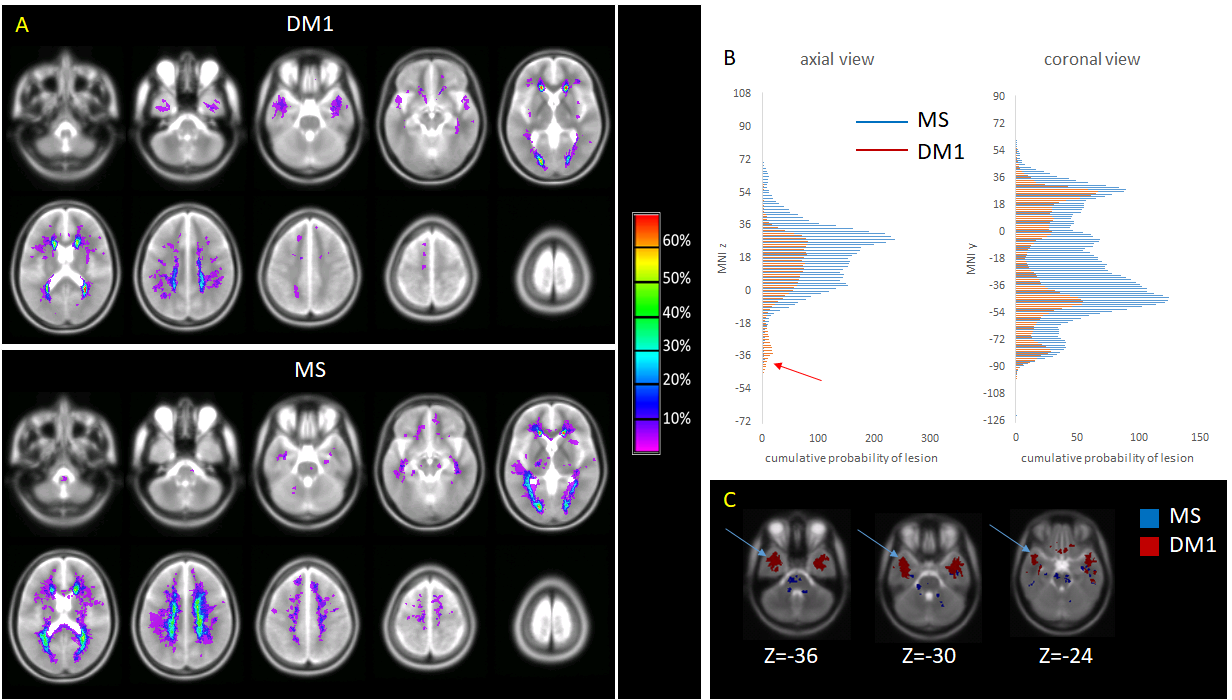
Demographic and quantitative MRI results are summarized in Table 1. No macroscopic lesions were identified in the healthy control group. The participants in the DM1 group were slightly older than the other 2 groups. The mean lesion volume was higher in MS than DM1. Fig 1 shows the lesion distribution in the 2 patient groups. Although the lesion volume was smaller in DM1, the distribution was similar with the following exceptions: DM1 patients did not show any lesion in the cerebellum and brainstem; by contrast they presented higher prevalence of anterior temporal lobe lesions, previously described as a feature in this population [6]. In both groups the mean F of lesions was lower than the NAWM (p<0.01, CI 0.06-0.07), but it was lower in MS than DM1 (p<0.01, CI 0.01-0.04). After adjusting for age and sex, multiple regression analysis showed significant differences between F of the NAWM in the MS group compared to the DM1 (beta 0.45, p<0.01) and control group (beta 0.42, p<0.01). There did not appear to be a significant difference between NAWM in DM1 patients and controls (beta -0.003, p=ns). Patient with MS were found to have significantly lower F compared to the DM1 cohort (beta -0.28, p<0.01), when adjusted for age and sex.Discussion
Our study shows that white matter lesion distribution in people with DM1 overlaps with that typical of MS. Nevertheless, it highlights a greater distribution in the temporal lobe regions in DM1, but sparing the cerebellum and brainstem. This is also the first study to use quantitative magnetization transfer to investigate microscopic changes occurring within and outside lesions in DM1. We demonstrate, that the while the NAWM is relatively spared in DM1 patients, F values within the lesions are significantly reduced, suggesting a loss of myelin density. Nevertheless, the mean F is lower in MS lesions than DM1 lesions, indicating a lesser degree of demyelination in the latter. Analysis of the diffusion MRI indices will provide additional information towards interpreting these changes, comparing them against evidence from animal models [7]. Future work will also involve comparing quantitative MRI parameters of temporal lesions with those of lesions located in other areas of the brain. Previous studies have described the presence of RNA nuclear foci, containing abnormally expanded CUG repeats in the brain tissue of patients with DM1, which may account for disruption of the white matter architecture [8]. In addition to RNA foci, neurofibrillary tangles are found in the brains of patients with myotonic dystrophy type 1 and 2 [9]. It has been shown that the number of Tau inclusions are less in DM1 when compared to Alzheimer’s and other neurodegenerative disease, but greater than age matched healthy controls [10]. Our results provide further evidence for a need to compare histology and imaging using new MRI techniques in DM1 patients, in order to further our understanding of the underlying disease process contributing to white matter disease.Acknowledgements
No acknowledgement found.References
1. Brook, J.D., et al., Molecular basis of myotonic dystrophy: expansion of a trinucleotide (CTG) repeat at the 3' end of a transcript encoding a protein kinase family member. Cell, 1992. 69(2): p. 385. 2. Meola, G. and R. Cardani, Myotonic dystrophies: An update on clinical aspects, genetic, pathology, and molecular pathomechanisms. Biochim Biophys Acta, 2015. 1852(4): p. 594-606.
3. Serra, L., Petrucci, A., Spano, B et al, How genetics affects the brain to produce higher level dysfuctions in myotonic dystrophy type 1. Functional Neurology, 2015. 30(1): p. 21-31.
4. Giulietti, G., et al., Quantitative magnetization transfer provides information complementary to grey matter atrophy in Alzheimer's disease brains. Neuroimage, 2012. 59(2): p. 1114-22.
5. Turati, L., et al., In vivo quantitative magnetization transfer imaging correlates with histology during de- and remyelination in cuprizone-treated mice. NMR Biomed, 2015. 28(3): p. 327-37.
6. Ogata, A., et al., Anterior temporal white matter lesions in myotonic dystrophy with intellectual impairment: an MRI and neuropathological study. Neuroradiology, 1998. 40(7): p. 411-5.
7. Braz, S.O., Acquaire, J., Gourdon, G., Gomes-Pereira, M. Of Mice and Men: Advances in the Understanding of Neuromuscular Aspects of Myotonic Dystrophy. Front Neurol, 2018. 9:p. 519.
8. Jiang, H., et al., Myotonic dystrophy type 1 is associated with nuclear foci of mutant RNA, sequestration of muscleblind proteins and deregulated alternative splicing in neurons. Hum Mol Genet, 2004. 13(24): p. 3079-88.
9. Yoshimura, N., Otake, M., Igarashi, K., Matsunaga, M., Takebe, K., and Kudo, H. , Topography of Alzheimer’s neurofibrillary change distribution in myotonic dystrophy. Clin Neuropathol. , 1990(9): p. 234-239.
10. Vermersch, P., et al., Specific tau variants in the brains of patients with myotonic dystrophy. Neurology, 1996. 47(3): p. 711-7.
Figures