1578
Does quantitative ultra-high-field magnetic resonance imaging have added value in the characterization of Friedreich’s ataxia?1Medical Physics in Radiology, German Cancer Research Center (DKFZ), Heidelberg, Germany, 2Department of Neuroradiology, Medical University of Innsbruck, Innsbruck, Austria, 3Neuroimaging Core Facility, Medical University of Innsbruck, Innsbruck, Austria, 4Faculty of Physics and Astronomy, Heidelberg University, Heidelberg, Germany, 5Department of Neurology, Medical University of Innsbruck, Innsbruck, Austria, 6Faculty of Medicine, Heidelberg University, Heidelberg, Germany
Synopsis
Friedreich’s ataxia is a rare disease involving degenerative processes within white matter fiber tracts, spinal nerves, and the cerebellum such as the atrophy of the dentate nuclei. A correlation of patients’ clinical status and white matter atrophy has been shown in MR volumetry studies. This ultra-high-field study assesses the degeneration of fiber tracts throughout the brainstem as well as of the dentate nuclei, the red nuclei, and the substantia nigra in Friedreich’s ataxia with quantitative MR parameters – susceptibility, diffusion anisotropy, and R2 and R1 relaxometry. Statistically significant differences between patients and controls and between disease characteristics were found.
INTRODUCTION
Despite the fact that Friedreich’s ataxia (FRDA) is a rare disease, it is the most common inherited ataxia, presenting with early onset of clinical manifestations.1 White matter fiber bundle atrophy2,3 and decreased diffusion anisotropy4 values in several fiber bundles throughout the brain stem and in the cerebellum correlate with disease characteristics such as the age at onset, disease duration, and GAA triplet repeats on the gene that is affected by FRDA. Moreover, iron accumulation in the red nuclei and the dentate nuclei has been shown5 as well as atrophy of dentate nuclei6. This study assesses whether quantitative ultra-high field MRI has an additional value for disease characterization in FRDA.METHODS
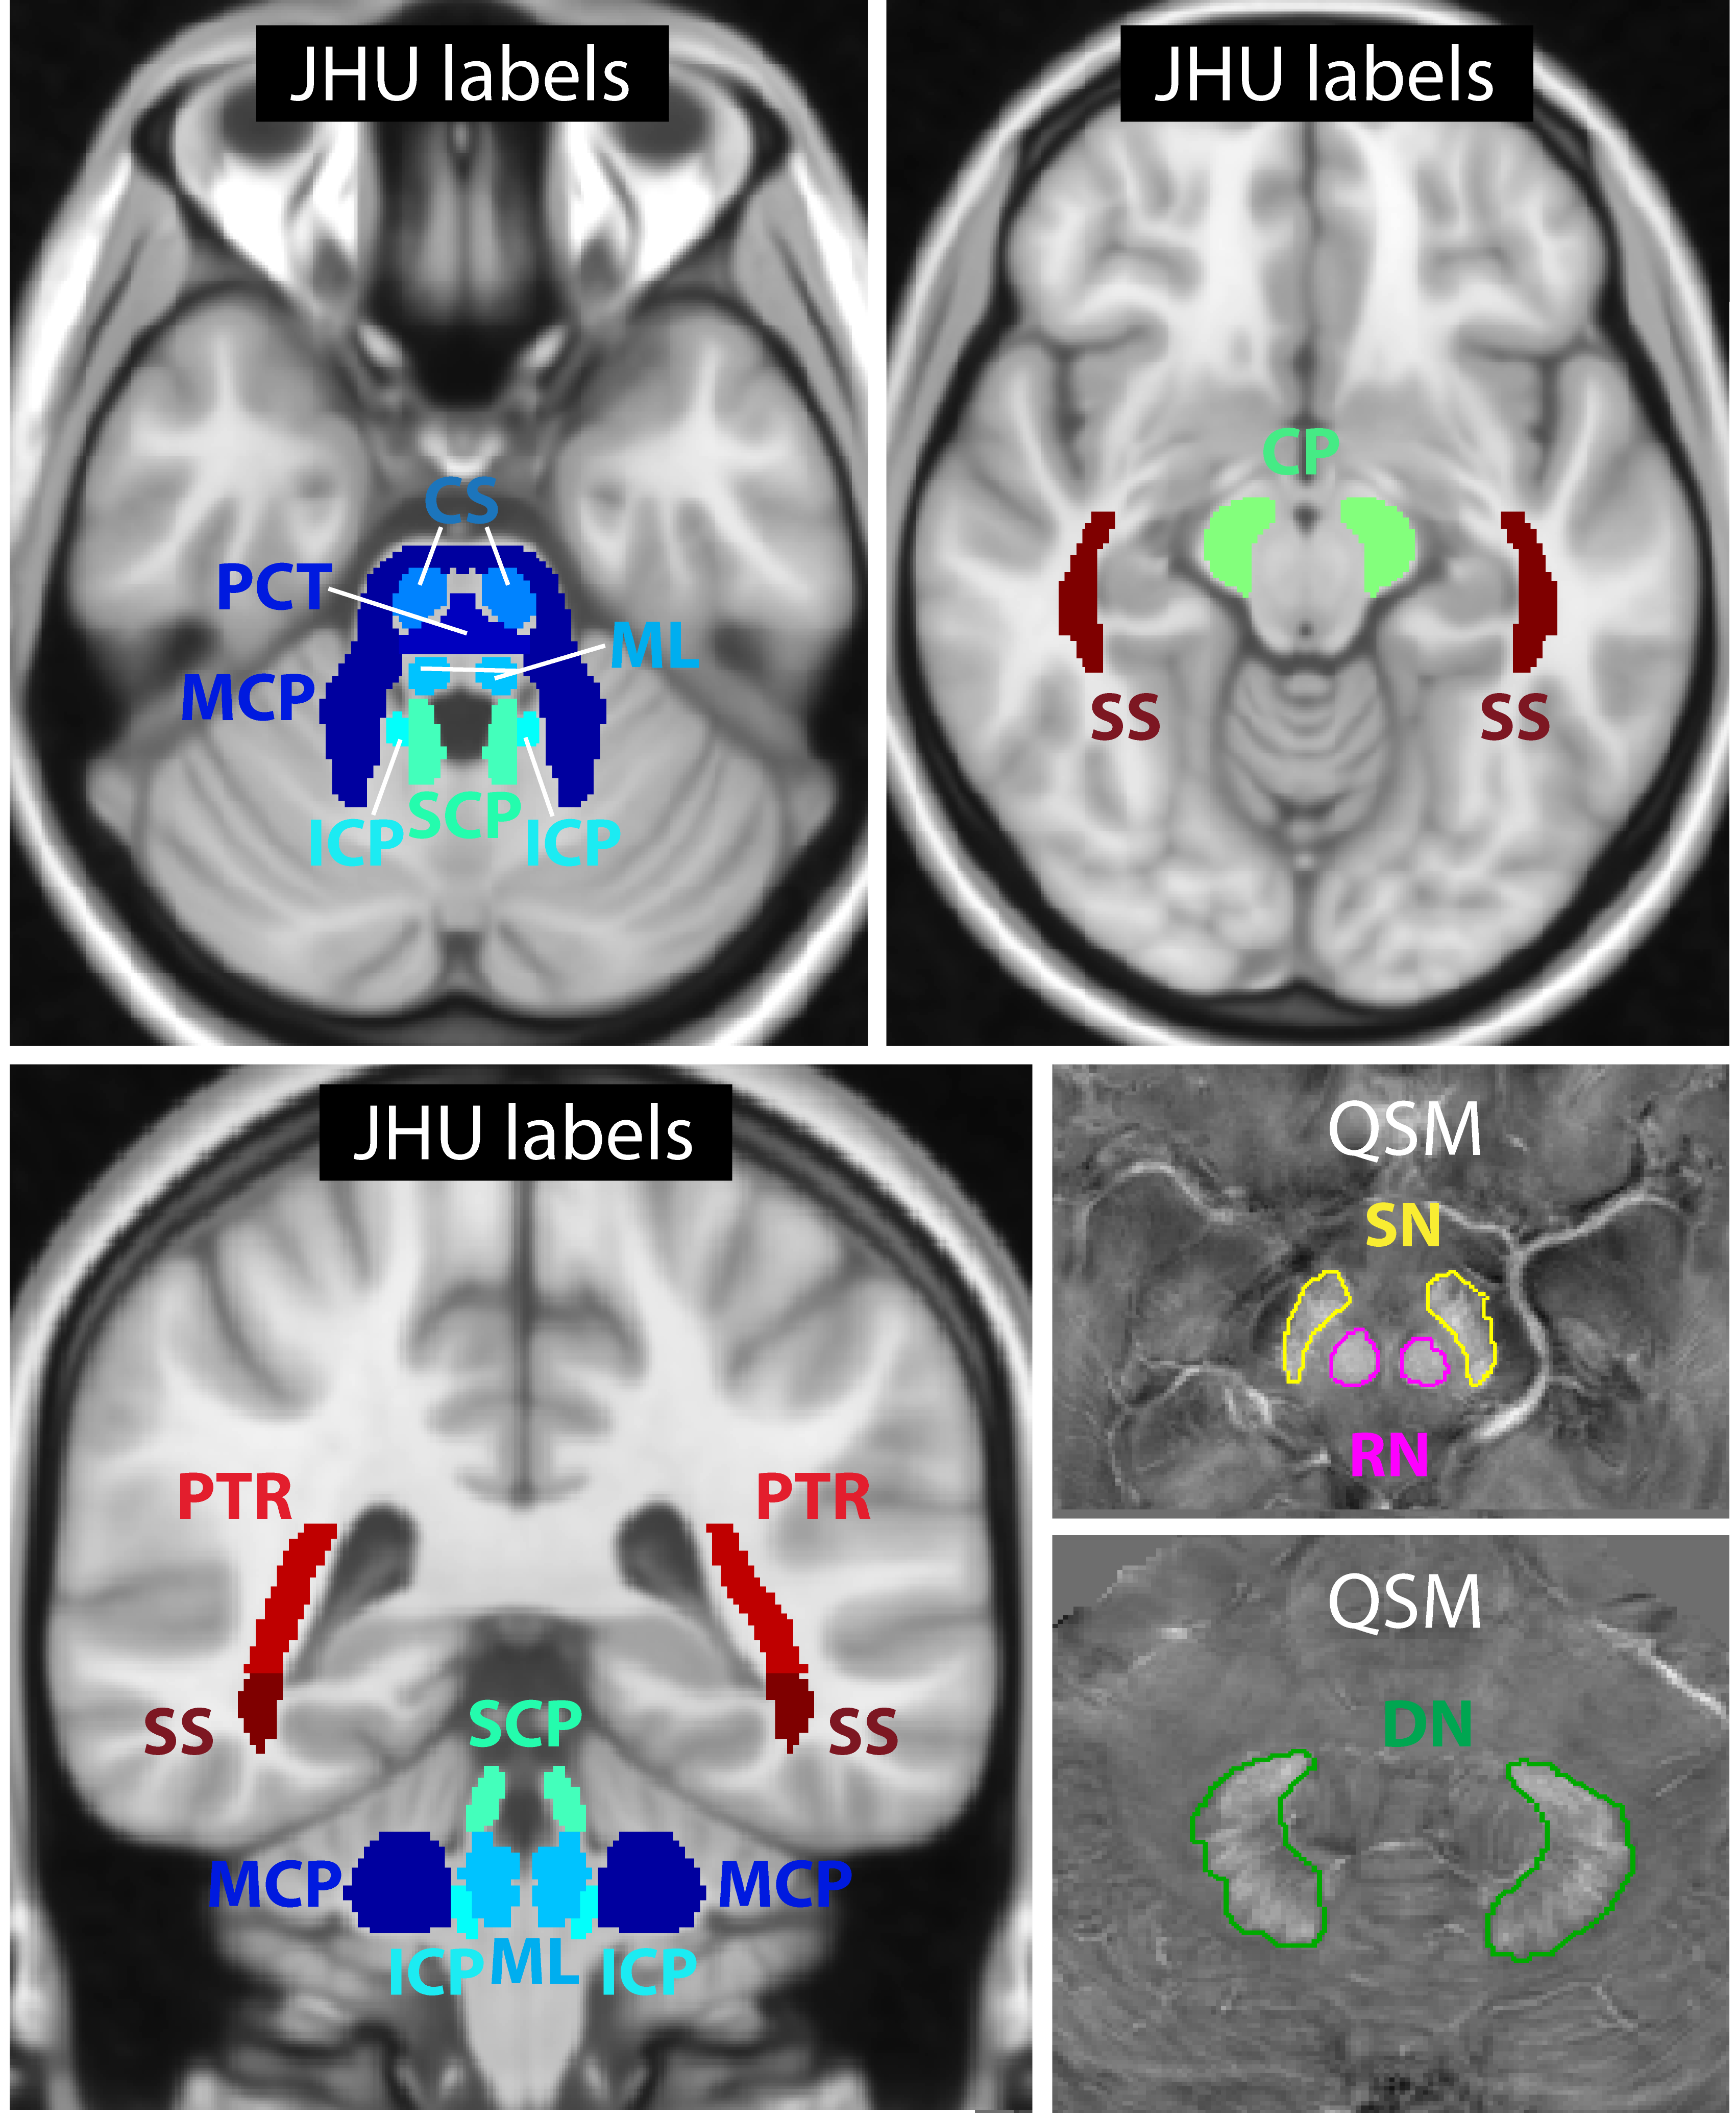
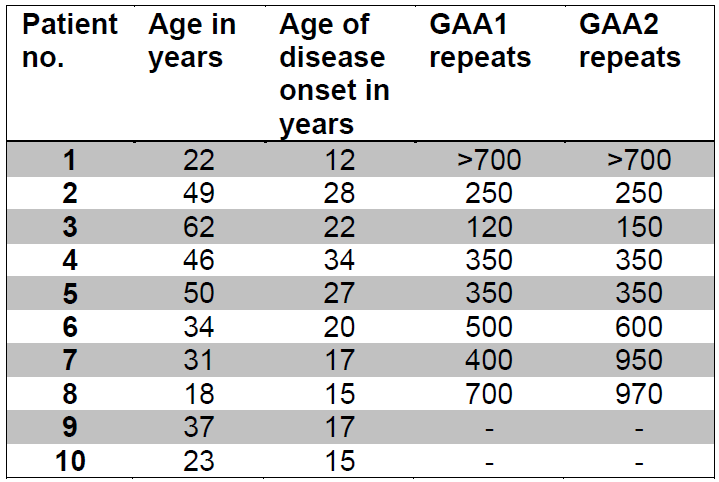
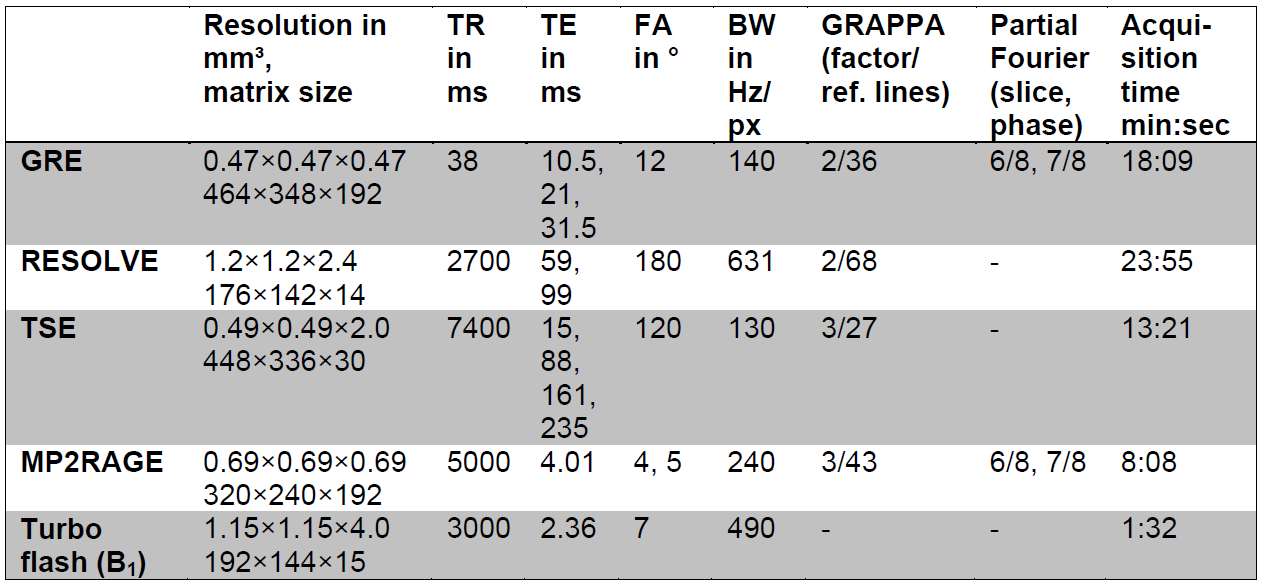
This study was conducted in accordance with the Declaration of Helsinki. Institutional review board approval was obtained and all subjects provided written informed consent. Ten genetically confirmed Friedreich’s ataxia patients (mean age 37 ± 14 years; four female) and ten age- and gender-matched healthy controls (mean age 37 ± 14 years; four female) were included in the study. Table 1 summarizes the patient cohort. All subjects were scanned on a 7 T whole-body MR system (Magnetom 7 T, Siemens Healthcare, Germany) with a 8Tx/32Rx-channel head coil (Nova Medical Inc., Wakefield, MA, USA) using an in-house-constructed Butler matrix. Three-dimensional gradient echo (GRE), multi-echo turbo spin echo (ME-TSE), diffusion tensor, MP2RAGE, and turbo flash data for B1 mapping were acquired and processed for susceptibility map generation and dictionary-based T2 mapping7 as in a previous study8. The sequence parameters are shown in Table 2. For T1 mapping and diffusion fractional anisotropy, vendor-provided maps were used. R2 and R1 was calculated from T1 and T2 maps (R=1/T).Volumes of interest (VOIs) (see Figure 1) were generated for nine fiber tracts by registering Johns Hopkins University (JHU) atlas labels9 to the MP2RAGE data of this study with FSL-FLIRT10 and FSL-FNIRT11. For dentate nuclei, red nuclei, and substantia nigra, VOIs were generated manually on the susceptibility maps using the Medical Imaging Interaction Toolkit (MITK)12,13. All VOIs were subsequently registered to the other imaging contrasts with FSL-FLIRT and automatically corrected for registration errors by thresholding to exclude CSF pixels in the case of T1 and T2 maps and by using a CSF mask in the case of susceptibility maps that was generated with FSL-FAST14. The automatic VOI correction was followed by a manual VOI assessment and correction if necessary. Moreover, the volume of each region was calculated using these VOIs. Differences between the patients and the healthy controls were assessed using a Wilcox ranksum test in Matlab, and correlations with clinical parameters (Table 1) were assessed using the Spearman correlation coefficient. A p-value of less than 0.05 was considered statistically significant.
RESULTS
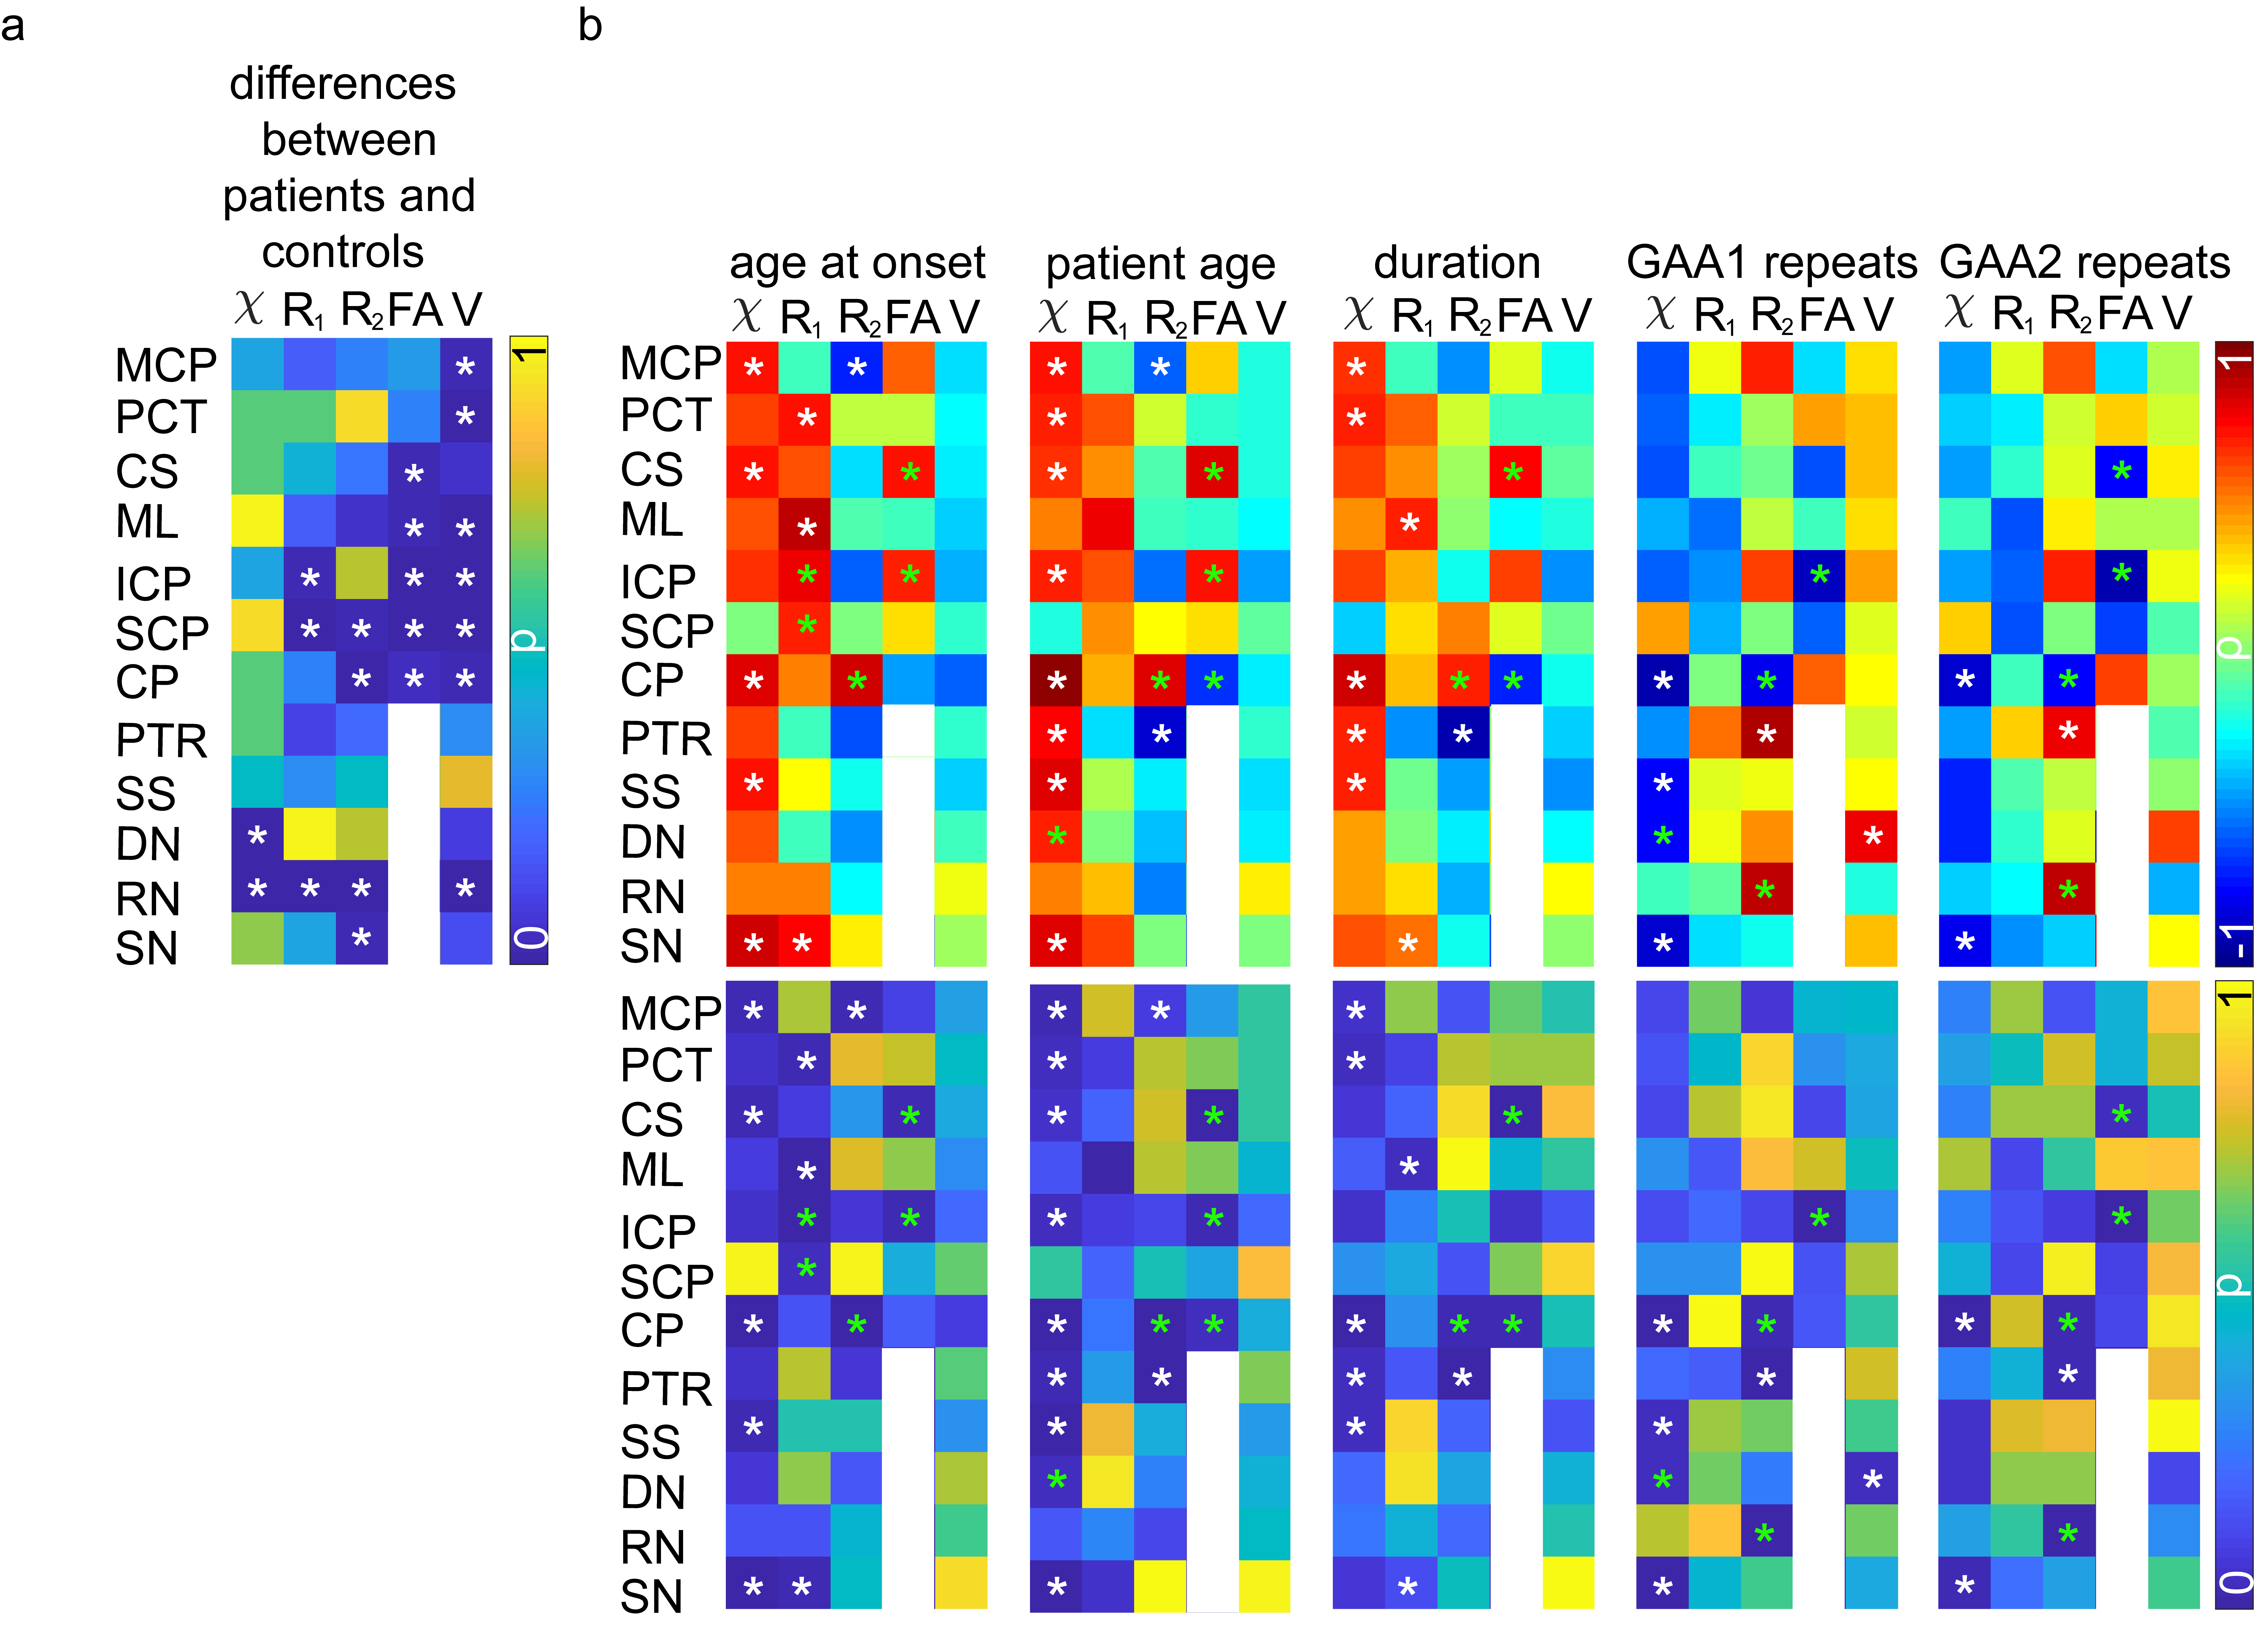
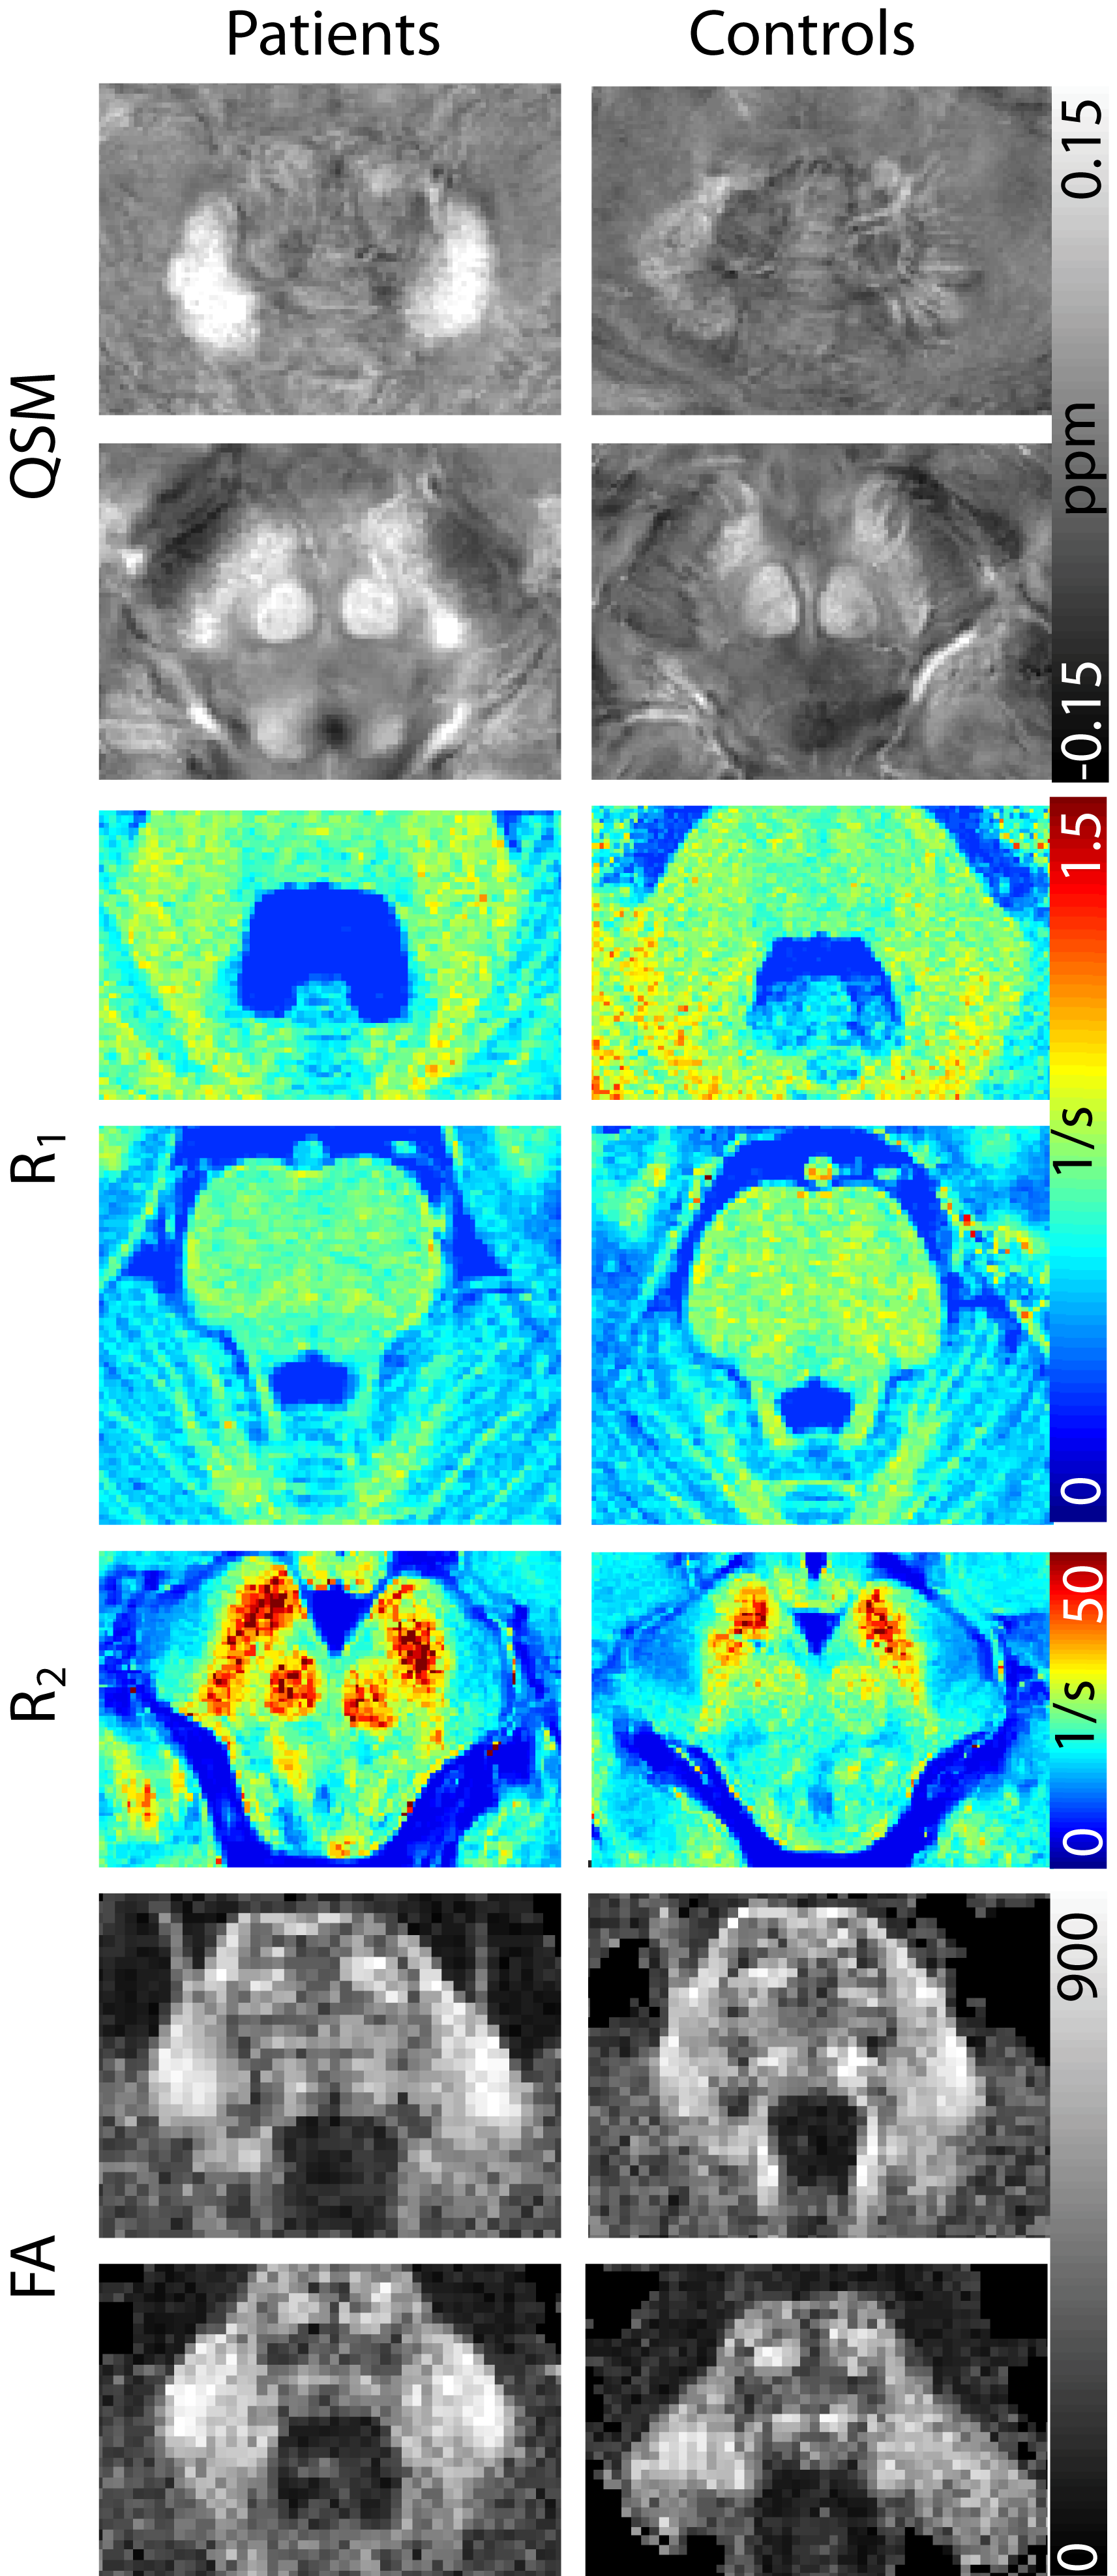
Figure 2a shows the p-values for all brain regions and imaging contrasts as well as the VOI volumes for which the differences between FRDA patients and healthy controls were assessed. In Figure 2b, the patient characteristics (Table 1) were correlated with the susceptibility, R1 and R2 values, the diffusion anisotropy, and the VOI volumes in the different VOIs. While the volume of many regions was significantly different between patients and healthy controls, there no correlation was found between VOI volume and disease characteristics. The correlations found between susceptibility, R1 and R2 values, diffusion anisotropy, and age of onset/ disease duration as well as patient age are similar.Figure 3 show representative axial slices of susceptibility, R1, R2 and fractional anisotropy maps for different brain regions in which significant differences were found between FRDA patients and healthy controls.
DISCUSSION AND CONCLUSION
Quantitative MRI could reveal significant differences between FRDA patients and healthy controls. The differences in diffusion fractional anisotropy in several white matter fiber tracts4 as well as the susceptibility differences for dentate nuclei5 were in accordance with previous findings in the literature. However, in contrast to other studies, there was no correlation found for the volume of any structure investigated except between the dentate nuclei and the GAA1 repeats, which was positive, therefore contradicting previous findings. Because of the limited patient number and the fact that older patients with longer disease duration were also the patients with fewer GAA repeats (which correlates with disease severity), as well as the fact that quantitative MRI values in some brain regions are age dependent, a bias in this study could exist, which is also indicated by the patient age correlations in Figure 2. Nonetheless, these quantitative MRI methods may provide valuable biomarkers to assess the disease course and potentially the prognosis of Friedreich’s ataxia.Acknowledgements
The provision of the ASPIRE gradient echo sequence and corresponding ICE program for coil combination of the 7 T GRE data by Korbinian Eckstein and Simon D. Robinson is kindly acknowledged.References
1. Koeppen AH. Friedreich’s ataxia: Pathology, pathogenesis, and molecular genetics. J Neurol Sci. 2011; 303(1-2): 1–12.
2. Pagani E, Ginestroni A, Della Nave R, Agosta F, Salvi F, De Michele G, Piacentini S, Filippi M, Mascalchi M. Assessment of brain white matter fiber bundle atrophy in patients with Friedreich ataxia. Radiology. 2010 ;255(3):882-9.
3. Akhlaghi H, Corben L, Georgiou-Karistianis N, Bradshaw J, Storey E, Delatycki MB, Egan GF. Superior Cerebellar Peduncle Atrophy in Friedreich’s Ataxia Correlates with Disease Symptoms. Cerebellum 2011;10:81-87.
4. Della Nave R, Ginestroni A, Tessa C, Salvatore E, Bartolomei I, Salvi F, Dotti MT, De Michele G, Piacentini S, Mascalchia M. Brain white matter tracts degeneration in Friedreich ataxia. An in vivo MRI study using tract-based spatial statistics and voxel-based morphometry. Neuroimage 2008, 40:19-25.
5. Ward P, Harding IH, Raniga P, Close TG, Corben LA, Delatycki MB, Stagnitti MR, Storey E , Georgiou-Karistianis N, Egan GF. Magnetic susceptibility of the dentate in a longitudinal study of Friedreich ataxia. ISMRM 2018:3731.
6. Solbach K, Kraff O, Minnerop M, Beck A, Schöls L, Gizewski ER, Ladd ME, Timmann D. Cerebellar pathology in Friedreich‘s ataxia: Atrophied dentate nuclei with normal iron content. NeuroImage: Clinical 2014,6:93–99.
7. Emmerich J, Flassbeck F, Schmidt S, Bachert P, Ladd ME, Straub S. Rapid and accurate dictionary‐based T2 mapping from multi‐echo turbo spin echo data at 7 Tesla. J. Magn. Reson. Imaging 2018. doi:10.1002/jmri.26516. 8. Straub S, Knowles BR, Flassbeck S, Steiger R, Ladd ME, Gizewski ER. Mapping the human brainstem: Brain nuclei and fiber tracts at 3 T and 7 T. NMR Biomed 2019;32(9):e4118.
9. Mori S, Oishi K, Jiang H, Jiang L, Li X, Akhter K, Hua K, Faria AV, Mahmood A, Woods R, Toga AW, Pike GB, Neto PR, Evans A, Zhang J, Huang H, Miller MI, van Zijl P, Mazziotta J. Stereotaxic white matter atlas based on diffusion tensor imaging in an ICBM template. Neuroimage 2008 ;40(2):570–582.
10. M. Jenkinson, Smith S. Medical Image Analysis 2001;5(2):143-156.
11. Andersson JLR, Jenkinson M, Smith S. Non-linear registration, aka spatial normalisation. FMRIB technical report TR07JA2 2010.
12. Maleike D, Nolden M, Meinzer HP, Wolf I. Interactive segmentation framework of the Medical Imaging Interaction Toolkit. Comput Meth Prog Bio 2009;96(1):72-83.
13. Nolden M, Zelzer S, Seitel A, Wald D, Müller M, Franz AM, Maleike D, Fangerau M, Baumhauer M, Maier-Hein L, Maier-Hein KH, Meinzer HP and Wolf I, The Medical Imaging Interaction Toolkit: challenges and advances, Int J Comput Assist Radiol Surg. 2013;8(4):607-620.
14. Zhang Y, Brady M, Smith S. Segmentation of brain MR images through a hidden Markov random field model and the expectation-maximization algorithm. IEEE Trans Med Imag 2001;20(1):45-57.
Figures