1575
The white matter impairment of Gordon-Holmes syndromes: a tracking based analysis
Lei Wei1, KeLiang Chen2, and He Wang1,3
1Institute of Science and Technology for Brain-Inspired Intelligence, Fudan University, Shanghai, China, shanghai, China, 2Department of Neurology and Institute of Neurology, Huashan Hospital, Shanghai Medical College, Fudan University, Shanghai, China, ShangHai, China, 3Human Phenome Institute, Fudan University, Shanghai, China, Shanghai, China
1Institute of Science and Technology for Brain-Inspired Intelligence, Fudan University, Shanghai, China, shanghai, China, 2Department of Neurology and Institute of Neurology, Huashan Hospital, Shanghai Medical College, Fudan University, Shanghai, China, ShangHai, China, 3Human Phenome Institute, Fudan University, Shanghai, China, Shanghai, China
Synopsis
The Gordon-Holmes syndrome is an rare condiion caused by mutation of genes, few study has reported the finding of GHS by neuroimaging, but several studies has found the white matter abnormal in GHS brain. According the tracking based analysis. The different quantitative diffusion parameters suggest the white matter abnormal from different aspects. We firstly iinvestigated the white matter abnormal of GHS in the distribution of each diffusion property.
Introduction
The Gordon-Holmes syndromes (GHS) is a rare condition characterized by cerebellar ataxia/atrophy and reproductive problems, such as the hypogonadotropic, cognitive decline, dementia, and movement disorders1. GHS can be caused by mutations in genes of RNF216, PNPLA6, OTUD4, STUB1, and POLR3A/3B/1C2. The previous study has reported the whole brain white matter hyperintensity and global white matter integrity loss in GHS patients3. In our present study, two patients were diagnosed with GHS, and the tracking based analysis was used to determine the specific white matter pathway alteration quantitatively.Methods
MRI acquisition and participants MRI data were acquired on a 3T scanner (Simens Prisma). The DTI data was scanning with simultaneous multislice (SMS) imaging techniques, totally 90 diffusion directions (b value =1500,3000 s/mm2) and 10 b0 image was acquired with an isotropic 1.5mm resolution. Two patients and five age-matched healthy controls were included in our study. Patient 1 (male, 35 years old) presented with onset slurring and slow speech, developed cerebellar syndrome and cognitive impairment, with a history of azoospermia at age of 28. Screening of patient’s DNA for genes related to neurological disease revealed one novel homozygous nonsense variant in gene RNF216, c.1948G>T; p.E650X. Patient 2 (female, 32 years old) started to choreatic movements of both hands, slowly progressing to head, face, and four extremities, with prominent cognitive deterioration. We found a homozygous deletion on exon 2 of RNF216. White matter lesions in cerebral hemispheres and brainstem, cerebellar atrophy and low gonadotropin serum levels could be demonstrated in both patients. DTI deterministic tractography Firstly, the diffusion data were reconstructed in the MNI space using q-space diffeomorphic reconstruction4 to obtain the spin distribution function. A deterministic fiber tracking algorithm was used5. The anisotropy threshold was 0.2. The angular threshold was 60 degrees. The step size was 0.25 mm. Tracks with the length shorter than 30 or longer than 300 mm were discarded. A total of 50000 seeds were placed for each seed tracking. The anatomy prior to a tractography atlas6 was used to determine the specific tracts. The mean FA, fiber number, axial diffusivity, radial diffusivity were used to investigate the GHS patients' white matter characteristics.Results
The T2-weighted image indicates the multiple cerebral white matter and cortical change in the whole brain, such as the cerebellar atrophy and global white matter hyperintensities (figure.1). The tracking based analysis revealed a significant change of diffusion properties in each atlas specific pathway. Here, three main white matter pathways were performed in our present article, including the corpus callosum, cortical striatal pathway, and the arcuate fasciculus (figure.2-4). The changes in diffusion parameters were shown in each pathway (table.1).Discussion
The results indicate the whole brain white matter abnormal in our case. The reduce of FA and increase of RD suggest the impairment of integrity and the demyelination of patients’ white matter. The increase of AD suggests the early aging process has occurred in GHS patients7. The distribution parameter maps may help to locate the possible white matter abnormal origin.Acknowledgements
This work was supported by Shanghai Municipal Science and Technology Major Project (No.2017SHZDZX01), Shanghai Municipal Science and Technology Major Project (No.2018SHZDZX01) and ZJLab, Shanghai Natural Science Foundation (No. 17ZR1401600) and the National Natural Science Foundation of China (No. 81971583).References
1. Topaloglu, A.K., et al., Loss-of-Function Mutations in PNPLA6 Encoding Neuropathy Target Esterase Underlie Pubertal Failure and Neurological Deficits in Gordon Holmes Syndrome. J Clin Endocrinol Metab. 99(10): p. E2067-E2075. 2. Calandra, C.R., et al., Gordon Holmes Syndrome caused by RNF216 novel mutation in 2 Argentinean siblings. Movement Disorders Clinical Practice, 2018. 3. Hayer, S.N., et al., STUB1/CHIP mutations cause Gordon Holmes syndrome as part of a widespread multisystemic neurodegeneration: evidence from four novel mutations. Orphanet Journal of Rare Diseases. 12(1): p. 31. 4. Yeh, F.C. and W.-Y.I. Tseng, NTU-90: A high angular resolution brain atlas constructed by q-space diffeomorphic reconstruction. 58(1): p. 91-99. 5. Fang-Cheng, Y., et al., Deterministic Diffusion Fiber Tracking Improved by Quantitative Anisotropy. Plos One. 8(11): p. e80713-. 6. Fang-Cheng, Y., et al., Population-averaged atlas of the macroscale human structural connectome and its network topology. Neuroimage. 178: p. 57-68. 7. Nir, T.M., et al., Effectiveness of regional DTI measures in distinguishing Alzheimer\"s disease, MCI, and normal aging. Neuroimage Clinical. 3: p. 180-195.Figures
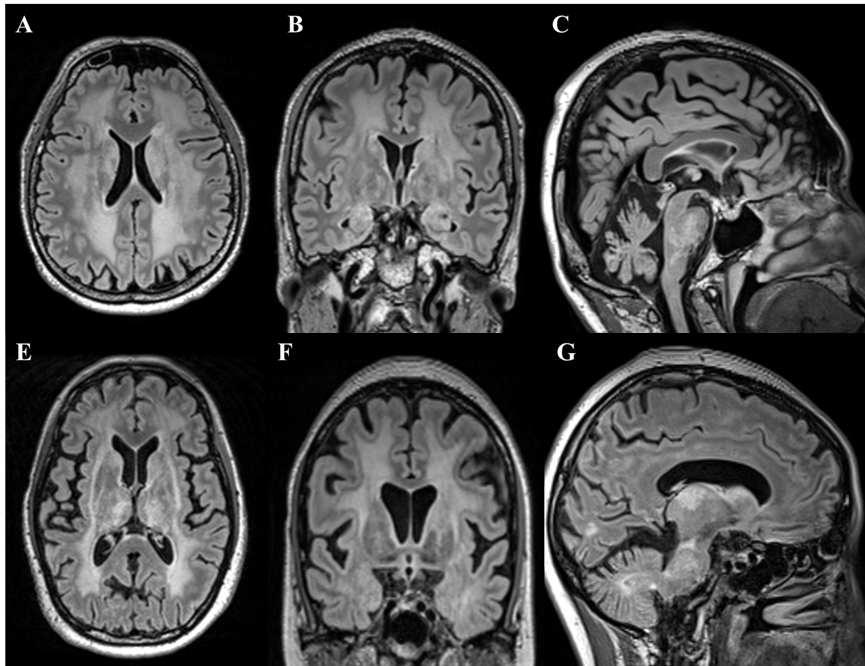
Figure.1 The T2-weighted image of two GHS
patients. White matter lesions in cerebral hemispheres and brainstem,
cerebellar atrophy and low gonadotropin serum levels could be demonstrated in
both patients.
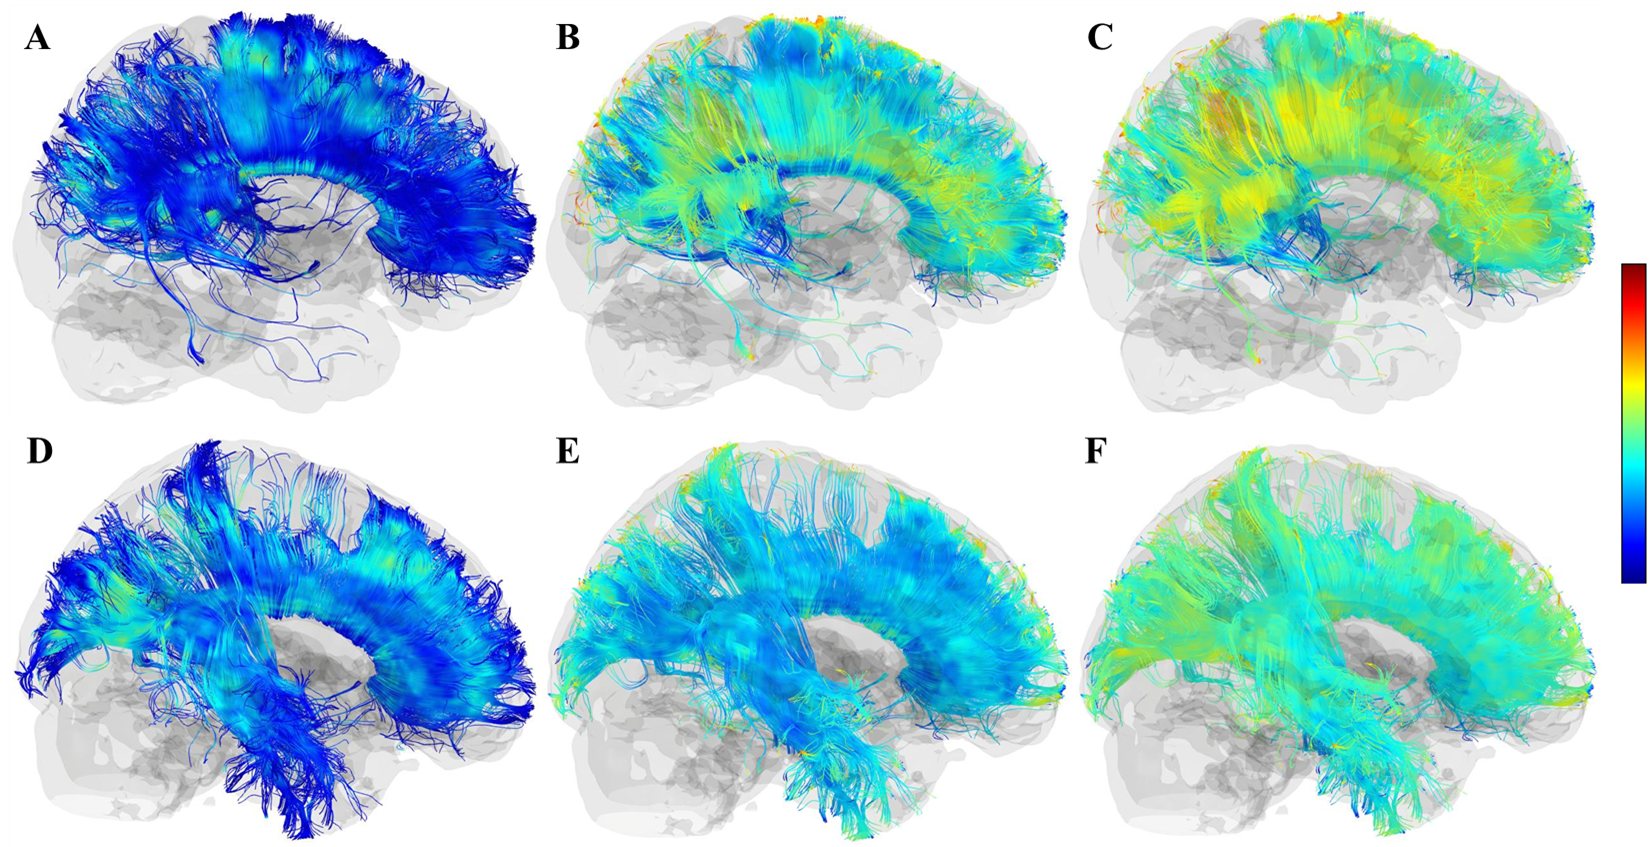
Figure.2 A-C, the FA, RD, AD maps of the corpus
callosum in patient 1. D-F, the FA, AD, RD maps of the corpus callosum in healthy
control. The loss of white matter fiber was found in the whole temporal lobe, and
the reduction of FA was mainly observed in the prefrontal and precuneus, and the
increase of AD and RD were observed in similar regions.
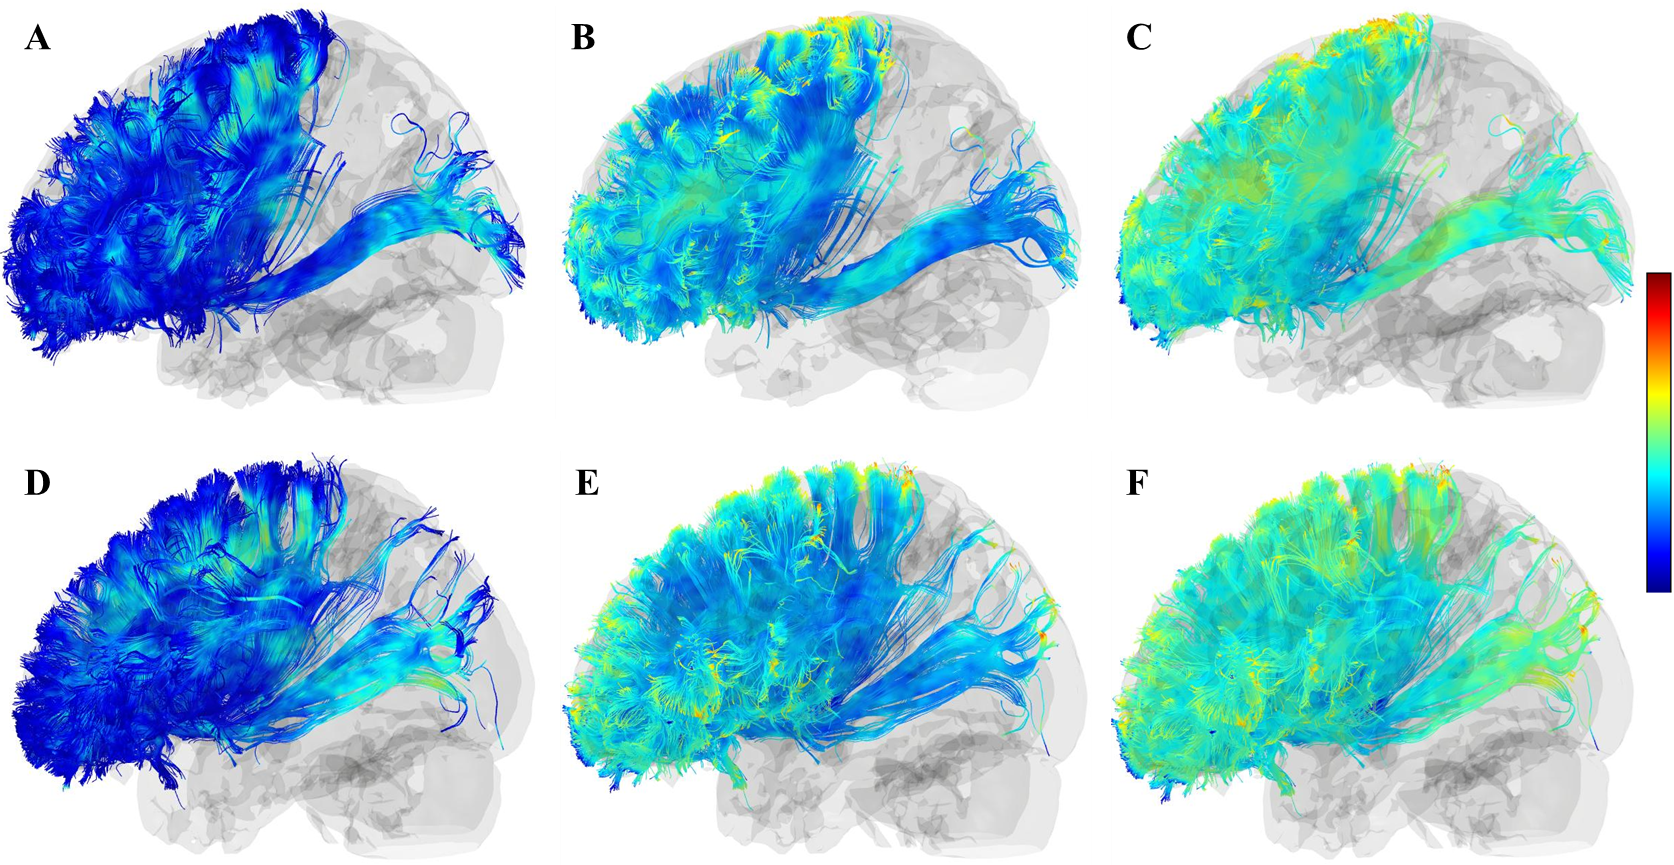
Figure.2 A-C, the FA, RD, AD maps of the left cortical
striatal pathway in patient 2. D-F, the FA, AD, RD maps of the left cortical
striatal pathway in healthy control. The reduce of white matter integrity was
mainly found in the prefrontal area.
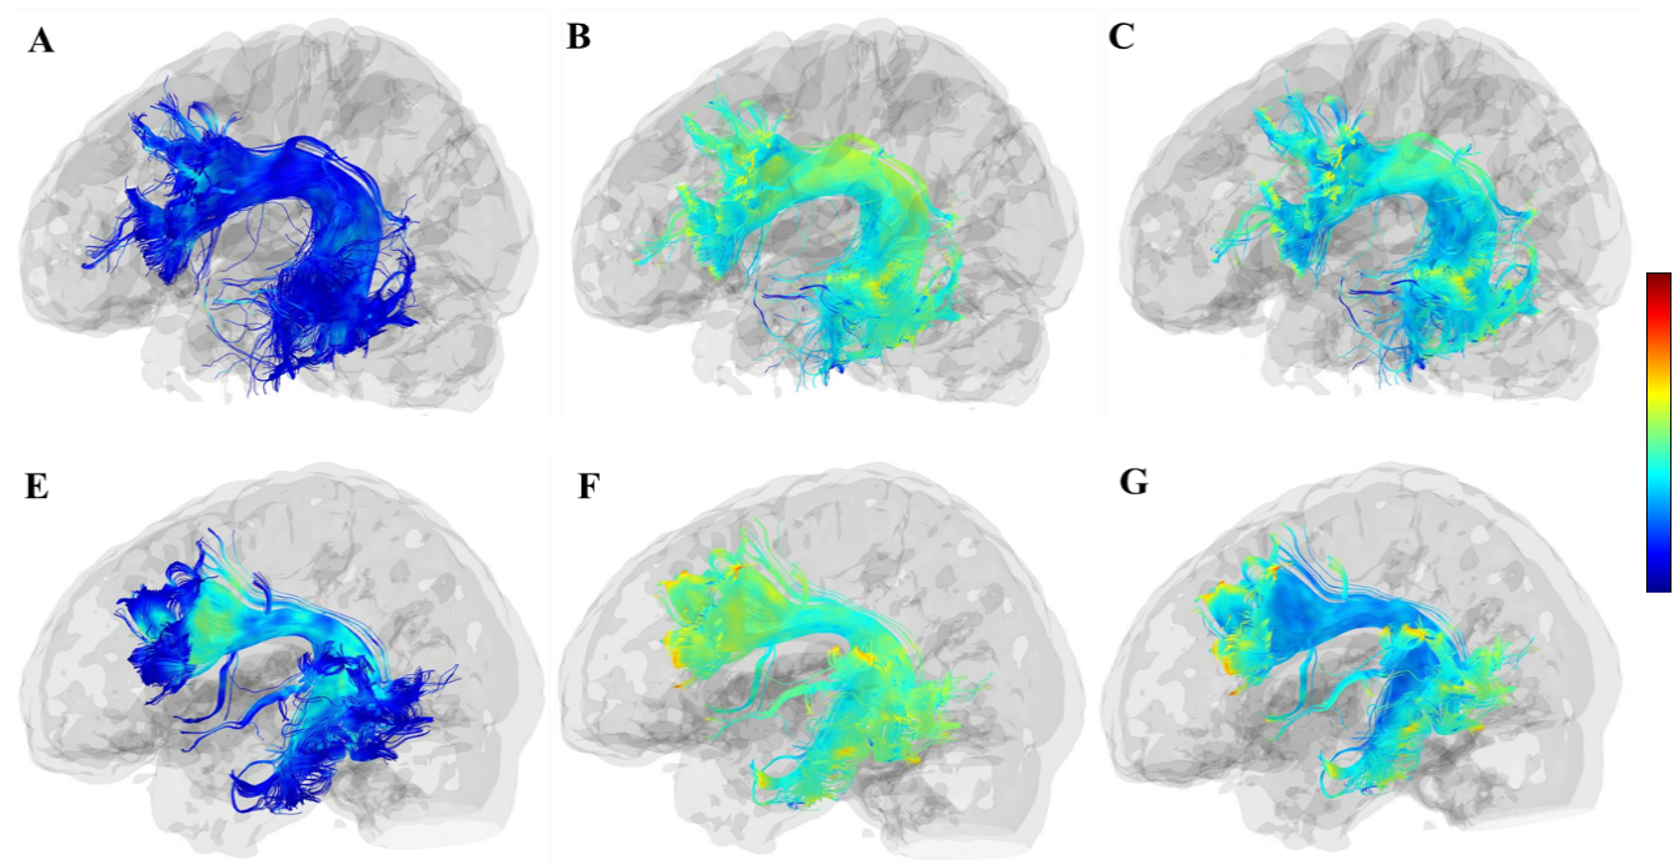
Figure.2 A-C, the FA, RD, AD maps of the left
arcuate fasciculus in patient 2. D-F, the FA, AD, RD maps of the left arcuate fasciculus
in healthy control. The reduce of FA and increase of AD and RD were mainly
present in the ends of the pathway, which is located in the prefrontal and
temporal lobe. The loss of fiber number was observed at the ends of the prefrontal
cortex.
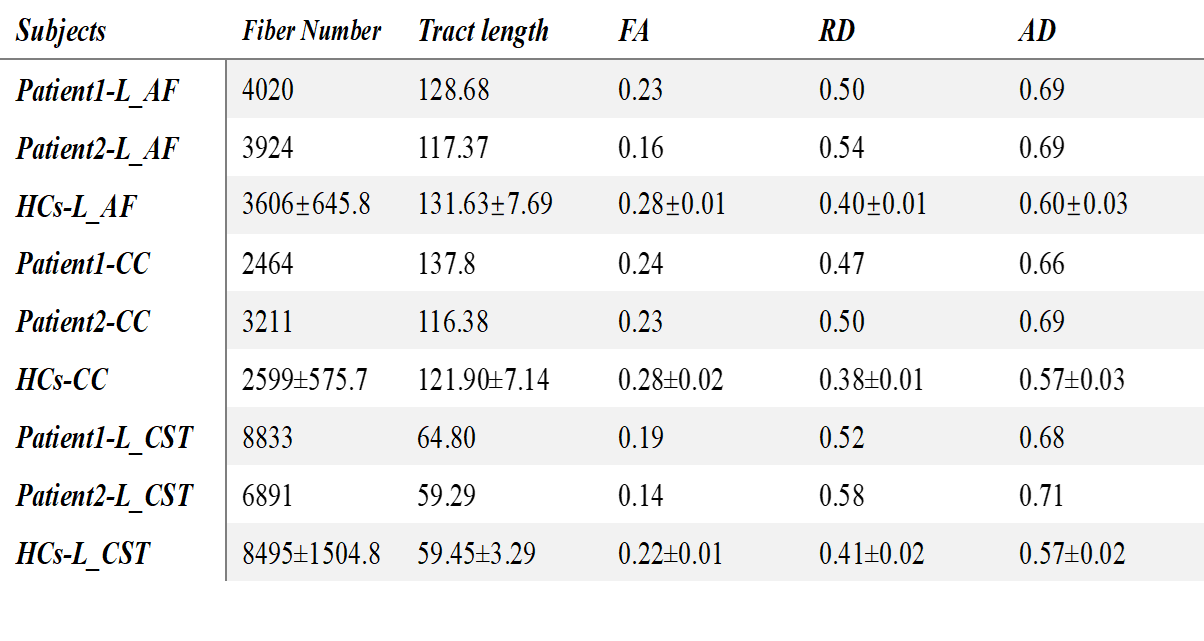
Table
1. Statistic information on the three specific tracts. Abbreviations:AF=arcuate fasciculus, CC=corpus callosum,
CST=cortical striatal tracts