1574
QSM Attributes of Neurodegeneration with Brain Iron Accumulation Disorders Subtypes in Basal Ganglia1Acibadem Mehmet Ali Aydinlar Univ., Istanbul, Turkey, 2Neurology, Istanbul University, Istanbul, Turkey, 3Neurology, Erciyes University, Kayseri, Turkey, 4Radiology, Acibadem Mehmet Ali Aydinlar Univ., Istanbul, Turkey
Synopsis
QSM has the potential of describing objectively iron accumulation in brain regions such as basal ganglia which is relevant in neurodegeneration with brain iron accumulation (NBIA). Herein, for accurately assessing iron accumulation, a new metric, high susceptibility density, is introduced against mean value pitfalls which may be hindered by negative susceptibility within ROIs. When analyzing iron accumulation in basal ganglia of 16 patients with subtypes PKAN dispersion, KUFOR lower and PLAN higher accumulation, MPAN separation was obeserved in the Globus Pallidus-Red Nucleus space compared to healthy volunteers.
Introduction
Neurodegeneration with brain iron accumulation (NBIA) is a set of highly debilitating genetic disorders with short life expectancy affecting children and adults. MR’s role is crucial in initial diagnosis as the first suspicion is drawn from increased iron deposition observed in clinical MRIs1. Qualitative special features, such as “eye of the tiger”2 sign in T2W images, are in clinical use but are insufficient especially for understanding mechanisms behind selective iron deposition in globus pallidus and substantia nigra. In contrast, recently popularized quantitative susceptibility mapping3 (QSM) methods might provide significant objective information for overcoming the broad phenotypic NBIA range and variability.Methods
In this IRB approved study, MR data were collected from 16 NBIA patients (11 with anesthesia) 7, 2, 3, 1 male and 2, 0, 0, 1, female PKAN, PLAN, MPAN and Kufor-Rakeb patients respectively with $$$21.37\pm 13.98\mathrm{yrs.}$$$ and range $$$[5\mathrm{yrs.}- 35\mathrm{yrs.}]\cup \{56\mathrm{yrs. (male, PKAN)}\} $$$ who were referred from the collaborating institutions. MRIs were also collected without anesthesia from 11 (5 females) healthy volunteers of $$$ 29.54 \pm 13.76\mathrm{yrs.} $$$ with $$$ [7\mathrm{yrs.} - 49\mathrm{yrs.}] $$$ range. Prior to imaging, informed written consent was obtained from the volunteers, patients or their legal guardians.MRI data were collected on a Siemens™ Magnetom Prisma® 3 Tesla scanner equipped with a 60 cm gantry, a 80 mT/m gradient with 200 T/m/s slew rate and a 64 channel head/neck coil. A 3D FLASH sequence with (single echo) TE=30ms, TR=45ms was used for QSM data collection. Axial 256x256 images with a resolution of 0.86x0.86x2 mm/voxel were obtained.
All images were converted from DICOM to NIfTI format MIPAV4 software which was also used for brain surface extraction (BSE) algorithm. BSE brain masks were then fed to the QSM software package STI Suite5-7 v2.2 along with the phase images for obtaining susceptibility maps. Therein, phase scaling (to $$$2\pi$$$), phase unwrapping and background phase removal using iHARPERELLA (integrated HARmonic (background) PhasE REmovaL using the Laplacian operator) routine7 were performed respectively prior to applying iLSQR (improved sparse linear equation and least-squares) algorithm.
Basal ganglia regions, CN, PT, GP, RN and SN were manually segmented independently from QSM images using MIPAV4’s draw polygon segmentation tool on either unprocessed phase images or frequency shift maps. region of interest (ROI) based data analysis and presentation were realized with in-house developed MATLAB™ 2018b (Mathworks™, Natick, MA, USA) code.
By ferromagnetism, iron increases magnetic susceptibility of brain tissue8. However, heterogeneous iron distributions, paramagnetic and diamagnetic tissue with negative susceptibility might impair accumulation assessment when using ROI mean values as metric. Accordingly, for assessing iron accumulation within ROIs more precisely than mean ROI-susceptibility we propose herein a novel metric. First, the volume of high susceptibility ($$$\chi_t$$$ ) values above a chosen threshold is calculated as
$$V(\chi_t)=\int\limits_{\chi(x)>\chi_t} dx=\sum_i I(\chi(x_i)>\chi_t) \quad (x,x_i \in R^3)$$
where $$$I$$$ denotes the indicator function. Subsequently, high susceptibility density $$$\rho(\chi_t)$$$ defined as
$$\rho(\chi_t)=\frac{1}{V(\chi_t)}=\int\limits_{\chi(x)>\chi_t} dx=\frac{1}{V(\chi_t)}\sum\limits_{i, s.t. \chi(x_i)>\chi_t} \chi(x_i) \quad (x,x_i \in R^3)$$
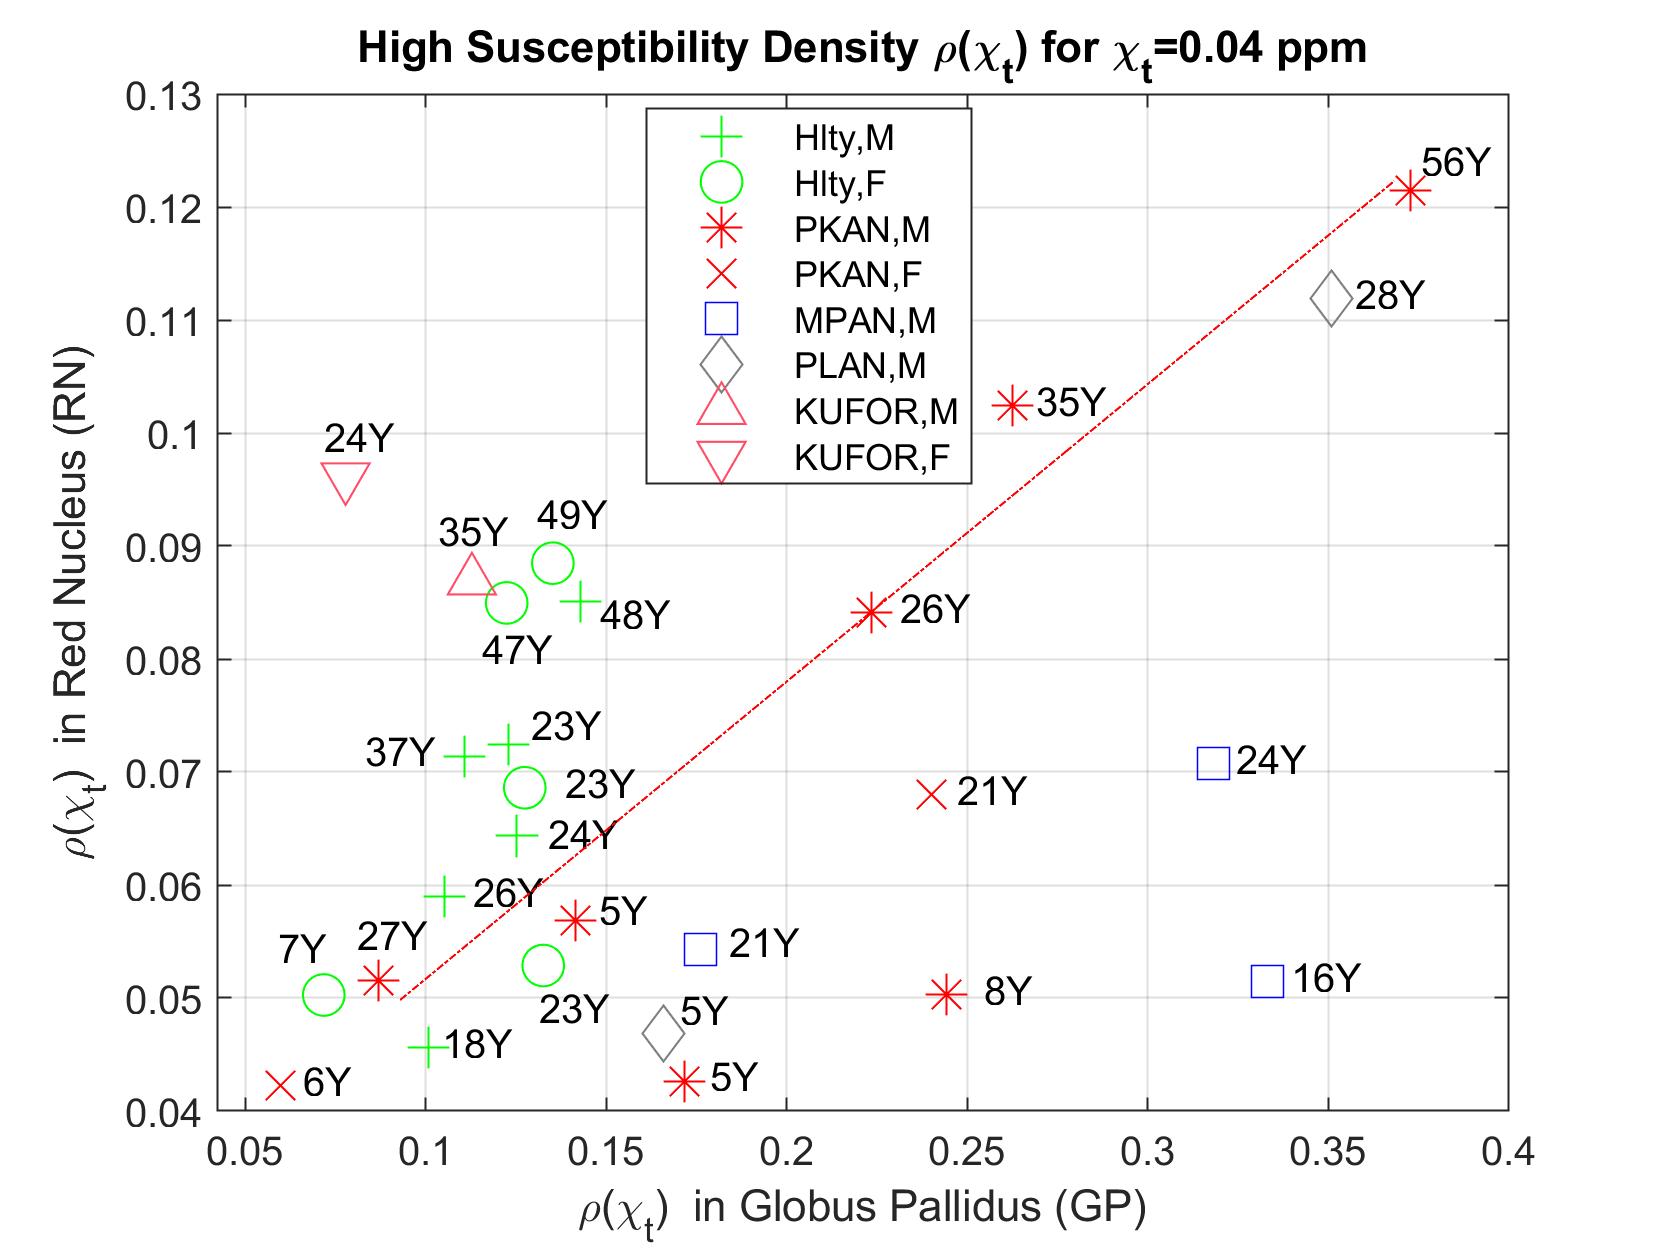
is calculated for each patient’s ROIs. The threshold was chosen by inspecting the data for high iron concentration while providing best subject clusters in ROI-scatter plots (see figure).
Results
Whereas TH, PT and CN demonstrate cluster heterogeneity with various levels of healthy subject clustering (not shown), GP plays a key role in separating subtypes and healthy volunteers. RN and SN display similar properties however with a lesser prominence.With the exception of one 27Y, male PKAN patients demonstrate age dependent simultaneous increase in GP-RN (see figure), while a 5Y and 8Y fall apart from the linear trend with low RN values. In contrast, older healthy volunteers have higher accumulation in RN but not in GP.
Two Kufor-Rakeb patients remain clustered in GP-RN-SN combinations with accumulations lower, similar and higher in GP, SN and RN respectively compared to healthy cohort (RN-SN not shown).
PLAN-28Y-M patient have consistently a large accumulation in all ROI combinations similarly for PKAN-56Y-M patient which is expected with age related accumulation.
MPAN patients remain close to each other but are separated from the patients and volunteers with values in mid-high range in GP and SN.
Conclusion
The mechanisms of iron accumulation, including the discovery of new NBIA genes and pathways is an ongoing research topic. In this preliminary study, to the best of our knowledge QSM data collected from a rare cohort of patients provided for the first time means of describing and differentiating basal ganglia regions affected by NBIA subtypes. The method herein might potentially be effective in supporting future NBIA molecular and genetic research.Acknowledgements
Special thanks to Arzu Karabay for providing genomic information.References
1. Hayflick, S.J., Kurian, M.A. & Hogarth, P. in Handbook of Clinical Neurology, Vol. 147. (eds. D.H. Geschwind, H.L. Paulson & C. Klein) 293-305 (Elsevier, 2018).
2. Delgado, R.F. et al. Missense PANK2 mutation without “Eye of the tiger” sign: MR findings in a large group of patients with pantothenate kinase-associated neurodegeneration (PKAN). Journal of Magnetic Resonance Imaging 35, 788-794 (2012).
3. Deistung, A., Schweser, F. & Reichenbach, J.R. Overview of quantitative susceptibility mapping. NMR in Biomedicine 30, e3569-n/a (2017).
4. McAuliffe, M. MIPAV (Medical Image Processing, Analysis, and Visualization). Retrieved from https://mipav.cit.nih.gov/
5. Liu, C. Retrieved from https://people.eecs.berkeley.edu/~chunlei.liu/software.html
6. Wu, B., Li, W., Guidon, A. & Liu, C. Whole brain susceptibility mapping using compressed sensing. Magnetic Resonance in Medicine 67, 137-147 (2012).
7. Li, W., Avram, A.V., Wu, B., Xiao, X. & Liu, C. Integrated Laplacian-based phase unwrapping and background phase removal for quantitative susceptibility mapping. NMR in Biomedicine 27, 219-227 (2014). 8. Duyn, J.H. & Schenck, J. Contributions to magnetic susceptibility of brain tissue. NMR in Biomedicine 30, e3546-n/a (2017).
Figures