1573
Method for quantitative evaluation of the substantia nigra using phase-sensitive inversion recovery in 1.5-T magnetic resonance imaging1Graduate School of Health Sciences, Kumamoto University, Kumamoto, Japan, 2Department of Medical Image Sciences, Faculty of Life Sciences, Kumamoto University, Kumamoto, Japan, 3Department of Radiology, National Hospital Organization Kumamoto Saisyun Medical Center, Kumamoto, Japan
Synopsis
Degeneration of the substantia nigra cannot be evaluated using neuromelanin imaging at 1.5 T. Therefore, an imaging method to quantitatively evaluate the substantia nigra with 1.5-T magnetic resonance imaging is required. This study aimed to investigate whether the substantia nigra can be quantitatively evaluated by acquiring a T1 map using three-dimensional phase-sensitive inversion recovery (PSIR) at 1.5 T. T1 mapping using the PSIR sequence enables quantitative evaluation of the substantia nigra independent of the imaging parameters.
INTRODUCTION
Parkinson’s disease is a neurodegenerative disease with movement disorders caused by degeneration of the substantia nigra in the midbrain. Neuromelanin imaging is an imaging sequence that demonstrates the neuromelanin of the substantia nigra as high signal intensity; normal substantia nigra cannot be demonstrated at 1.5 T. Therefore, a method is required for quantitative evaluation of the substantia nigra at 1.5 T.Three-dimensional (3D) phase-sensitive inversion recovery (PSIR) can yield T1-weighted images with high tissue contrast and T1 values simultaneously. We hypothesized that the T1 value and area of the substantia nigra could be measured using PSIR at 1.5 T and that these properties could be used to evaluate the degeneration of the substantia nigra. This study aimed to investigate whether the substantia nigra can be quantitatively evaluated by acquiring a T1 map using 3D PSIR at 1.5 T.
MATERIALS AND METHODS
In this study, 1.5-T Ingenia (Philips Healthcare, the Netherlands) and a ds Head 15-ch coil were used. The study protocol was approved by the Institutional Review Board of the National Hospital Organization Saisyun Medical Center. Phantoms were made by diluting an intravenous solution of gadopentetate meglumine (0.5 mmol/mL, Fuji Pharmaceutical Co., Ltd., Japan) with distilled water to nine different concentrations, adding agar at 1.0 w% of the total mass. An in vivo study was performed on nine healthy subjects (age: 20–51 years; nine men; average age: 31.8 years). All examinations were performed after obtaining written informed consent from the subjects.PSIR involves 3D turbo field echo acquisition at two different inversion times (TIs) after applying a nonselective inversion recovery pulse. The magnitude and reference images are reconstructed by signals obtained at the first (TI1) and second (TI2) TIs, respectively. Furthermore, the PSIR image is reconstructed using the phase information obtained from the reference image and coil sensitivity, which maintains the signal polarity. Figure 1 shows the representative magnitude, reference, PSIR, and T1 map images of the substantia nigra. The T1 value can be calculated using the signal intensities of the reference and PSIR images.
In the phantom study, phantoms were imaged using PSIR and inversion recovery spin-echo (IR-SE) sequence, and the T1 value of each phantom was measured to verify the accuracy of the PSIR T1 measurement at 1.5 T. TIs of IR-SE were set at 50, 100, 200, 400, 600, 800, 1000, 2000, 3000, and 4900 ms to calculate the T1 value. PSIR was imaged with a combination of five TI1 and TI2 conditions—TI1, 300, 400, 500, 600, and 700 ms and TI2, 2300, 2400, 2500, 2600, and 2700 ms.
T1 values of the phantom were measured for each imaging setting of TI1 and TI2. Additionally, the Bland–Altman plot was used to calculate T1 in each TI settings. In the in vivo study, the midbrain of nine healthy volunteers was imaged by PSIR at four imaging conditions: TI1, 300, 400, 500, and 600 ms (TI2 was also used from 2300 ms to 2600 ms in 100 ms increments.). T1 values were calculated pixel-by-pixel with all combinations of TI1 and TI2.
The regions of interest (ROIs) of the substantia nigra were set on the slice that widely demonstrated the substantia nigra. The ROI boundary threshold was determined based on the T1 value of the cerebral peduncle (Fig. 2). The T1 value and area of the substantia nigra were measured using T1 maps. The T1 value and area of the substantia nigra were compared to those reported in previous studies. In addition, the T1 value of the substantia nigra in each TI setting was compared to that reported in previous studies. The area of the substantia nigra in each TI setting was also compared to that reported in previous studies.
RESULTS
In the phantom study, the measurement error in the T1 value caused by PSIR relative to the T1 value, which was measured in the IR-SE sequence, was a maximum of 16% (Fig. 3). In the in vivo study, the T1 value of the substantia nigra measured by PSIR was 828.4 ± 18.0 ms, and the difference from the T1 value reported in previous studies was of approximately 1.1%. Furthermore, the area of the substantia nigra measured by PSIR was 123.9 ± 22.5 mm2. There were no significant differences in the T1 value or area of the substantia nigra among TI1s (Fig. 4).DISCUSSION
We demonstrated that PSIR could measure the T1 value of the substantia nigra with high accuracy at 1.5 T. Setting the ROI in the substantia nigra based on the T1 value of the cerebral peduncle enables accurate evaluation of the T1 and area of the substantia nigra. In the future, the measurement of the T1 value and area of the substantia nigra by PSIR may enable quantitative evaluation of the degeneration of the substantia nigra at 1.5 T.In conclusion, PSIR enables quantitative evaluation of the substantia nigra by measuring its area and T1 value in 1.5-T magnetic resonance imaging.
Acknowledgements
No acknowledgement found.References
1) Kellman P, et al. Magn Reson Med. 2002; 47(2): 372-383.
2) Warntjes MJ, et al. BMC Med Imaging. 2010;10-19.
Figures
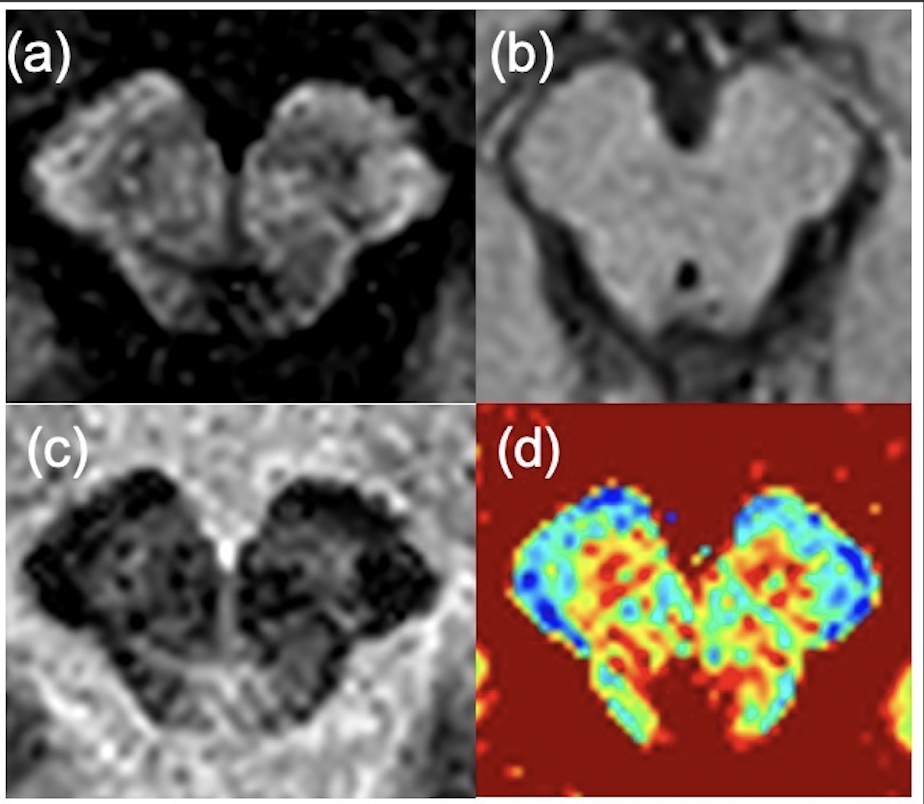
Fig. 1 Representative images of the substantia nigra obtained from the PSIR sequence
Four images shows from left to right, the magnitude (a), reference (b), PSIR (c), and T1 map (d) images, respectively.
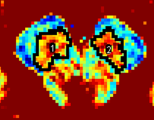
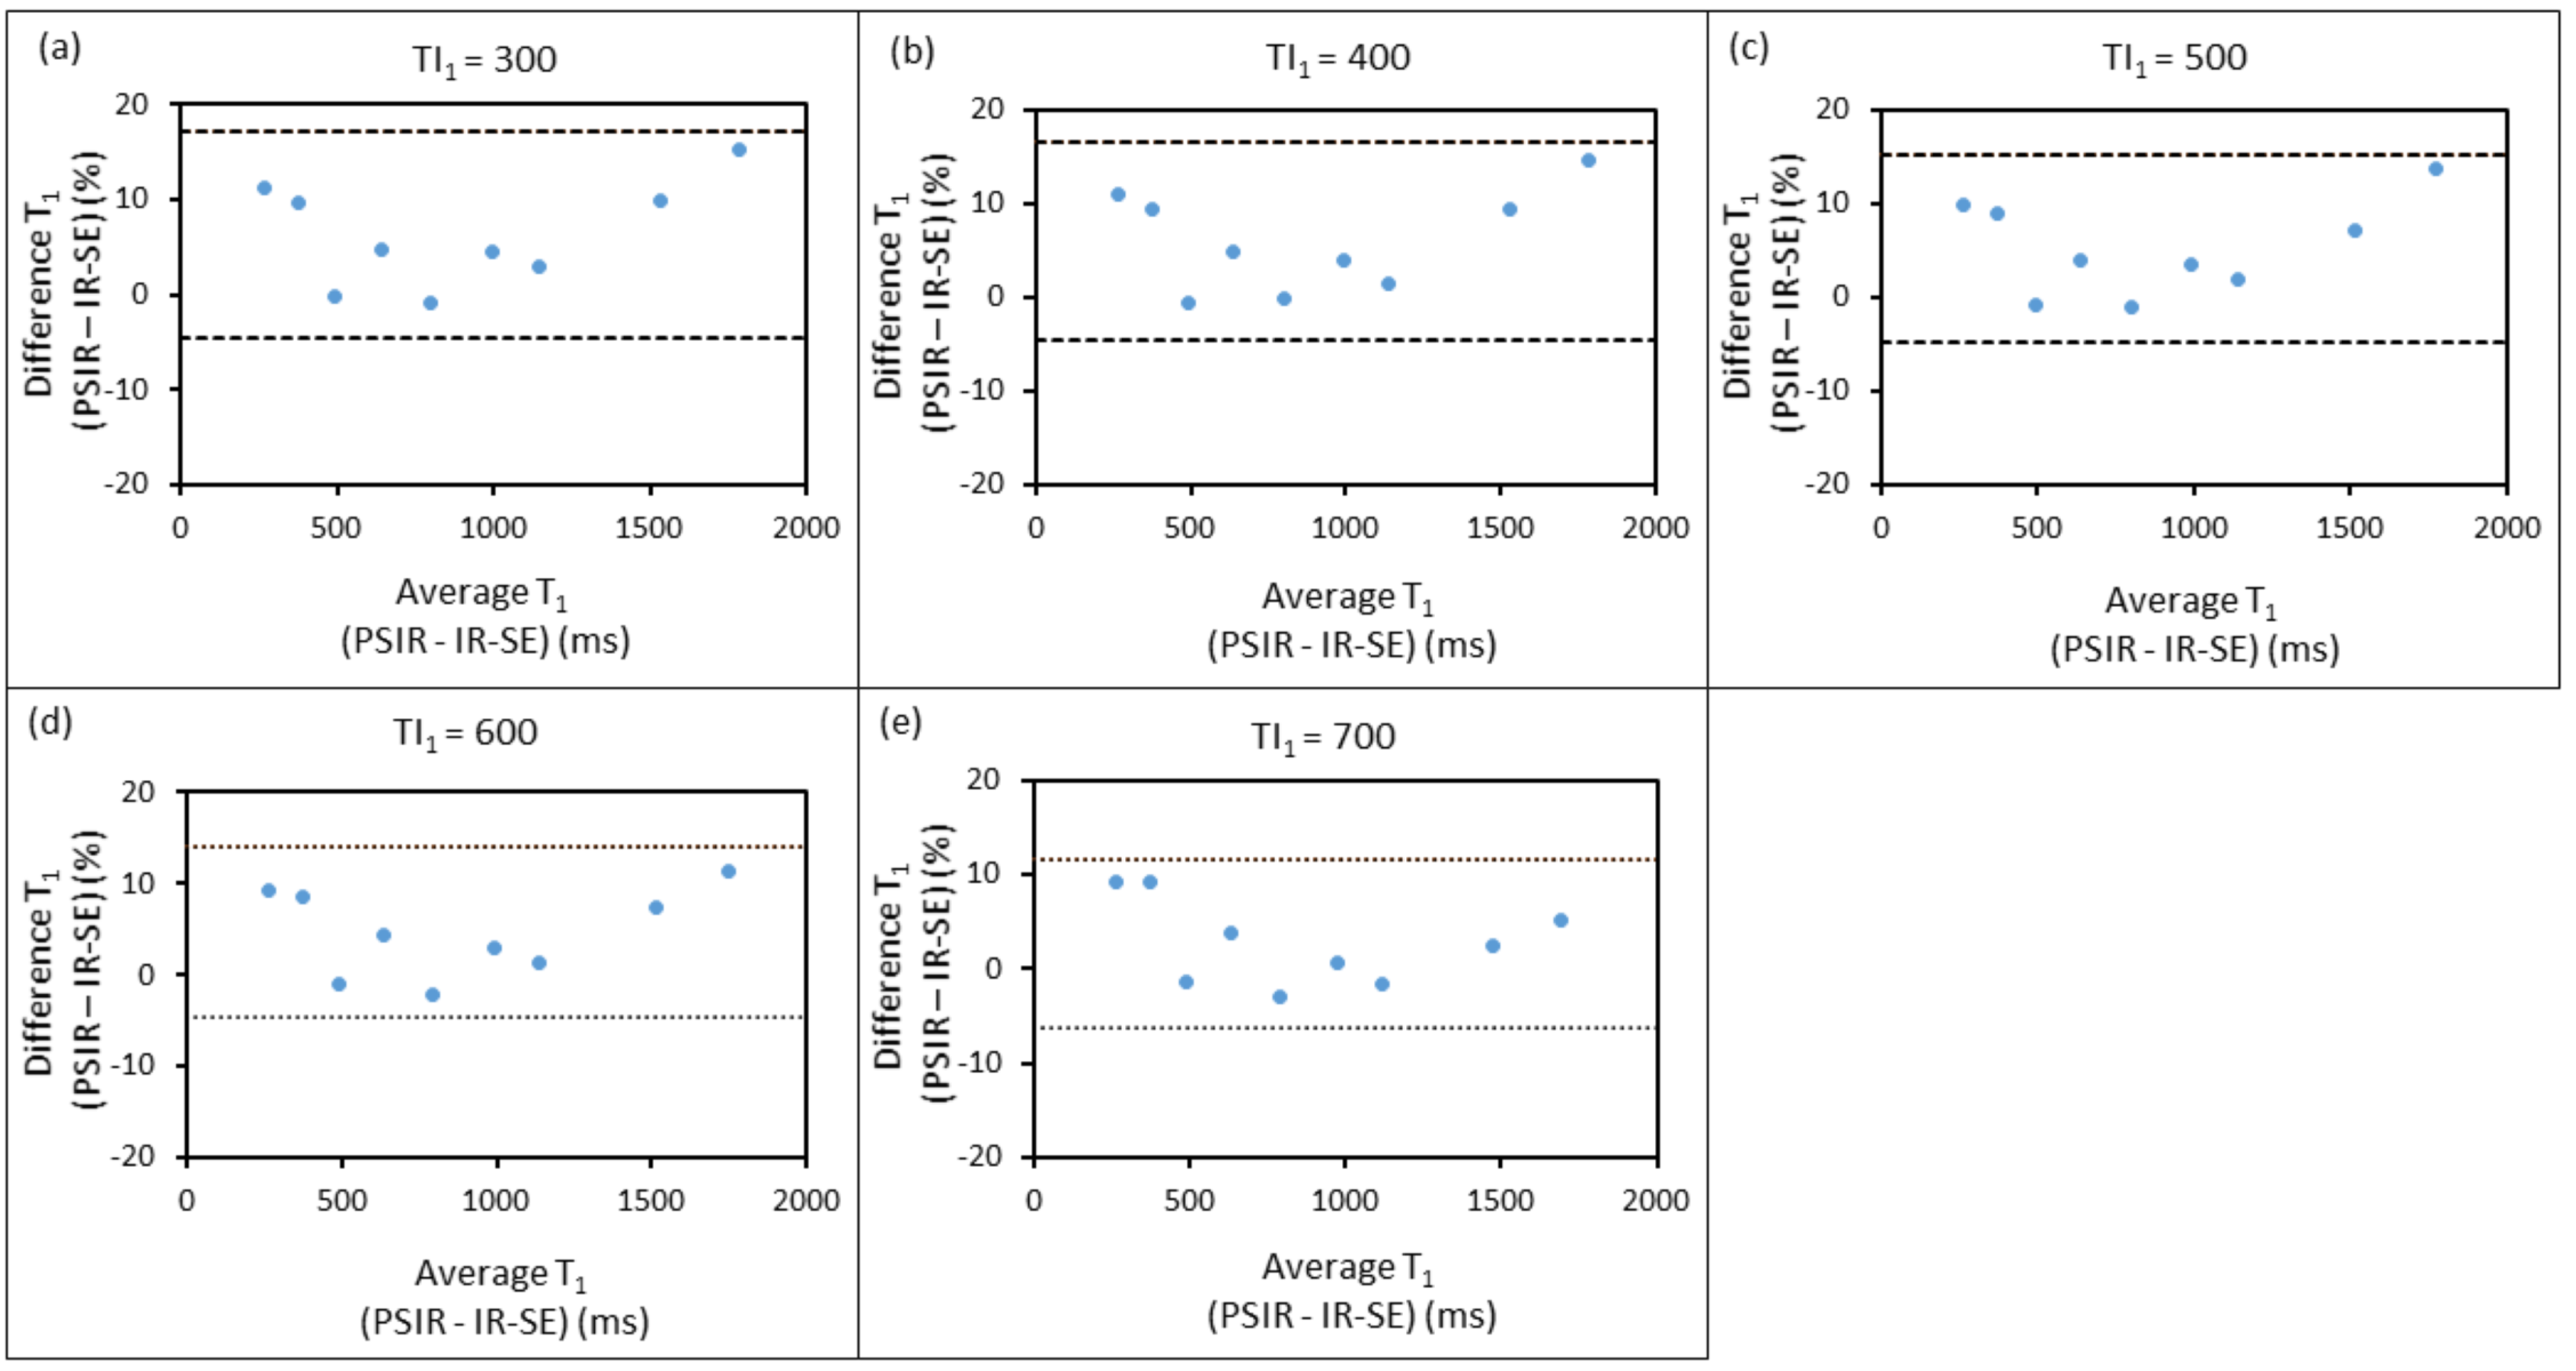
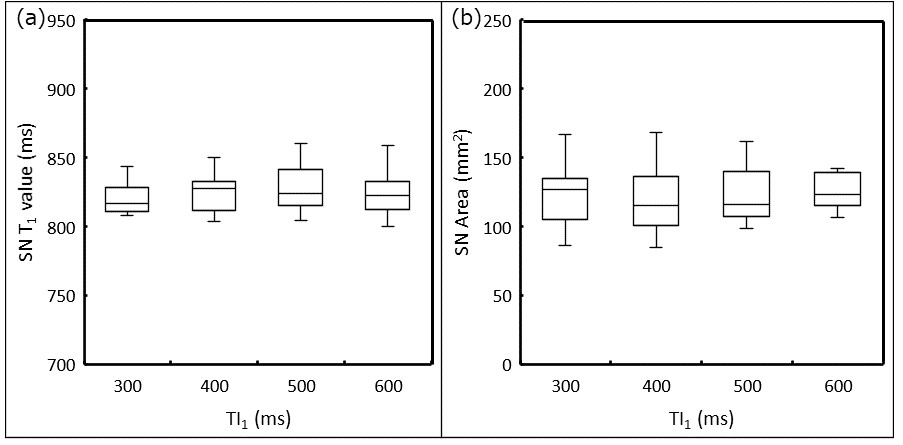
Fig. 4 T1 values and areas of the substantia nigra measured by PSIR at multiple TI1s
T1 values of the substantia nigra at each corresponding TI1 (a). The right graph shows the area of the substantia nigra at each corresponding TI1 (b). There were no statistically significant differences among the T1 values of the substantia nigra at different TIs. Moreover, there were no statistically significant differences among the areas of the substantia nigra at different TIs.