1569
Serial assessment of magnetic susceptibility in the primary motor cortex in limb-onset Amyotrophic Lateral Sclerosis
Anjan Bhattarai1,2, Zhaolin Chen2, Phillip G. D. Ward2, Paul Talman3, Susan Mathers4, Thanh Phan5, Caron Chapman4, James Howe4, Sarah Lee4, Yennie Lie4, Gary F Egan2, and Phyllis Chua1,4
1Department of Psychiatry, Monash University, Clayton, Australia, 2Monash Biomedical Imaging, Monash University, Clayton, Australia, 3Department of Neuroscience, Barwon Health, Geelong, Australia, 4Statewide Progressive Neurological Services, Calvary Health Care Bethlehem, South Caulfield, Australia, 5Department of Neuroscience, Monash Health, Clayton, Australia
1Department of Psychiatry, Monash University, Clayton, Australia, 2Monash Biomedical Imaging, Monash University, Clayton, Australia, 3Department of Neuroscience, Barwon Health, Geelong, Australia, 4Statewide Progressive Neurological Services, Calvary Health Care Bethlehem, South Caulfield, Australia, 5Department of Neuroscience, Monash Health, Clayton, Australia
Synopsis
We performed in-vivo measurements of the magnetic susceptibility in the motor cortex in individuals with Amyotrophic Lateral Sclerosis (ALS) at baseline and six-month follow-up, and healthy controls at baseline using Quantitative Susceptibility Mapping (QSM). The results show significant susceptibility difference between individuals with ALS compared to healthy controls. There was a trend towards more pronounced susceptibility changes in lumbar onset compared to healthy controls than cervical onset ALS compared to healthy controls. These findings may lead to the development of a sensitive neuroimaging biomarker that can provide meaningful insights into pathophysiologic changes in ALS subtypes.
Introduction
Amyotrophic Lateral Sclerosis (ALS) is a progressive neurodegenerative disorder which is known to affect both Upper Motor Neurons (UMN) and Lower Motor Neurons (LMN).1 Diagnosis of ALS can be difficult due to its clinical heterogeneity, unpredictable progression and the lack of a diagnostic test or biomarker. A number of studies have suggested dysregulation of iron in ALS brain,2, 3 including an ex-vivo study which reported increased iron accumulation in the microglia of the motor cortex of individuals with ALS.4 Disruptions in brain iron homeostasis are considered a prominent hallmark of neuroinflammation,5 and its role in ALS pathogenesis warrants further investigation.Quantitative Susceptibility Mapping (QSM) provides a surrogate measurement of iron, copper and zinc in the brain with the measurement of magnetic susceptibility in-vivo. In this abstract, we report our preliminary QSM findings in the primary motor cortex of individuals with limb-onset phenotypes of ALS: i) lumbar onset ALS and ii) cervical onset ALS compared to healthy controls. The QSM findings in limb-onset ALS at six-month follow-up compared to baseline is also reported.
Methods
MRI images of the individuals with limb-onset ALS and healthy controls were acquired on a 3T Siemens Skyra. MRI data were obtained from 13 individuals with ALS (lumbar onset = 5, cervical onset = 6, and flail arm onset = 2) and 11 age and gender matched healthy controls at baseline. 9 individuals with ALS received a follow-up at six-month.MRI data acquisition protocol included T1-weighted MPRAGE and a T2*-weighted GRE (TR=30ms, TE=20ms, FA= 15°, FOV= 230mm, 0.9 x 0.9 x 1.8 mm3, 72 slices per volume). Individual coil images were reconstructed using raw k-space GRE data. Phase images were processed using Laplacian Unwarping3 and VSHARP4. QSM reconstruction was performed using iLSQR algorithm.5
The primary motor cortex region of interests (ROIs) of each participant were obtained from the cortical parcellation of their anatomical T1-weighted images using FreeSurfer,6, 7 and linearly co-registered registered to their respective QSM images using ANTs.8 The ROIs were individually checked for their anatomical and registration accuracy. The ROIs were: left and right primary motor cortex anterior (Brodmann area 4 anterior), and left and right primary motor cortex posterior (Brodmann area 4 posterior). QSM values were referenced to whole brain mean susceptibility value, and the mean calculated for each ROI. QSM values are reported as group mean ± standard error of the mean. False Discovery Rate (FDR) adjusted p-values are reported when comparing the subgroups (lumbar onset ALS and cervical onset ALS) to healthy controls.
Results
QSM values at baseline were observed to be significantly higher with strong effect sizes in the Right Anterior Primary Motor Cortex (RPMCa) (ALS = 33 ± 0.9 ppb, Controls = 29.7 ± 1.1 ppb, Wilcoxon rank sum p = 0.02, Cohen’s d = 0.92), and Left Posterior Primary Motor Cortex (LPMCp) (ALS = 30.2 ± 1.2 ppb, Controls = 27 ± 0.8 ppb, p = 0.02, d = 0.90) of individuals with limb-onset ALS compared to healthy controls. QSM values in all the ROIs in subgroup of lumbar onset ALS including RPMCa (lumbar onset ALS = 34.4 ± 1.9 ppb, Controls = 29.7 ± 1.1 ppb, p = 0.07, d = 1.21) and LPMCp (lumbar onset ALS = 30.5 ± 1.32 ppb, Controls = 27 ± 0.8 ppb, p = 0.07, d = 1.34) were higher compared to healthy controls though the differences were not statistically significant after FDR adjustment. QSM values between cervical onset ALS and healthy controls were not significantly different. No significant change in QSM values was observed at 6-month follow-up in RPMCa (Baseline ALS = 33.7 ± 1.2 ppb, Follow-up ALS = 34.4 ± 1.9 ppb, Wilcoxon signed rank p = 0.73, Cohen’s d = 0.23) and LPMCp (Baseline ALS = 31.2 ± 1.6 ppb, Follow-up ALS = 29.9 ± 1.4 ppb, p = 0.05, d = -0.77).Discussion
This study used QSM to measure magnetic susceptibility in-vivo in the primary motor cortex of individuals with limb-onset ALS at 2 time points 6 months apart and in healthy controls. The QSM values were significantly higher in ALS cohort compared to healthy controls. Although not significant, this trend was observed to be stronger, relative to controls, in lumber onset ALS compared to cervical onset ALS.The differences observed in QSM measures may be a result of increased iron accumulation in the motor cortex. Our current and future work will be to examine QSM changes in ALS beyond the primary motor cortex and investigate their correlations with clinical measures/scores.
Conclusion
This study demonstrates the efficacy of QSM in the detection susceptibility changes. QSM provides a means to measure iron dysregulation in the primary motor cortex in limb-onset ALS. The findings highlight its potential in characterizing disease progression in different ALS subtypes. Future longitudinal studies with a larger cohort, grouped on the basis of different clinical phenotypes, disease severity and duration are needed for the validation of QSM as a sensitive and specific marker of disease progression in ALS. Ongoing advances in QSM will improve the value of this tool, particularly by addressing streaking artefacts, relative rather than absolute measure of magnetic susceptibility, and lack of agreed upon reconstruction technique.Acknowledgements
Funding for this project was obtained through the Monash University Strategic Grant Scheme. AB is supported by The Australian Rotary Health / Rotary Club of Sandy Bay PhD Scholarship in Motor Neurone Disease.References
- Kiernan MC, Vucic S, Cheah BC, et al. Amyotrophic lateral sclerosis. Lancet (London, England). 2011 Mar 12;377(9769):942-55.
- Hadzhieva M, Kirches E, Wilisch-Neumann A, et al. Dysregulation of iron protein expression in the G93A model of amyotrophic lateral sclerosis. Neuroscience. 2013 Jan 29;230:94-101.
- Oshiro S, Morioka MS, Kikuchi M. Dysregulation of iron metabolism in Alzheimer's disease, Parkinson's disease, and amyotrophic lateral sclerosis. Advances in pharmacological sciences. 2011;2011:378278.
- Kwan JY, Jeong SY, Van Gelderen P, et al. Iron accumulation in deep cortical layers accounts for MRI signal abnormalities in ALS: correlating 7 tesla MRI and pathology. PloS one. 2012;7(4):e35241.
- Nnah IC, Wessling-Resnick M. Brain Iron Homeostasis: A Focus on Microglial Iron. Pharmaceuticals. 2018;11(4):129.
- Fischl B. FreeSurfer. NeuroImage. 2012 Aug 15;62(2):774-81.
- Fischl B, Rajendran N, Busa E, et al. Cortical folding patterns and predicting cytoarchitecture. Cerebral cortex (New York, NY : 1991). 2008 Aug;18(8):1973-80.
- Avants BB, Epstein CL, Grossman M, Gee JC. Symmetric diffeomorphic image registration with cross-correlation: evaluating automated labeling of elderly and neurodegenerative brain. Medical image analysis. 2008 Feb;12(1):26-41.
Figures
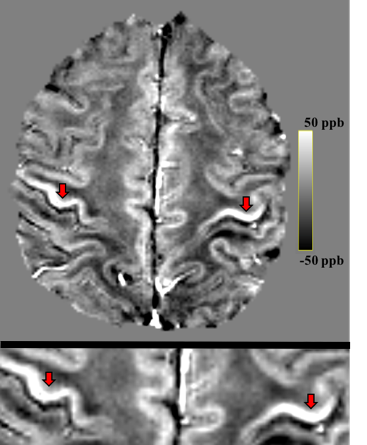
Figure 1: (top) Whole brain QSM map of an
individual with ALS. (bottom) Magnified view showing higher magnetic
susceptibility in primary motor cortices (arrows).
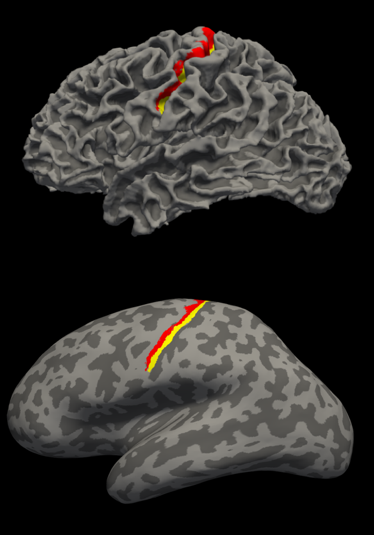
Figure 2: T1-weighted image based automated parcellation of the
primary motor cortex. The labels are anterior primary motor cortex (red), and
posterior primary motor cortex (yellow). (top) Lateral view of normal surface.
(bottom) Lateral view of inflated surface.
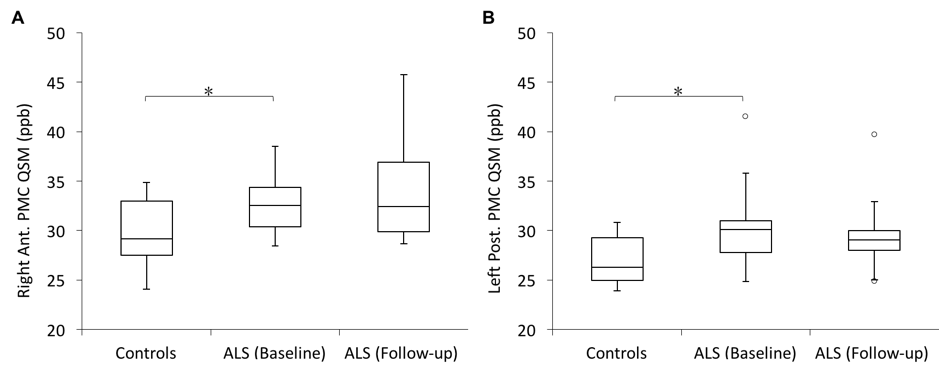
Figure 3: Box plots representing the
distribution of QSM values in: (A) Right primary motor cortex (anterior), and
(B) left primary motor cortex (posterior). These were the two regions where we
observed significantly higher magnetic susceptibility in the individuals with
ALS compared to healthy controls.