1568
A population-specific framework for the morphological analysis of Motor Neuron Disease using ultra-high field MRI1The University of Queensland, Brisbane, Australia, 2QIMR Berghofer Medical Research Intstitute, Brisbane, Australia, 3CSIRO Health and Biosecurity, Brisbane, Australia, 4CSIRO Data61, Sydney, Australia
Synopsis
Imaging biomarkers for Motor Neuron Disease (MND) using MRI presents challenges due to neurodegeneration leading to heterogeneous brain morphology, low SNR, and movement artefacts. Here, we present optimised methods for imaging and processing MND patient data using UHF MRI with submillimetre resolution, and compare hippocampal subfields between patients and healthy controls. We used automatic measures to examine the shape, volume, and morphology of hippocampal subfields and showed specific changes in MND patients that are more sensitive than previous research. This work may serve as a framework for more sensitive computational models for biological characterisation of MND in vivo.
Introduction
Motor Neuron Disease (MND) is a fatal neurodegenerative disease affecting the motor system with wide ranging effects on brain structure and function1. The hippocampal formation has been linked to MND through ubiquitin-immunoreactive inclusions in dentate granule cells2 including TDP-43 proteinopathy3. Further, hippocampus volume and subfield shape changes have been found at 1.5T4, and alterations to perforant path white matter have been reported5 ex vivo. Here, we present optimised imaging and post-processing strategies using ultra-high field MRI to assess hippocampus subfield characteristics that are only measurable at higher field strengths, and that could serve as a framework for imaging biomarkers in MND.Segmenting and analysing shape changes in hippocampus subfields in MND patients using in vivo MRI presents novel imaging challenges due to contrast changes between images6, decreased signal-to-noise-ratio due to increased movement of patients in the scanner7, and heterogeneity of morphometry leading to decreased registration performance and atlas convergence8.
Methods for automatic post-processing9 that utilize the submillimeter resolution and enhanced tissue contrast enabled by UHF MRI for heterogeneous brain morphology are not currently possible without manual examination/segmentation of MR scans and optimisation of analysis parameters.
We here detail automated methods for extracting precise measures describing hippocampal subfield morphology and compare these features in MND patients and healthy controls (HCs). We first used optimised MR scan parameters13 to measure hippocampus subfields as an archetype of complex neuroanatomy to be modelled. We utilised inverse consistent deformable registration methods14 to characterise hippocampus subfield volumes, replicate and extend findings of shape changes of hippocampus in MND automatically12, and confirm our findings using statistical parametric mapping between HCs and MND patients.
Methods
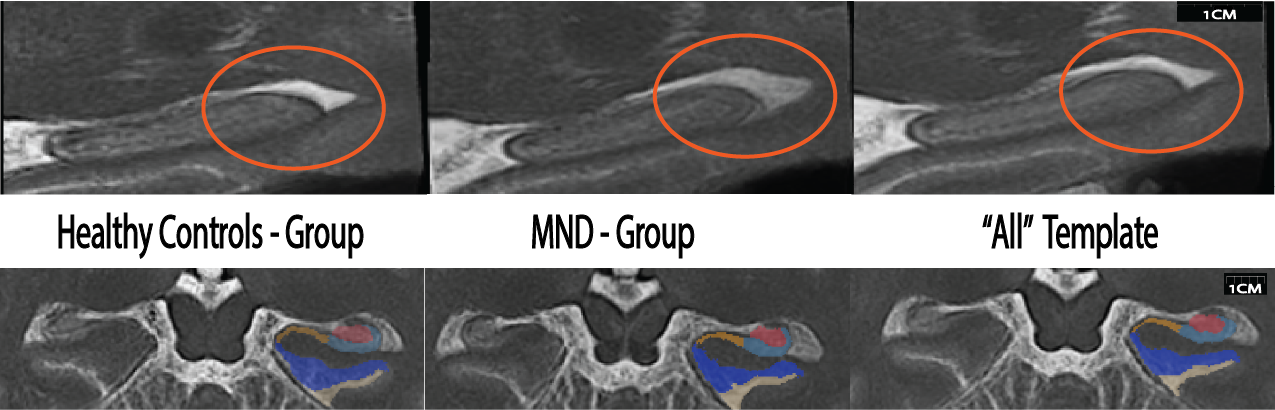
11 patients diagnosed with MND (Age, M=59.36, SD=7.65) and 11 age-matched HCs (M=60.23, SD=7.65) were imaged on a 7T Siemens MAGNETOM using a 2D TSE sequence (0.4x0.4x0.8mm3) over a slab placed orthogonally to the hippocampus. A whole-brain T1w MP2RAGE image (0.9mm isotropic voxel size) was also acquired (TR/TE/TIs=4300ms/2.5ms/840,2370ms).The T1w and T2w images were jointly registered to group-specific multi-contrast templates for only MND patients (Fig. 1, left), only HCs (Fig. 1, centre), and also collectively registered to a template comprising all participants (‘All’ Fig. 1) using ANTs15. The three multi-contrast templates were segmented using the ‘Automatic Segmentation of Hippocampus Subfields’ (ASHS16) package, and individual labels (Cornu Ammonis [CA]1-3, dentate gyrus [DG], and subiculum [SUB]) for each template were projected to the individual’s scan by the inverse transformation. Analysis of outliers for the harmonic energy of the subject-to-template transformations were computed, and a comparison of log Jacobians, which represent the local distribution of tissue expansion or compression between groups were computed using statistical parametric mapping via ANTs and FSL’s randomise 17.
Labels from the ‘Group’ template building process were converted to geometric shape images using SPHARM-PD14, and shape differences between MND and HCs were compared for each subfield.
Results
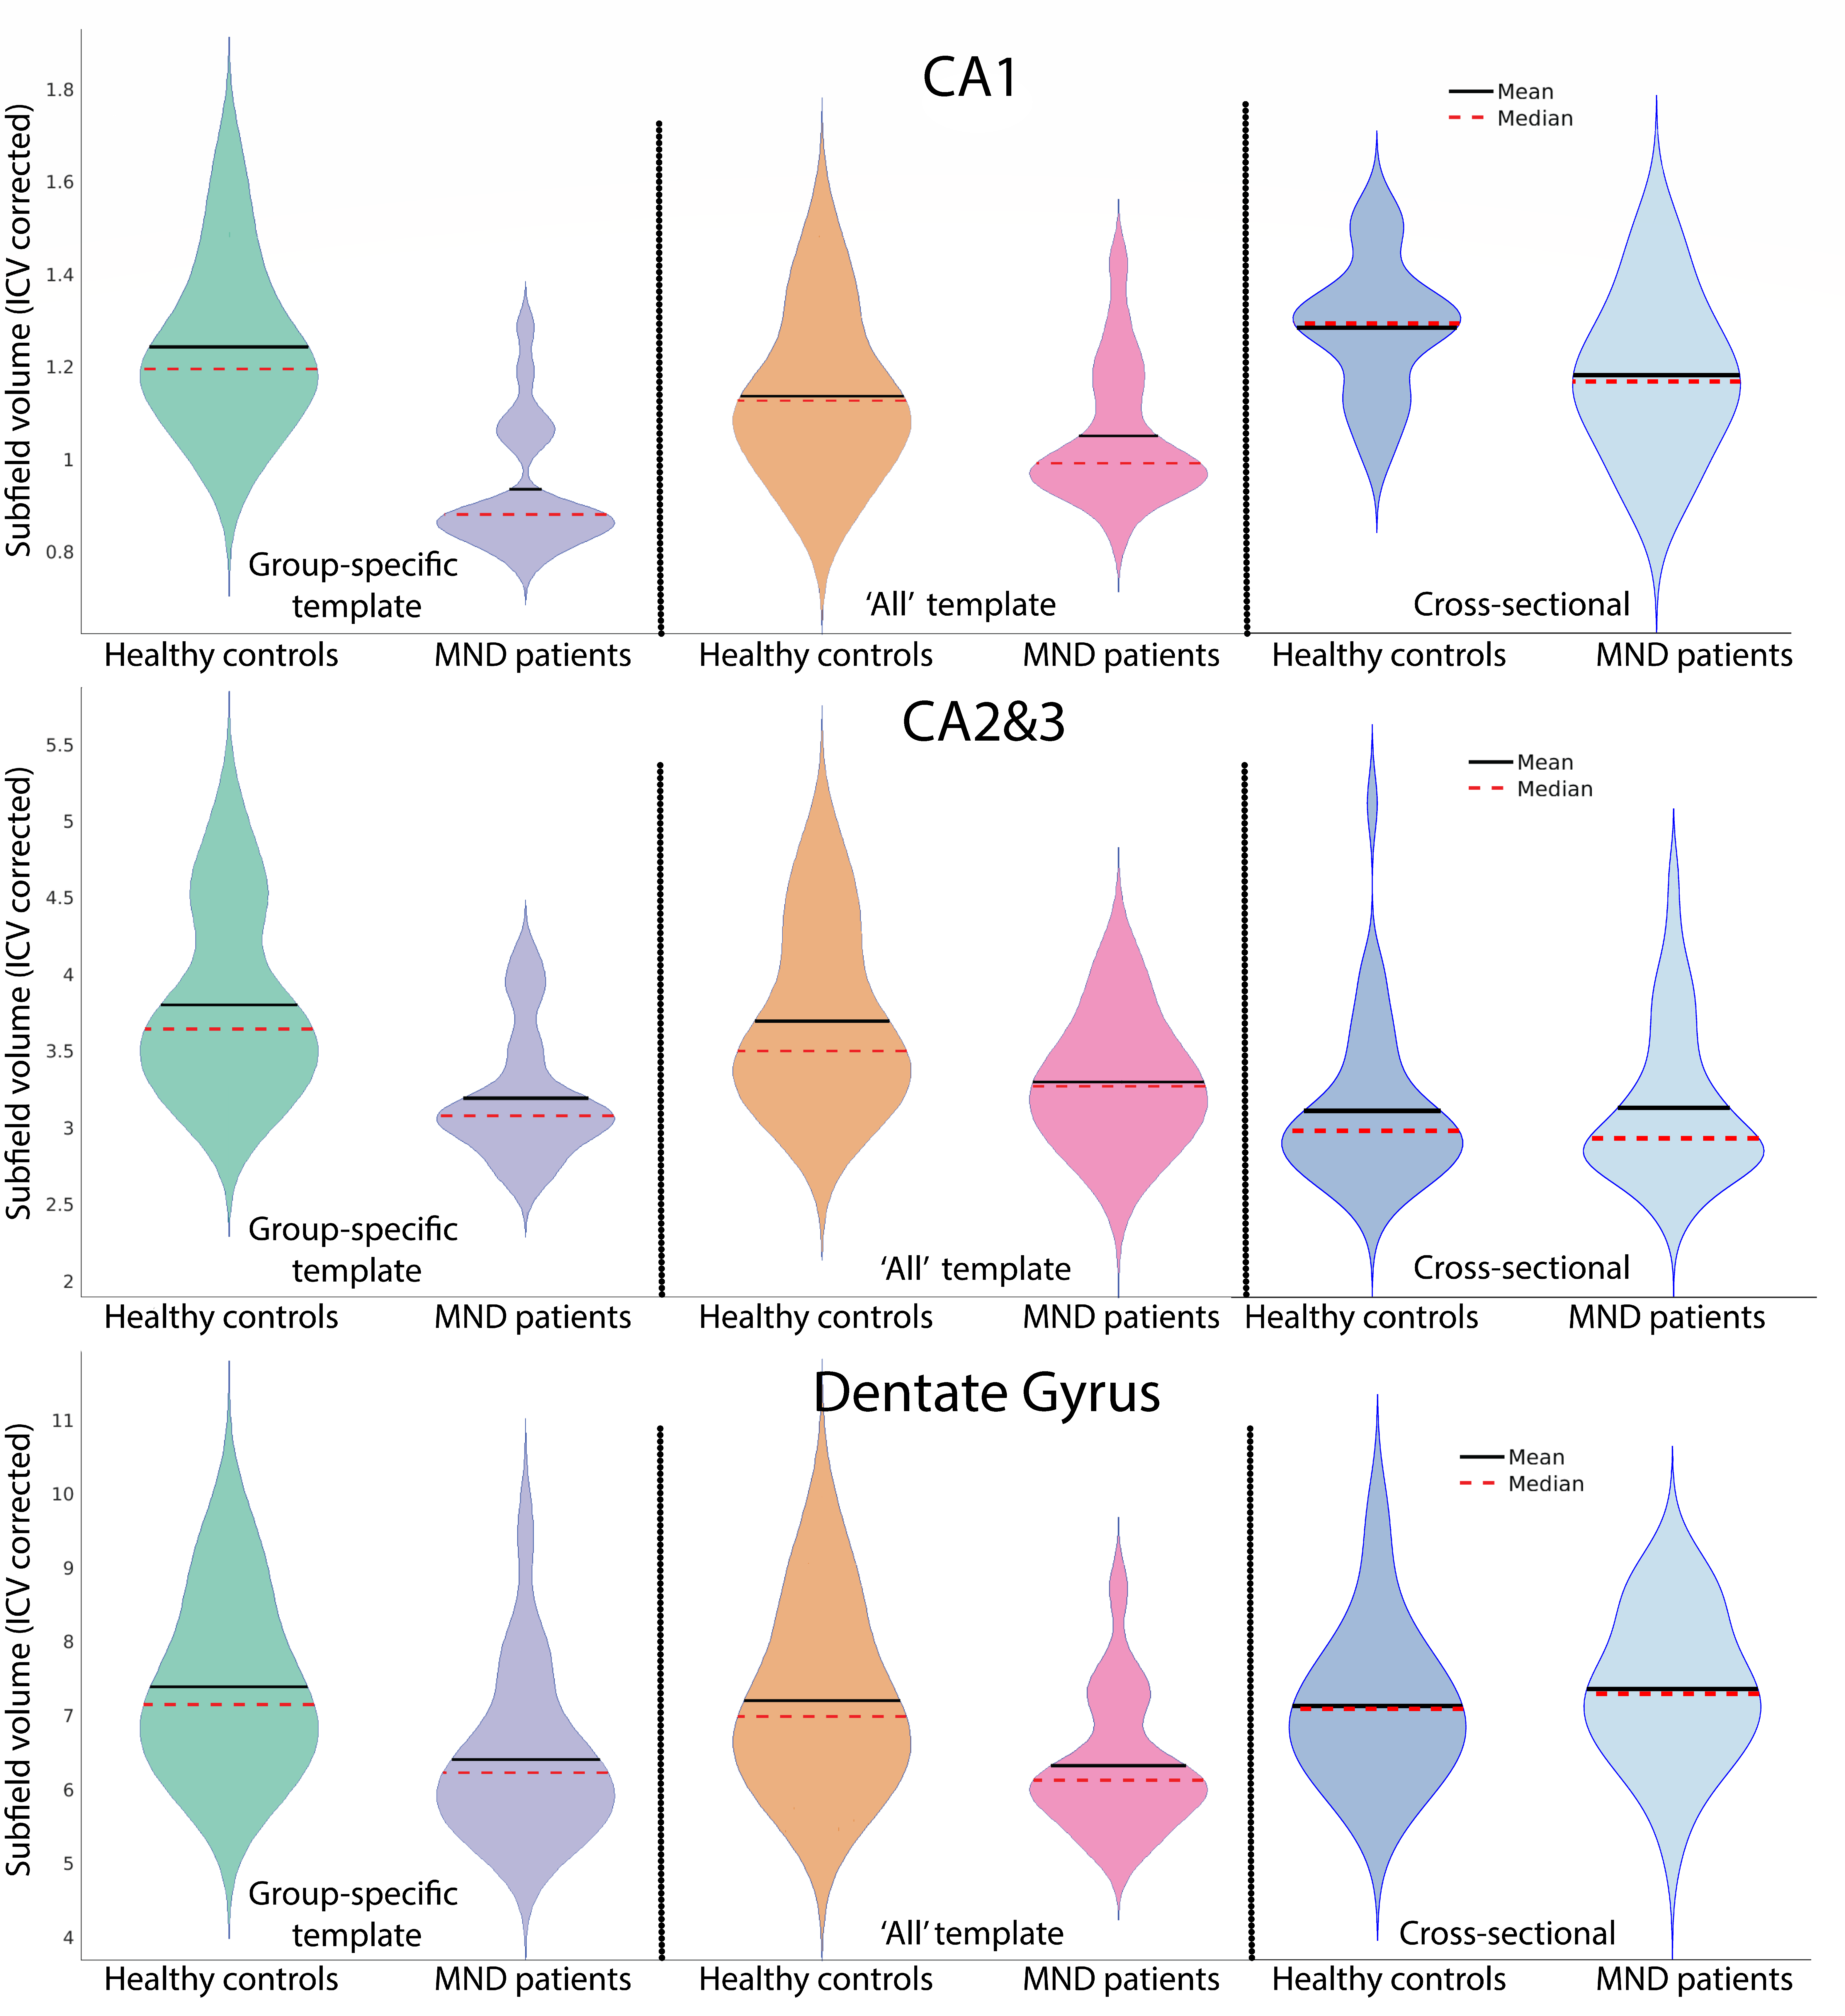
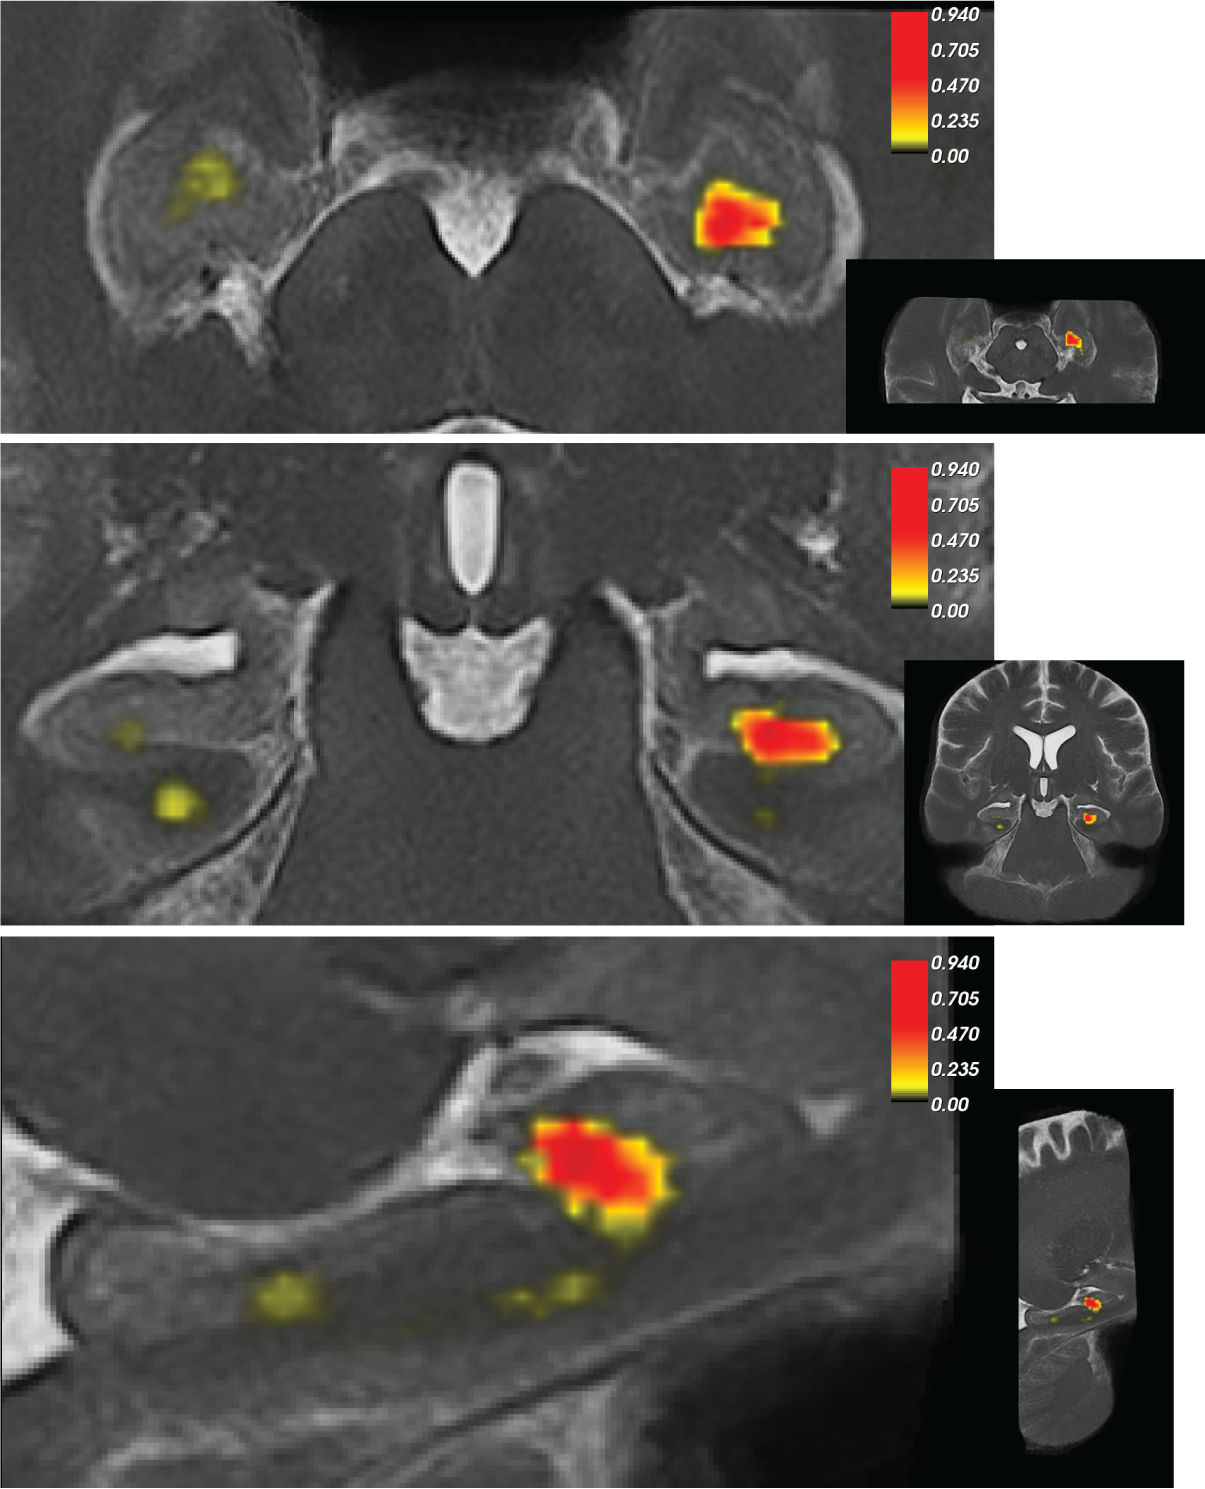
Figure 2 shows greater divergence of subfield volumes between HCs and MND patients when a group specific template was used compared to the ‘All’ template or in a standard approach using ASHS (Cross-sectional; Figure 2), which indicates labels fit homogeneously to priors using the standard method. Ultimately, both reverse normalisation segmentation strategies show a reduction in all individual hippocampus subfields for MND patients compared to HCs. However, this difference was much more pronounced using group-specific templates.We used statistical parametric mapping to evaluate the log jacobian determinant differences between HCs and MND patients (Figure 3). This test shows expansions and shrinkages in tissue comparing between groups. Permutation testing revealed significant clusters of decreased hippocampus size in MND patients compared to HCs in the left head of the hippocampus.
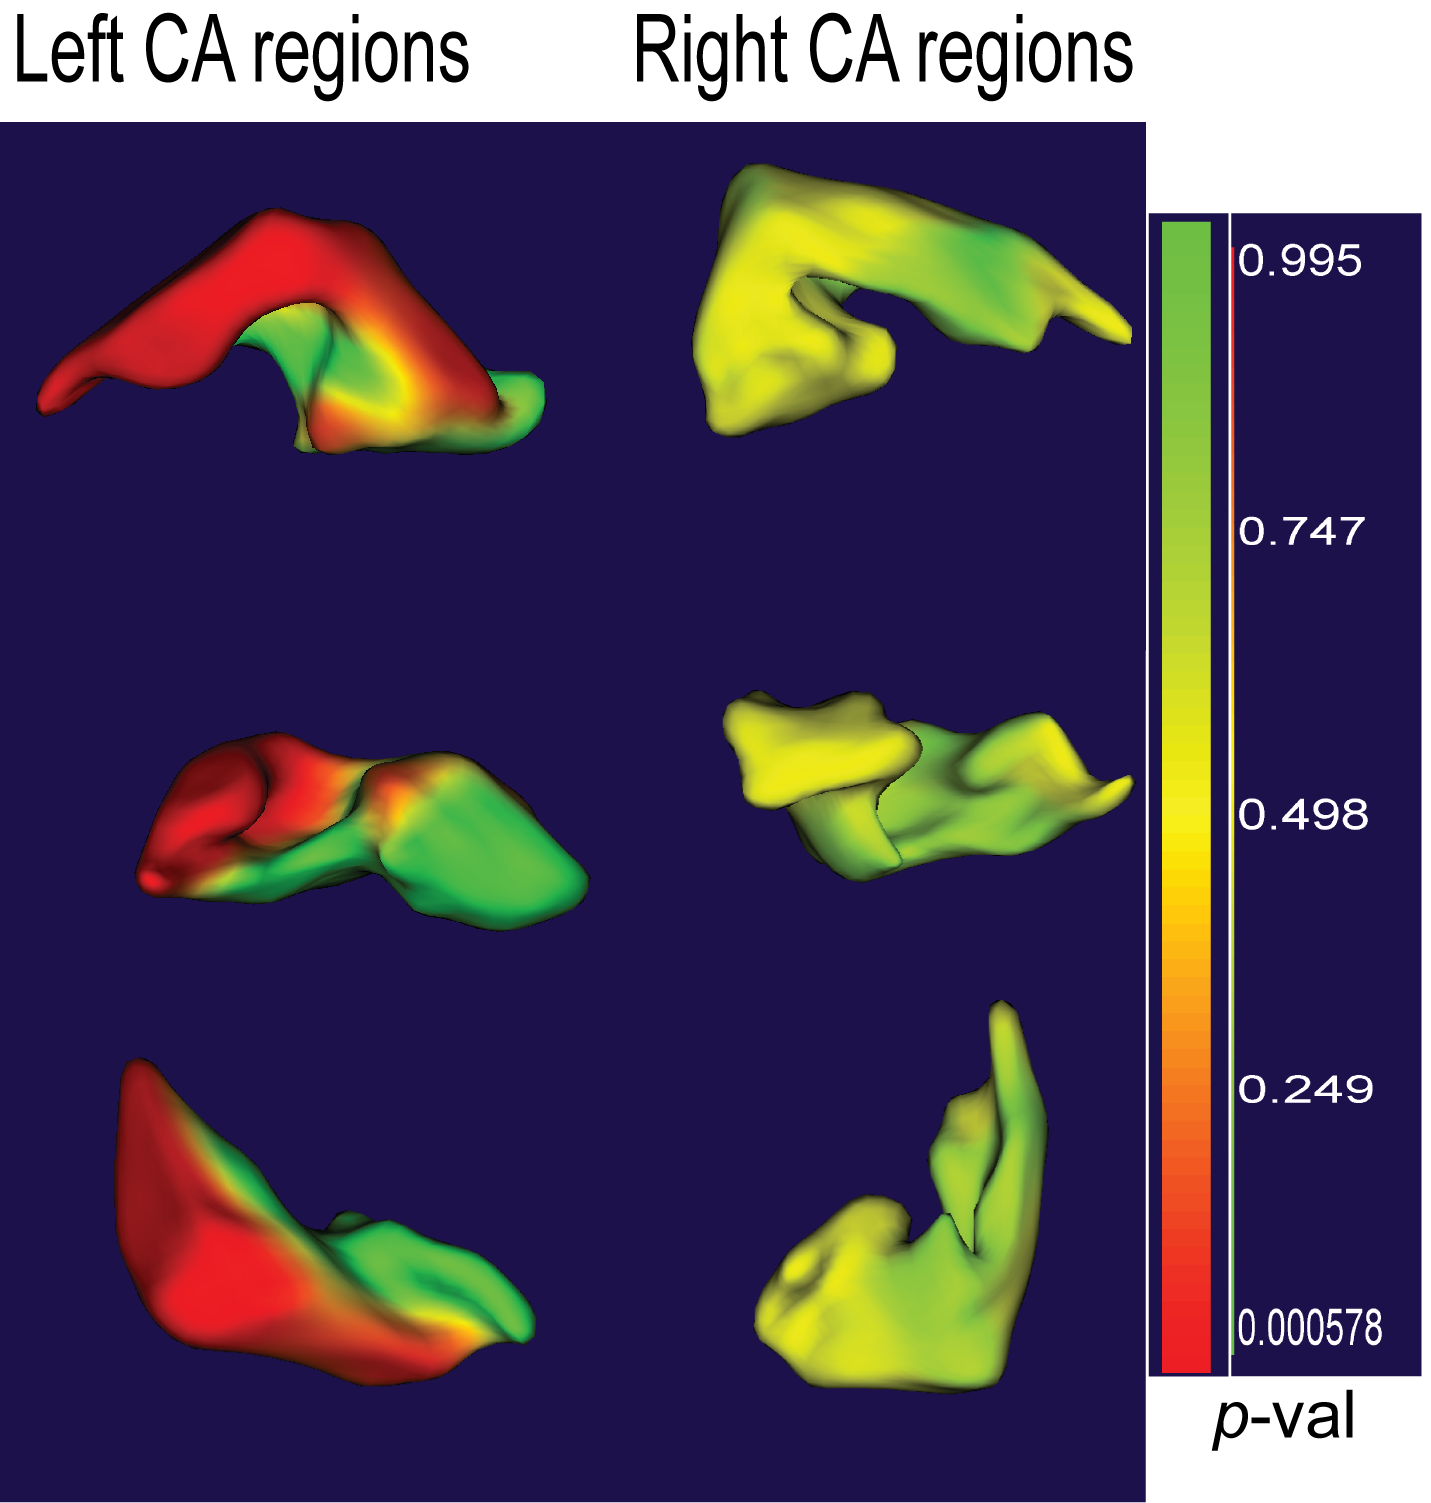
A shape analysis (Figure 4) of differences between HCs and MND patients revealed significant differences in shape for left, but not right CA1 regions, in line with previous manual segmentation work4.
Discussion and conclusion
We evaluated different segmentation strategies for hippocampus subfields based on deformable image registration in patients with heterogeneous brain morphology. Group specific templates showed greater differences in hippocampus subfield volumes in MND patients compared to HCs. The template transformations encode the variability of the population under study14, and creating population based templates with large samples reduce bias towards any individual. However, it may also be useful to use deformable registration-based segmentation that captures the average morphology of individual sub-groups.We confirmed our results with both statistical parametric mapping and a shape-based analyses, which uniquely show differences between the HCs and MND patients in terms of hippocampal morphology. The general nature of the analysis framework presented here allows its straightforward extensions towards other brain regions, such as upper motor neuron tracts, hypothalamus18, and related regions involved in MND disease progression. Note that especially longitudinal studies involving different dementia or MND subgroups would benefit from the increased sensitivity towards small volume changes.
In conclusion, template-based hippocampus subfield segmentation allowed for assessment of volume loss in MND. This may provide insight into reported CA1 shape changes in MND patients and the overlapping diagnosis of frontotemporal dementia and MND1 and may provide a useful imaging biomarker for improved diagnosis of MND. Further, this work is a step in the direction of more sensitive computational models for biological characterisation of MND in vivo.
Acknowledgements
The authors acknowledge the facilities and scientific and technical assistance of the National Imaging Facility, a National Collaborative Research Infrastructure Strategy (NCRIS) capability, at the Centre for Advanced Imaging, The University of Queensland. MB acknowledges funding from Australian Research Council Future Fellowship grant FT140100865. This research was undertaken with the assistance of resources and services from the Queensland Cyber Infrastructure Foundation (QCIF). The authors gratefully acknowledge Aiman Al Najjer, Nicole Atcheson, Anita Burns, and Amelia Ceslis for acquiring data.References
1. Lomen-Hoerth, C., Anderson, T. & Miller, B. The overlap of amyotrophic lateral sclerosis and frontotemporal dementia. Neurology 59, 1077–1079 (2002).
2. Wightman, G. et al. Hippocampal and neocortical ubiquitin-immunoreactive inclusions in amyotrophic lateral sclerosis with dementia. Neurosci. Lett. 139, 269–274 (1992).
3. Maekawa, S. et al. TDP-43 is consistently co-localized with ubiquitinated inclusions in sporadic and Guam amyotrophic lateral sclerosis but not in familial amyotrophic lateral sclerosis with and without SOD1 mutations. Neuropathology 29, 672–683 (2009).
4. Machts, J. et al. Global Hippocampal Volume Reductions and Local CA1 Shape Deformations in Amyotrophic Lateral Sclerosis. Front. Neurol. 9, (2018).
5. Mollink, J. et al. White matter changes in the perforant path area in patients with amyotrophic lateral sclerosis. Neuropathol. Appl. Neurobiol. (2019) doi:10.1111/nan.12555.
6. Hecht, M. J., Fellner, C., Schmid, A., Neundörfer, B. & Fellner, F. A. Cortical T2 signal shortening in amyotrophic lateral sclerosis is not due to iron deposits. Neuroradiology 47, 805–808 (2005).
7. Andre, J. B. et al. Toward Quantifying the Prevalence, Severity, and Cost Associated With Patient Motion During Clinical MR Examinations. J. Am. Coll. Radiol. 12, 689–695 (2015).
8. Despotović, I., Goossens, B. & Philips, W. MRI Segmentation of the Human Brain: Challenges, Methods, and Applications. Comput. Math. Methods Med. 2015, (2015).
9. Shaw, T. B. et al. Non-linear realignment improves hippocampus subfield segmentation reliability. NeuroImage 116206 (2019) doi:10.1016/j.neuroimage.2019.116206.
10. Wisse, L. et al. Automated hippocampal subfield segmentation at 7 tesla MRI. AJNR Am. J. Neuroradiol. 37, 1050–1057 (2016).
11. Petersen, R. C. et al. Alzheimer’s Disease Neuroimaging Initiative (ADNI). Neurology 74, 201–209 (2010).
12. Thomas, B. P. et al. High-resolution 7T MRI of the human hippocampus in vivo. J. Magn. Reson. Imaging JMRI 28, 1266–1272 (2008).
13. Joshi, S., Davis, B., Jomier, M. & Gerig, G. Unbiased diffeomorphic atlas construction for computational anatomy. NeuroImage 23, S151–S160 (2004).
14. Styner, M. et al. Framework for the statistical shape analysis of brain structures using spharm-pdm. in In Insight Journal, Special Edition on the Open Science Workshop at MICCAI (2006).
15. Avants, B. B. et al. The Optimal Template Effect in Hippocampus Studies of Diseased Populations. NeuroImage 49, 2457 (2010).
16. Yushkevich, P. A. et al. Automated volumetry and regional thickness analysis of hippocampal subfields and medial temporal cortical structures in mild cognitive impairment. Hum. Brain Mapp. 36, 258–287 (2015).
17. Jenkinson, M., Beckmann, C. F., Behrens, T. E. J., Woolrich, M. W. & Smith, S. M. FSL. NeuroImage 62, 782–790 (2012).18. McCombe, P. A. et al. Patient with ALS with a novel TBK1 mutation, widespread brain involvement, behaviour changes and metabolic dysfunction. J. Neurol. Neurosurg. Psychiatry 90, 952–954 (2019).
Figures