1565
STRUCTURAL PLASTICITY IN THE BRAIN OF CMT1A PATIENTS? A COMBINED VBM AND TBSS STUDY1University "Federico II", Naples, Italy, 2National Research Council, Naples, Italy
Synopsis
We investigated the presence of gray matter (GM) and white matter (GM) structural modifications in a homogeneous group of genetically defined CMT1A patients, by means of VBM and TBSS analyses, respectively. We found increased GM volume in CMT1A patients compared to HC encompassing the right paravermian portions of the cerebellar lobules III, IV and V, showing an inverse correlation with electrophysiological measures. These structural changes may reflect compensatory mechanisms in response to CMT1A peripheral nerve pathology, providing new insights into the comprehension of CNS physiopathology and its role in the development of clinical disability in this condition.
INTRODUCTION
Charcot-Marie-Tooth disease (CMT) 1A is an autosomal dominant demyelinating neuropathy caused by a duplication of the peripheral myelin protein 22 (PMP22) gene located on chromosome 171. Although being primarily a peripheral nervous system disease, several cases of central nervous system (CNS) involvement have been described in different forms of CMT2-4. Given this background, aim of our study was to investigate the presence of gray matter (GM) and WM structural modifications in a homogeneous group of genetically defined CMT1A patients, using volumetric MRI and DTI respectively. In addition, we explored the possible functional impact of these changes correlating MRI findings with clinical and electrophysiological measures.METHODS
ParticipantsIn this observational cross-sectional study, we enrolled patients with genetically confirmed PMP22 duplication5 along with a group of age- and sex-comparable healthy controls (HC). On the same day of the MRI exam, CMT1A patients underwent neurological examination and electrophysiological testing including the determination of the compound motor action potential (CMAP) summatory, computed as the sum of the compound action potentials of ulnar and median motor nerves, considered a global index of distal arm axonal damage6.
MRI data acquisition and analysis
All MRI exams were performed on the same 3-T scanner (Trio, Siemens Medical Systems, Erlangen, Germany), with the acquisition protocol including a structural T1-weighted volume (MPRAGE; voxel size=1x1x1 mm3) for the Voxel-Based Morphometry (VBM) analysis, along with DTI data acquired using an echo-planar imaging sequence (TR=7,400 ms; TE=88 ms, 64 directions; B-factors 0 and 1,000 s/mm2, 9 B0 images, voxel size=2.2x2.2x2.2 mm3) for the Tract-Based Spatial Statistics (TBSS) analysis. For the VBM analysis, structural data were processed using the Computational Anatomy Toolbox (CAT12, http://www.neuro.uni-jena.de/cat) via the Statistical Parametric Mapping software package (SPM12, http://www.fil.ion.ucl.ac.uk/spm). We used the default settings that are described in detail in the CAT12 manual (http://dbm.neuro.uni-jena.de/cat12/CAT12-Manual.pdf). For each study, the Total Intracranial Volume (TIV) was also estimated as the sum of GM, WM and CSF native volumes. TBSS analysis7 was performed using FSL v6.0 (FMRIB’s Software Library, http://fsl.fmrib.ox.ac.uk/fsl), and following the standard pipeline (https://fsl.fmrib.ox.ac.uk/fsl/fslwiki/TBSS). The analysis was conducted for both fractional anisotropy (FA) and non-FA DTI metrics (i.e. mean diffusivity [MD], axial diffusivity [AD] and radial diffusivity [RD]).
Statistical analysis
For the VBM analysis, the normalized, modulated and smoothed GM maps were statistically analyzed to assess local volume differences between the two groups using the General Linear Model (GLM, implemented in SPM12), including age, sex and TIV as confounding variables. Differences were considered significant for p<0.05, corrected for family-wise error at cluster level. For the TBSS, skeletonized FA and non-FA maps were fed into a voxel-wise cross-subject nonparametric analysis based on permutations applied to the GLM8, including age and sex as nuisance covariates. Results were considered significant for p<0.05, corrected for multiple comparisons at cluster level using the threshold-free cluster enhancement approach7. For all between-group analyses, both contrasts (i.e. HC > CMT and HC < CMT) were tested. When regional differences in terms of GM volume or DTI metrics emerged between the two groups, the corresponding first eigenvariate was extracted from the cluster and adjusted for age, sex and TIV (the latter for the VBM clusters only). The obtained residuals were standardized and their relationship with clinical and electrophysiological variables was assessed via correlation analyses. Results of the correlation analyses were considered statistically significant when p<0.05, Bonferroni corrected for multiple comparisons.
RESULTS
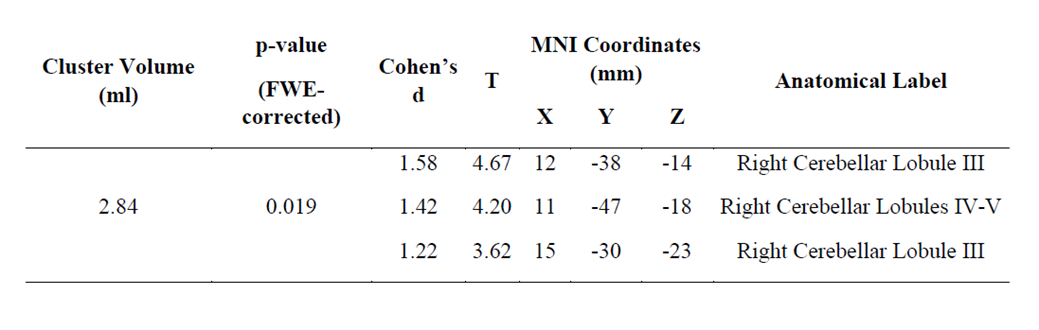
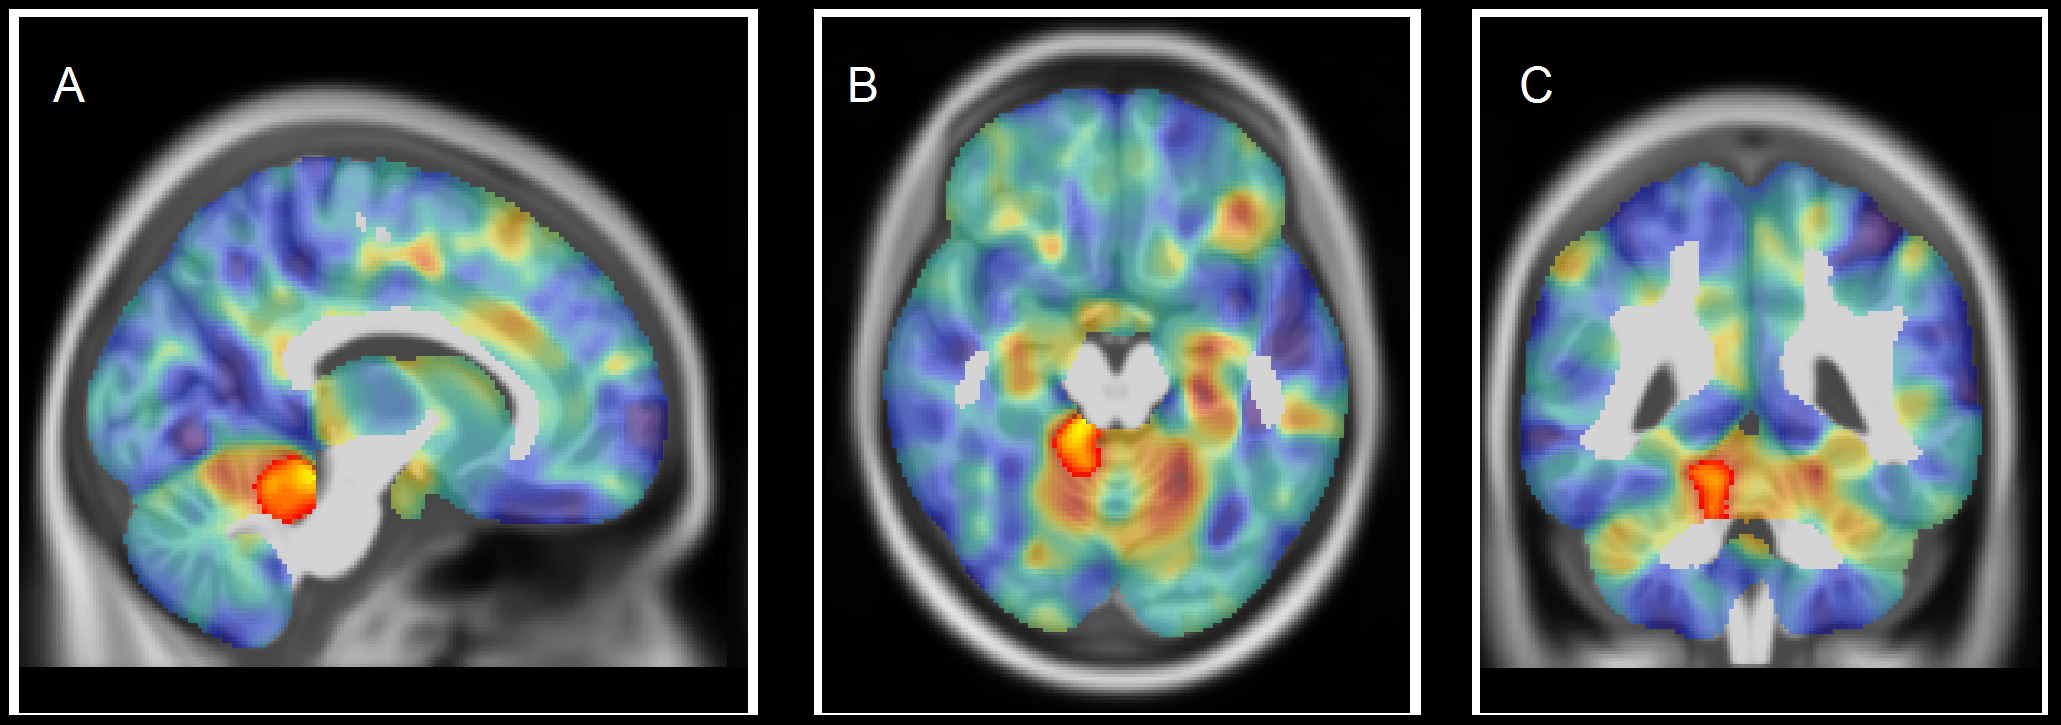
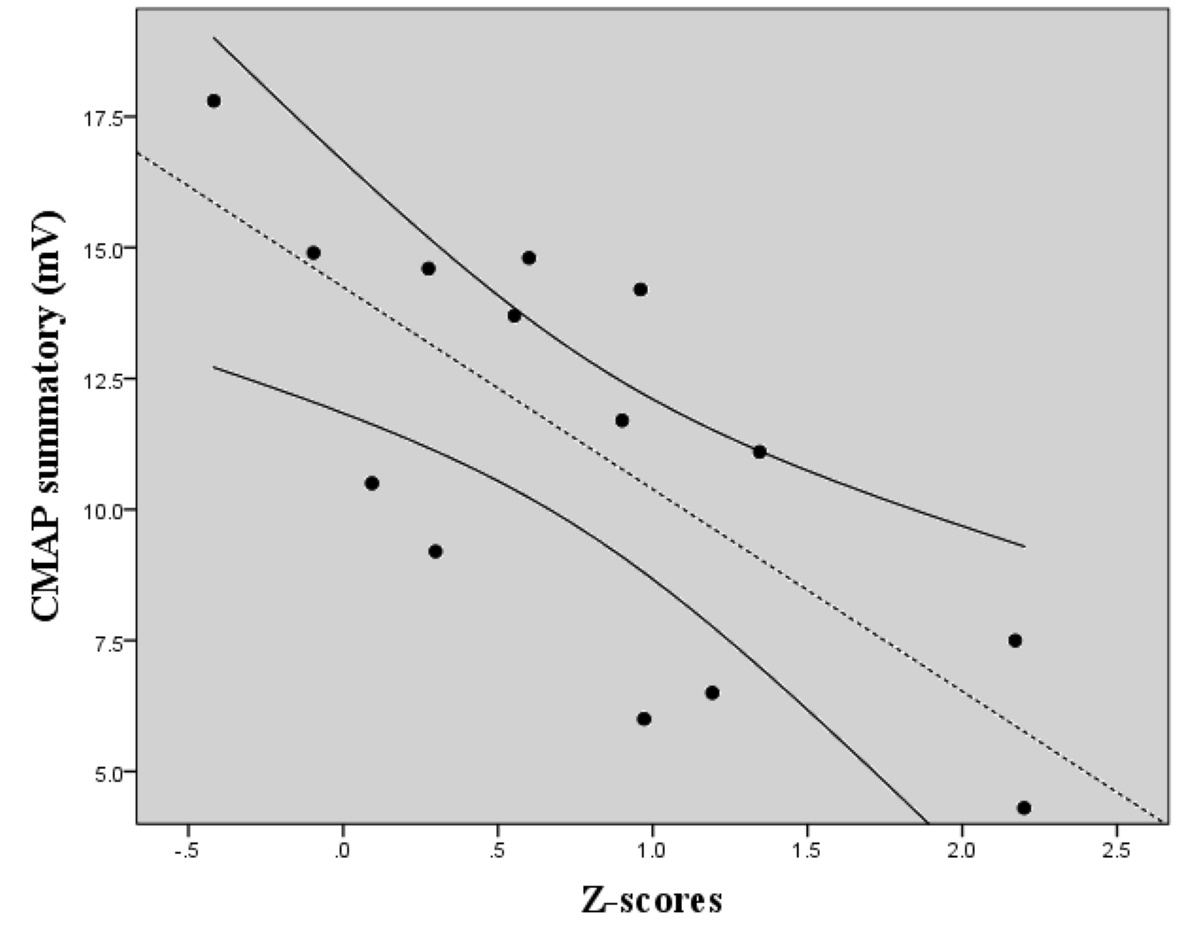
Twenty CMT1A patients (34.5 ±11.1years; M/F=11/9) were enrolled from May 2017 to May 2019, along with 20 HC (30.1 ± 10.2years; M/F=11/9) of comparable age and sex. The VBM analysis revealed a single cluster of significantly increased GM volume in CMT1A patients compared to HC encompassing the right paravermian portions of the cerebellar lobules III, IV and V (Figures 1-2). No statistically significant between-group differences emerged at the TBSS analysis when considering the FA, MD, AD and RD metrics. A significant negative correlation (r=-0.738, p=0.003) was found between the CMAP summatory values and the age, sex and TIV-adjusted z-scores of the first eigenvariate extracted from the cluster of significant between-group difference at the VBM analysis (Figure 3).DISCUSSION
In this study, we investigated the presence of possible structural modifications in the brain of CMT1A patients, providing evidence of GM reorganization in the anterior cerebellum in this condition, correlating with electrophysiological measures. According to the cerebellar functional topographic organization, lobules of the anterior lobe contain the representation of the sensorimotor cerebellum9. Hence, the observed increase of anterior cerebellar regional volume may reflect mechanisms of structural plasticity10 aimed at compensating peripheral nerve deficit in CMT1A patients. Also, we found an inverse correlation between the increase of GM volume in the anterior cerebellum and the CMAP summatory. Thus, a greater compensatory neuroplasticity effort by the anterior cerebellar GM could modulate the effect of axonal degeneration on functional impairment, thus possibly explaining the lack of correlation between cerebellar structural modifications and clinical functional tests.CONCLUSION
Our data shows evidence for structural reorganization in the anterior cerebellum of CMT1A patients, possibly reflecting compensatory mechanisms in response to peripheral nerve pathology and providing new insights into the comprehension of CNS physiopathology and its role in the development of clinical disability in this condition.Acknowledgements
No acknowledgement found.References
1. van Paassen BW, van der Kooi AJ, van Spaendonck-Zwarts KY, Verhamme C, Baas F, de Visser M. PMP22 related neuropathies: Charcot-Marie-Tooth disease type 1A and Hereditary Neuropathy with liability to Pressure Palsies. Orphanet journal of rare diseases 2014;9:38.
2. Paulson HL, Garbern JY, Hoban TF, et al. Transient central nervous system white matter abnormality in X-linked Charcot-Marie-Tooth disease. Ann Neurol 2002;52:429-434.
3. Chung KW, Kim SB, Park KD, et al. Early onset severe and late-onset mild Charcot-Marie-Tooth disease with mitofusin 2 (MFN2) mutations. Brain 2006;129:2103-2118.
4. Brockmann K, Dreha-Kulaczewski S, Dechent P, et al. Cerebral involvement in axonal Charcot-Marie-Tooth neuropathy caused by mitofusin2 mutations. J Neurol 2008;255:1049-1058.
5. Murphy SM, Laura M, Fawcett K, et al. Charcot-Marie-Tooth disease: frequency of genetic subtypes and guidelines for genetic testing. J Neurol Neurosurg Psychiatry 2012;83:706-710.
6. Pareyson D, Reilly MM, Schenone A, et al. Ascorbic acid in Charcot–Marie–Tooth disease type 1A (CMT-TRIAAL and CMT-TRAUK): a double-blind randomised trial. The Lancet Neurology 2011;10:320-328.
7. Smith SM, Jenkinson M, Johansen-Berg H, et al. Tract-based spatial statistics: voxelwise analysis of multi-subject diffusion data. Neuroimage 2006;31:1487-1505.
8. Bullmore E, Brammer M, Williams SC, et al. Statistical methods of estimation and inference for functional MR image analysis. Magnetic resonance in medicine 1996;35:261-277.
9. Stoodley CJ, Schmahmann JD. Evidence for topographic organization in the cerebellum of motor control versus cognitive and affective processing. Cortex 2010;46:831-844.
10. Zatorre RJ, Fields RD, Johansen-Berg H. Plasticity in gray and white: neuroimaging changes in brain structure during learning. Nat Neurosci 2012;15:528-536.
Figures