1564
Proximal Nerve Quantitative MRI in Charcot-Marie-Tooth (CMT) Diseases1Department of Neurology, Wayne State University, Detroit, MI, United States, 2Department of Radiology, Wayne State University, Detroit, MI, United States, 3Center for Molecular Medicine & Genetics, Wayne State University, Detroit, MI, United States, 4Department of Biochemistry, Microbiology and Immunology, Wayne State University, Detroit, MI, United States, 5John D. Dingell VA Medical Center, Detroit, MI, United States
Synopsis
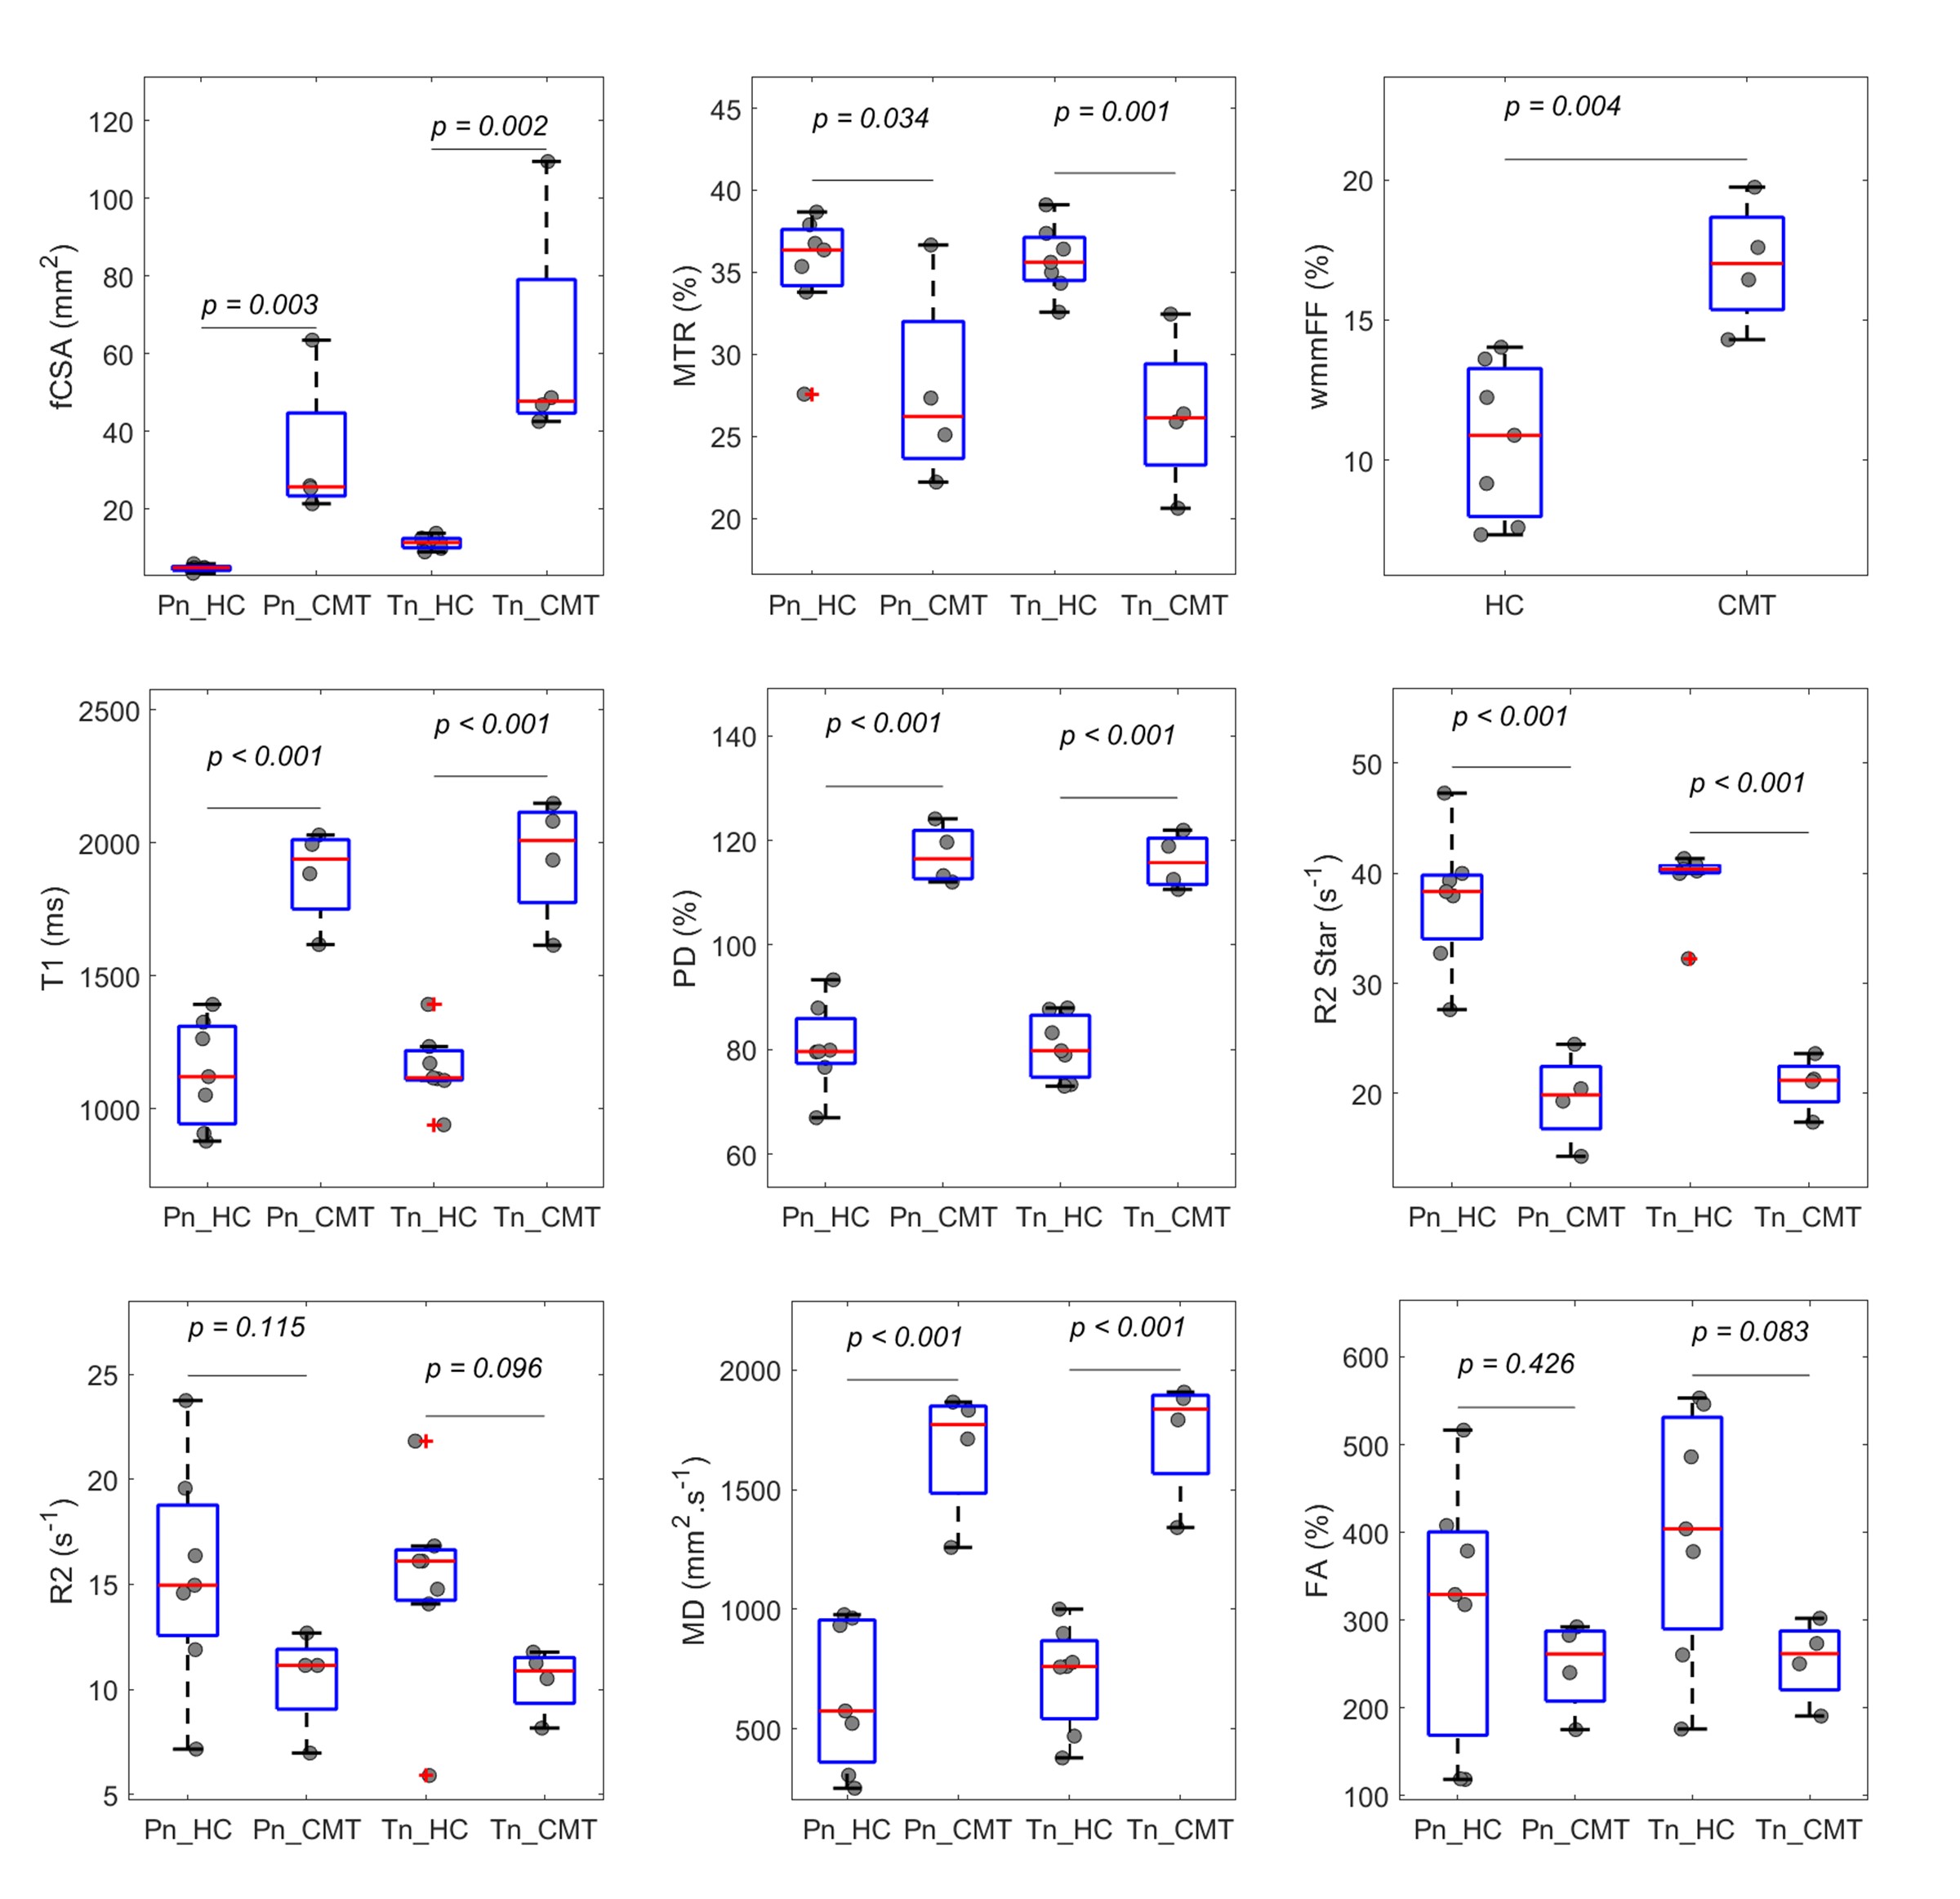
To test the hypothesis that quantitative MRI (qMRI) detects proximal nerve dysmyelination and axonal degeneration in Charcot-Marie-Tooth (CMT) diseases. Nine qMRI indices were collected, including whole muscle mean fat fraction (wmmFF), nerve fascicular cross-sectional area (fCSA), magnetization transfer ratio (MTR), T1, proton density (PD), R2, R2*, mean diffusivity (MD) and fractional anisotropy (FA). Compared to controls, patients with CMT had significantly elevated fCSA, T1, PD, T2* and MD for both divisions of sciatic nerves and wmmFF, elevated T2 for the tibial division but not the peroneal division, and decreased MTR for both divisions of sciatic nerves.
Introduction
Charcot-Marie-Tooth (CMT) diseases are a group of inherited peripheral nerve diseases caused by monogenic mutations.1, 2 CMT mainly results in two key pathologies, dysmyelination and axonal degeneration, leading to sensory loss and muscle weakness. Current outcome measures, such as nerve conduction study (NCS), or CMT neuropathy scores (CMTNS), depend on changes in distal limb nerves and muscles, which are often severely degenerated, thereby resulting in a “floor effect” for longitudinal studies. This shortcoming can be circumvented by imaging the proximal nerve (e.g. sciatic nerve) with non-invasive quantitative MRI (qMRI). There have been only a few studies using nerve magnetization transfer ratio (MTR), T2, mean diffusivity (MD), and fractional anisotropy (FA) to study proximal nerves.2-7 In addition, whole muscle mean fat fraction (wmmFF) has emerged as a sensitive marker for axonal loss in patients with CMT.3 However, muscle atrophy and/or fat infiltration are downstream effects of nerve denervation. Direct evaluation of peripheral nerves using qMRI is sparse in inherited peripheral nerve diseases. With the rapid pace of gene therapy development in CMT, non-invasive outcome measurements become a pressing need, particularly for clinical trials. This pilot study was designed to test the hypothesis that qMRI detects proximal nerve myelin/axon pathologies in CMT diseases. Nine qMRI indices were proposed, including wmmFF, nerve fascicular cross-sectional area (fCSA), MTR, T1, proton density (PD), R2, R2*, MD and FA.Methods
Subjects: We recruited 4 patients with CMT (one genetically confirmed CMT type 4J8; three confirmed hereditary sensory autonomic neuropathy type 1c9) and 7 age/sex/body-mass-index (BMI) matched controls approved by our local IRB.Data Acquisition: All subjects were scanned on a Siemens Verio 3T scanner with an 8-channel knee coil. The subject’s right thigh was placed into the coil with feet-first-supine position, centered at 30% of femur length from femoral condyles, which was measured in advance using whole-leg coronal localizers. A previously designed imaging protocol2 was performed in the axial plane with FOV=154mm2 and slice thickness=3mm: i) 3D-GRE for high resolution (HR) anatomical nerve fascicular image, resolution=0.15x0.15mm2. ii) Interleaved in-/out-of-phase 3D-GRE for water/fat separation10, 11, resolution=0.3x0.3mm2. iii) Dual-echo 2D-TSE for apparent T2 mapping, resolution=0.6x0.6mm2. iv) Strategically acquired gradient echo (STAGE)12-14 scans using dual-echo 3D-GRE for simultaneously T1, PD, radiofrequency field variations (B1+, B1-), and R2* maps, resolution=0.3x0.3mm2. v) 3D-GRE scans with/without MT pulse for MTR, resolution=0.6x0.6mm2. vi) 2D single-shot SE-EPI-DTI, resolution=1.2x1.2mm2 with 20 diffusion directions and two b-values=0, 1000 s/mm2.
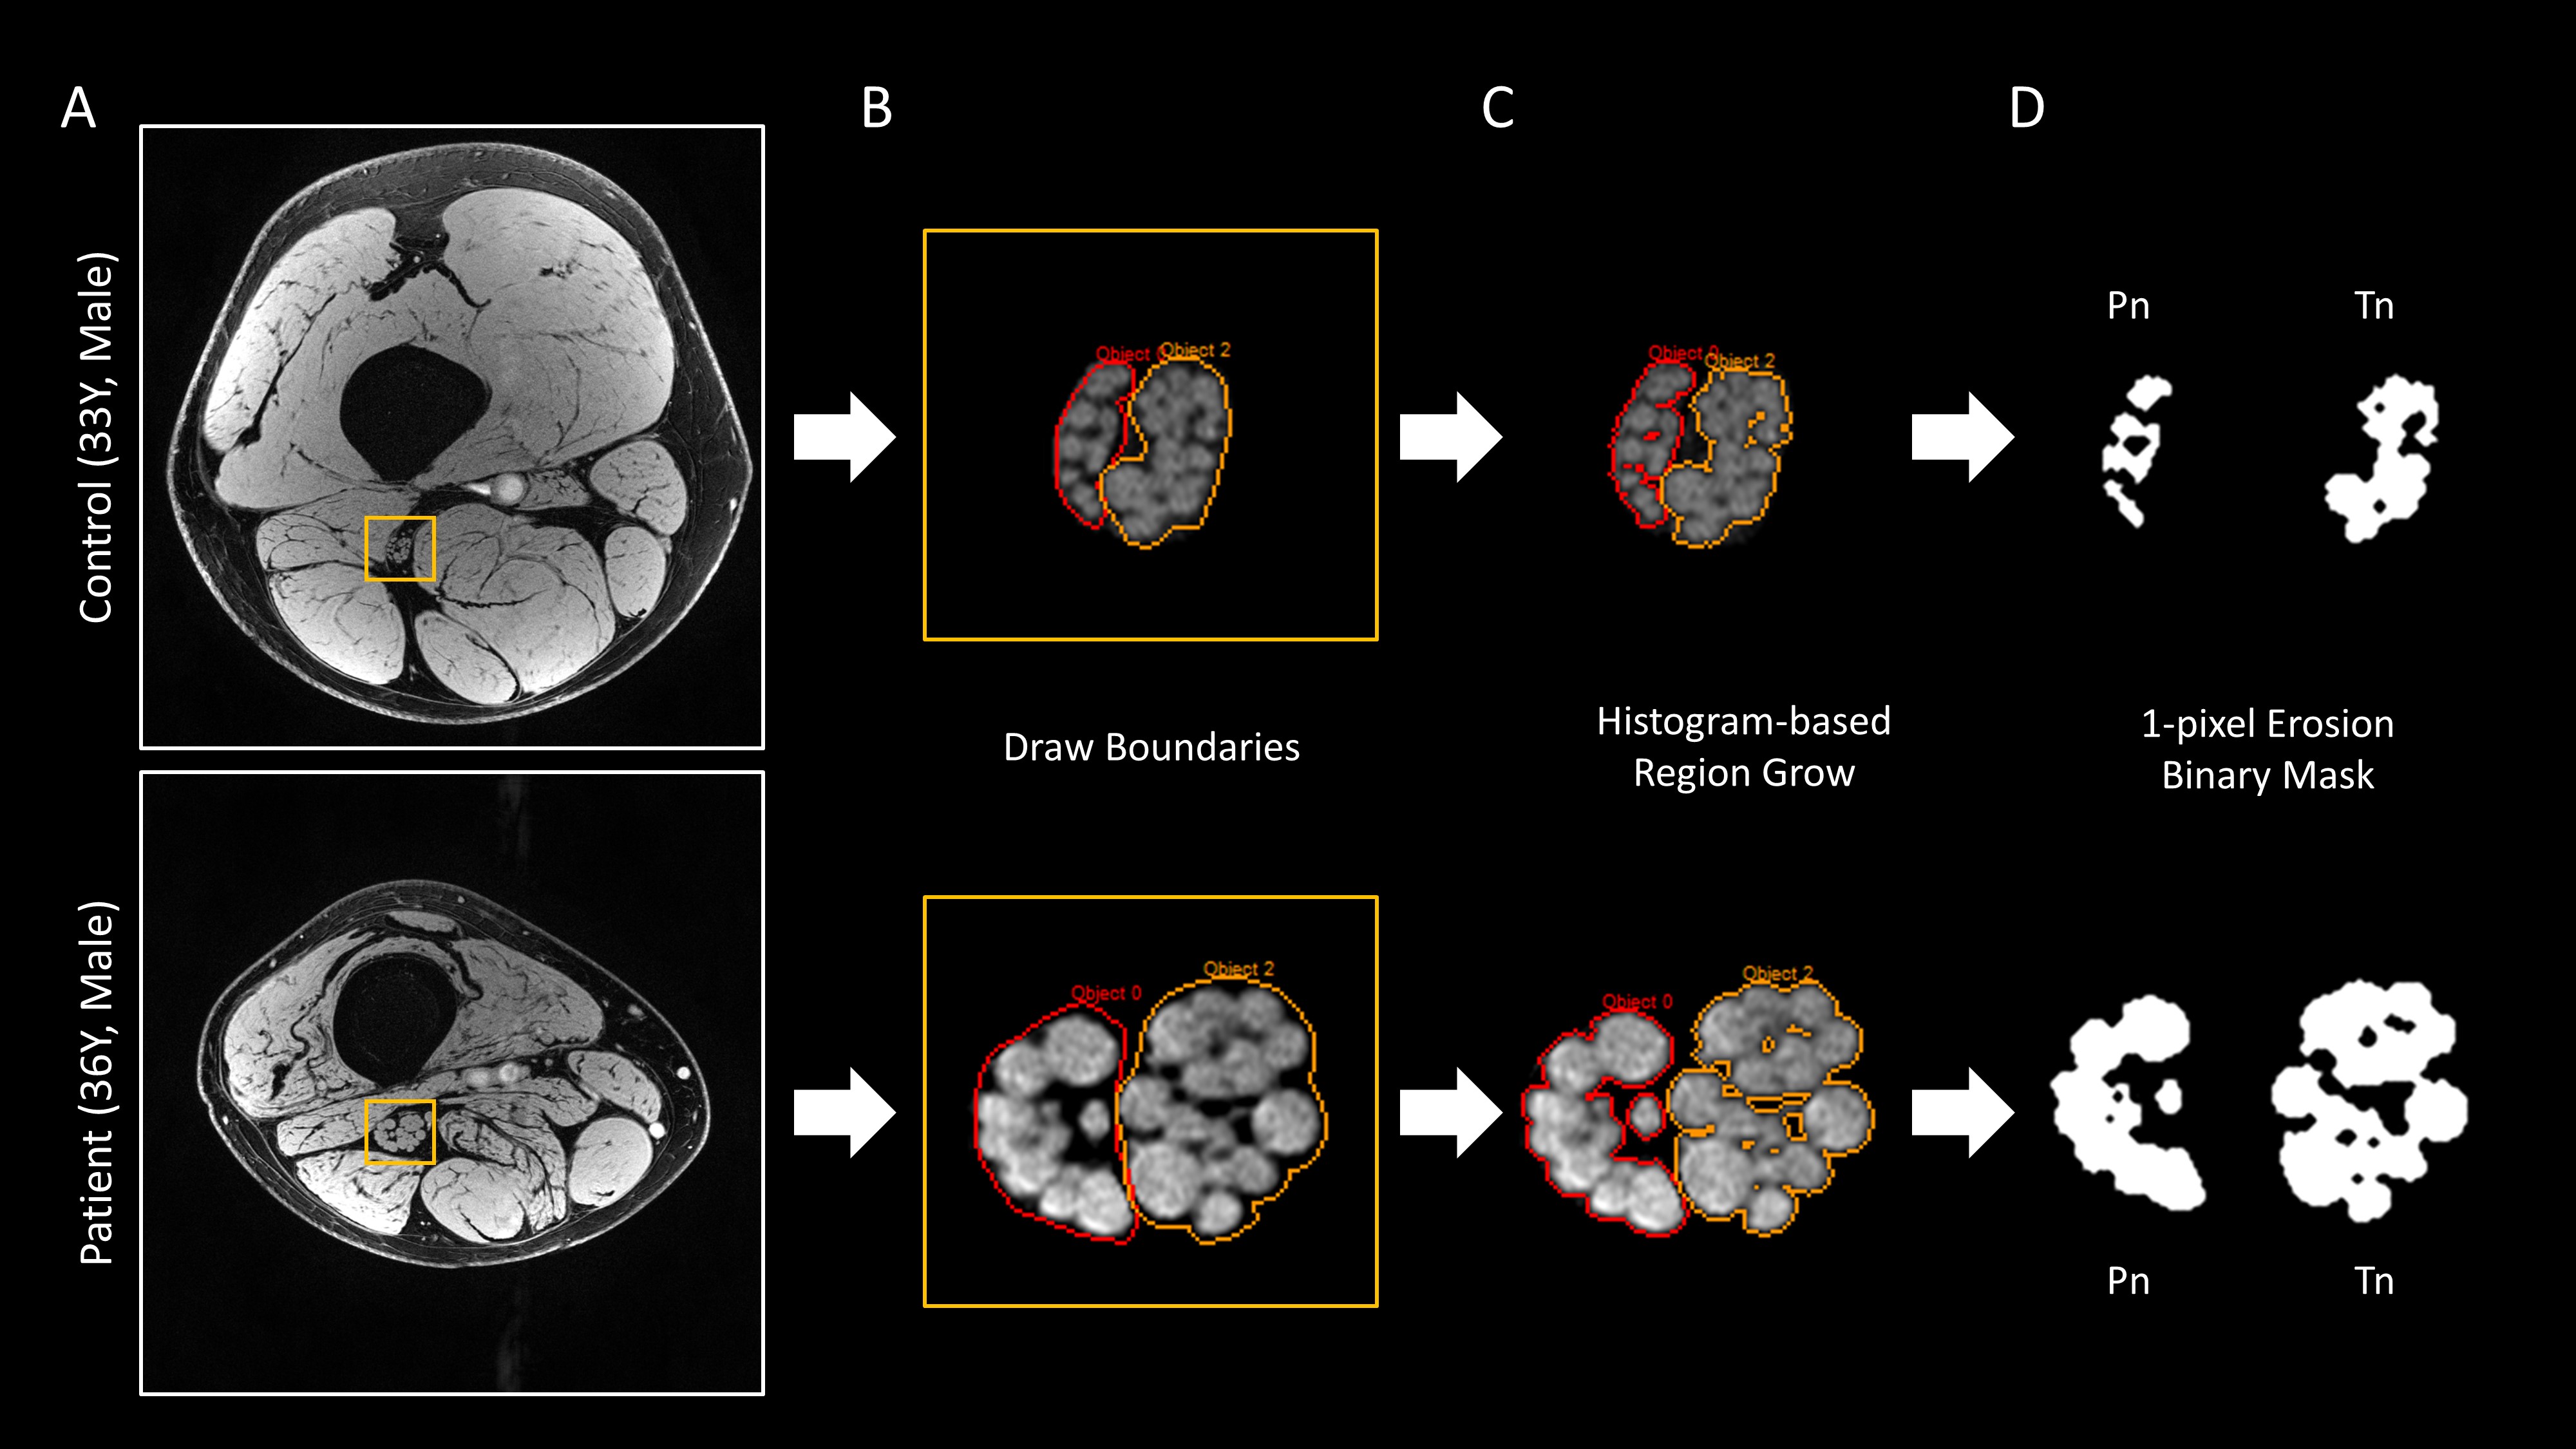
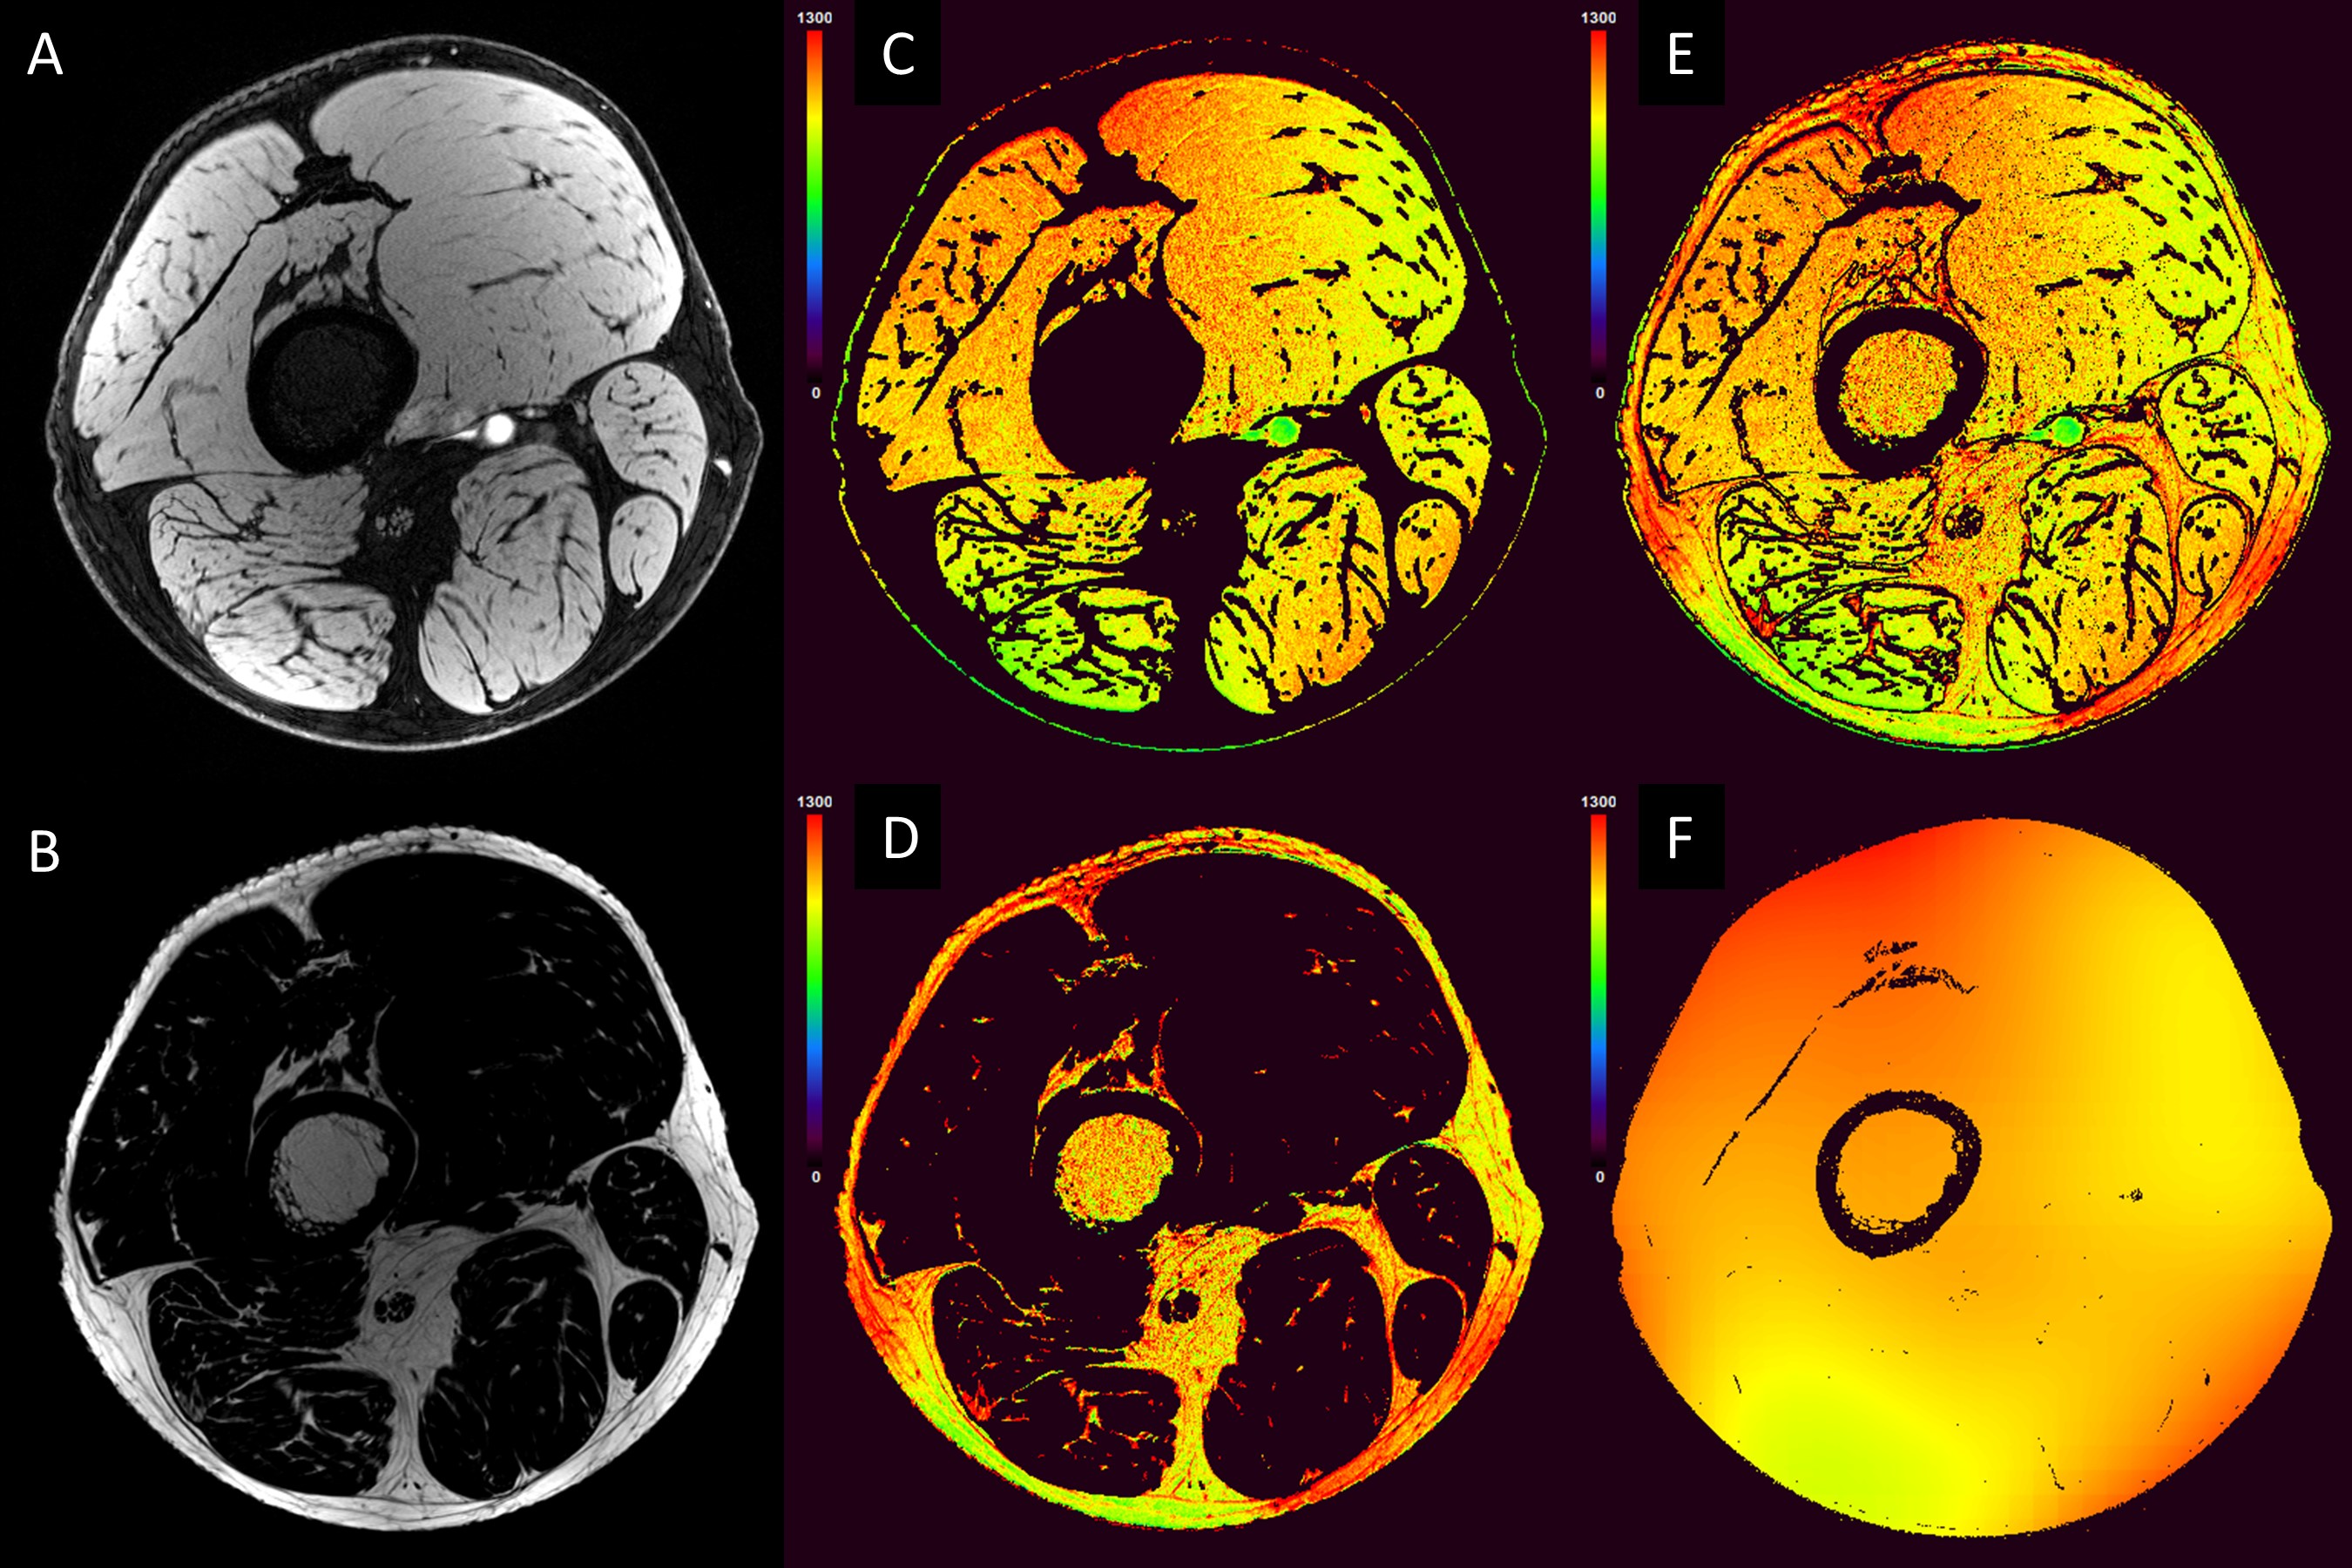
Data Processing and Analysis: Data processing and statistical analyses were conducted using MATLAB: i) All images were co-registered to the HR image using SPM15. ii) The HR image was used for segmenting the two divisions of sciatic nerve, tibial nerve (Tn) and common peroneal nerve (Pn) in a semi-automated fashion (Figure 1). The nerve fascicular binary masks were used to extract the nerve’s qMRI indices and served for calculating fCSA. iii) Two-point Dixon water/fat separation was performed using previous method with the interleaved acquired echoes10, 11. iv) The water/fat masks were then used as reference regions (T1muscle=1400ms and T1fat=370ms)16, 17 for the STAGE processing generating R2*, T1, PD, B1+ and B1- mappings (Figure 2). This process is similar to the method for the brain.12-14 v) MTR was calculated as MTR=(1-(MTon/MToff))*100% with B1+ correction.4 vi) Apparent T2 was generated by fitting the 2D-TSE images. MD and FA were reconstructed from the scanner. vii) The fat fraction was calculated as FF=F/(F+W)*100%. The boundaries of muscle were manually drawn to extract wmmFF. One-way ANOVA tests were performed for comparing the two cohorts for each index extracted from the central slice.
Results
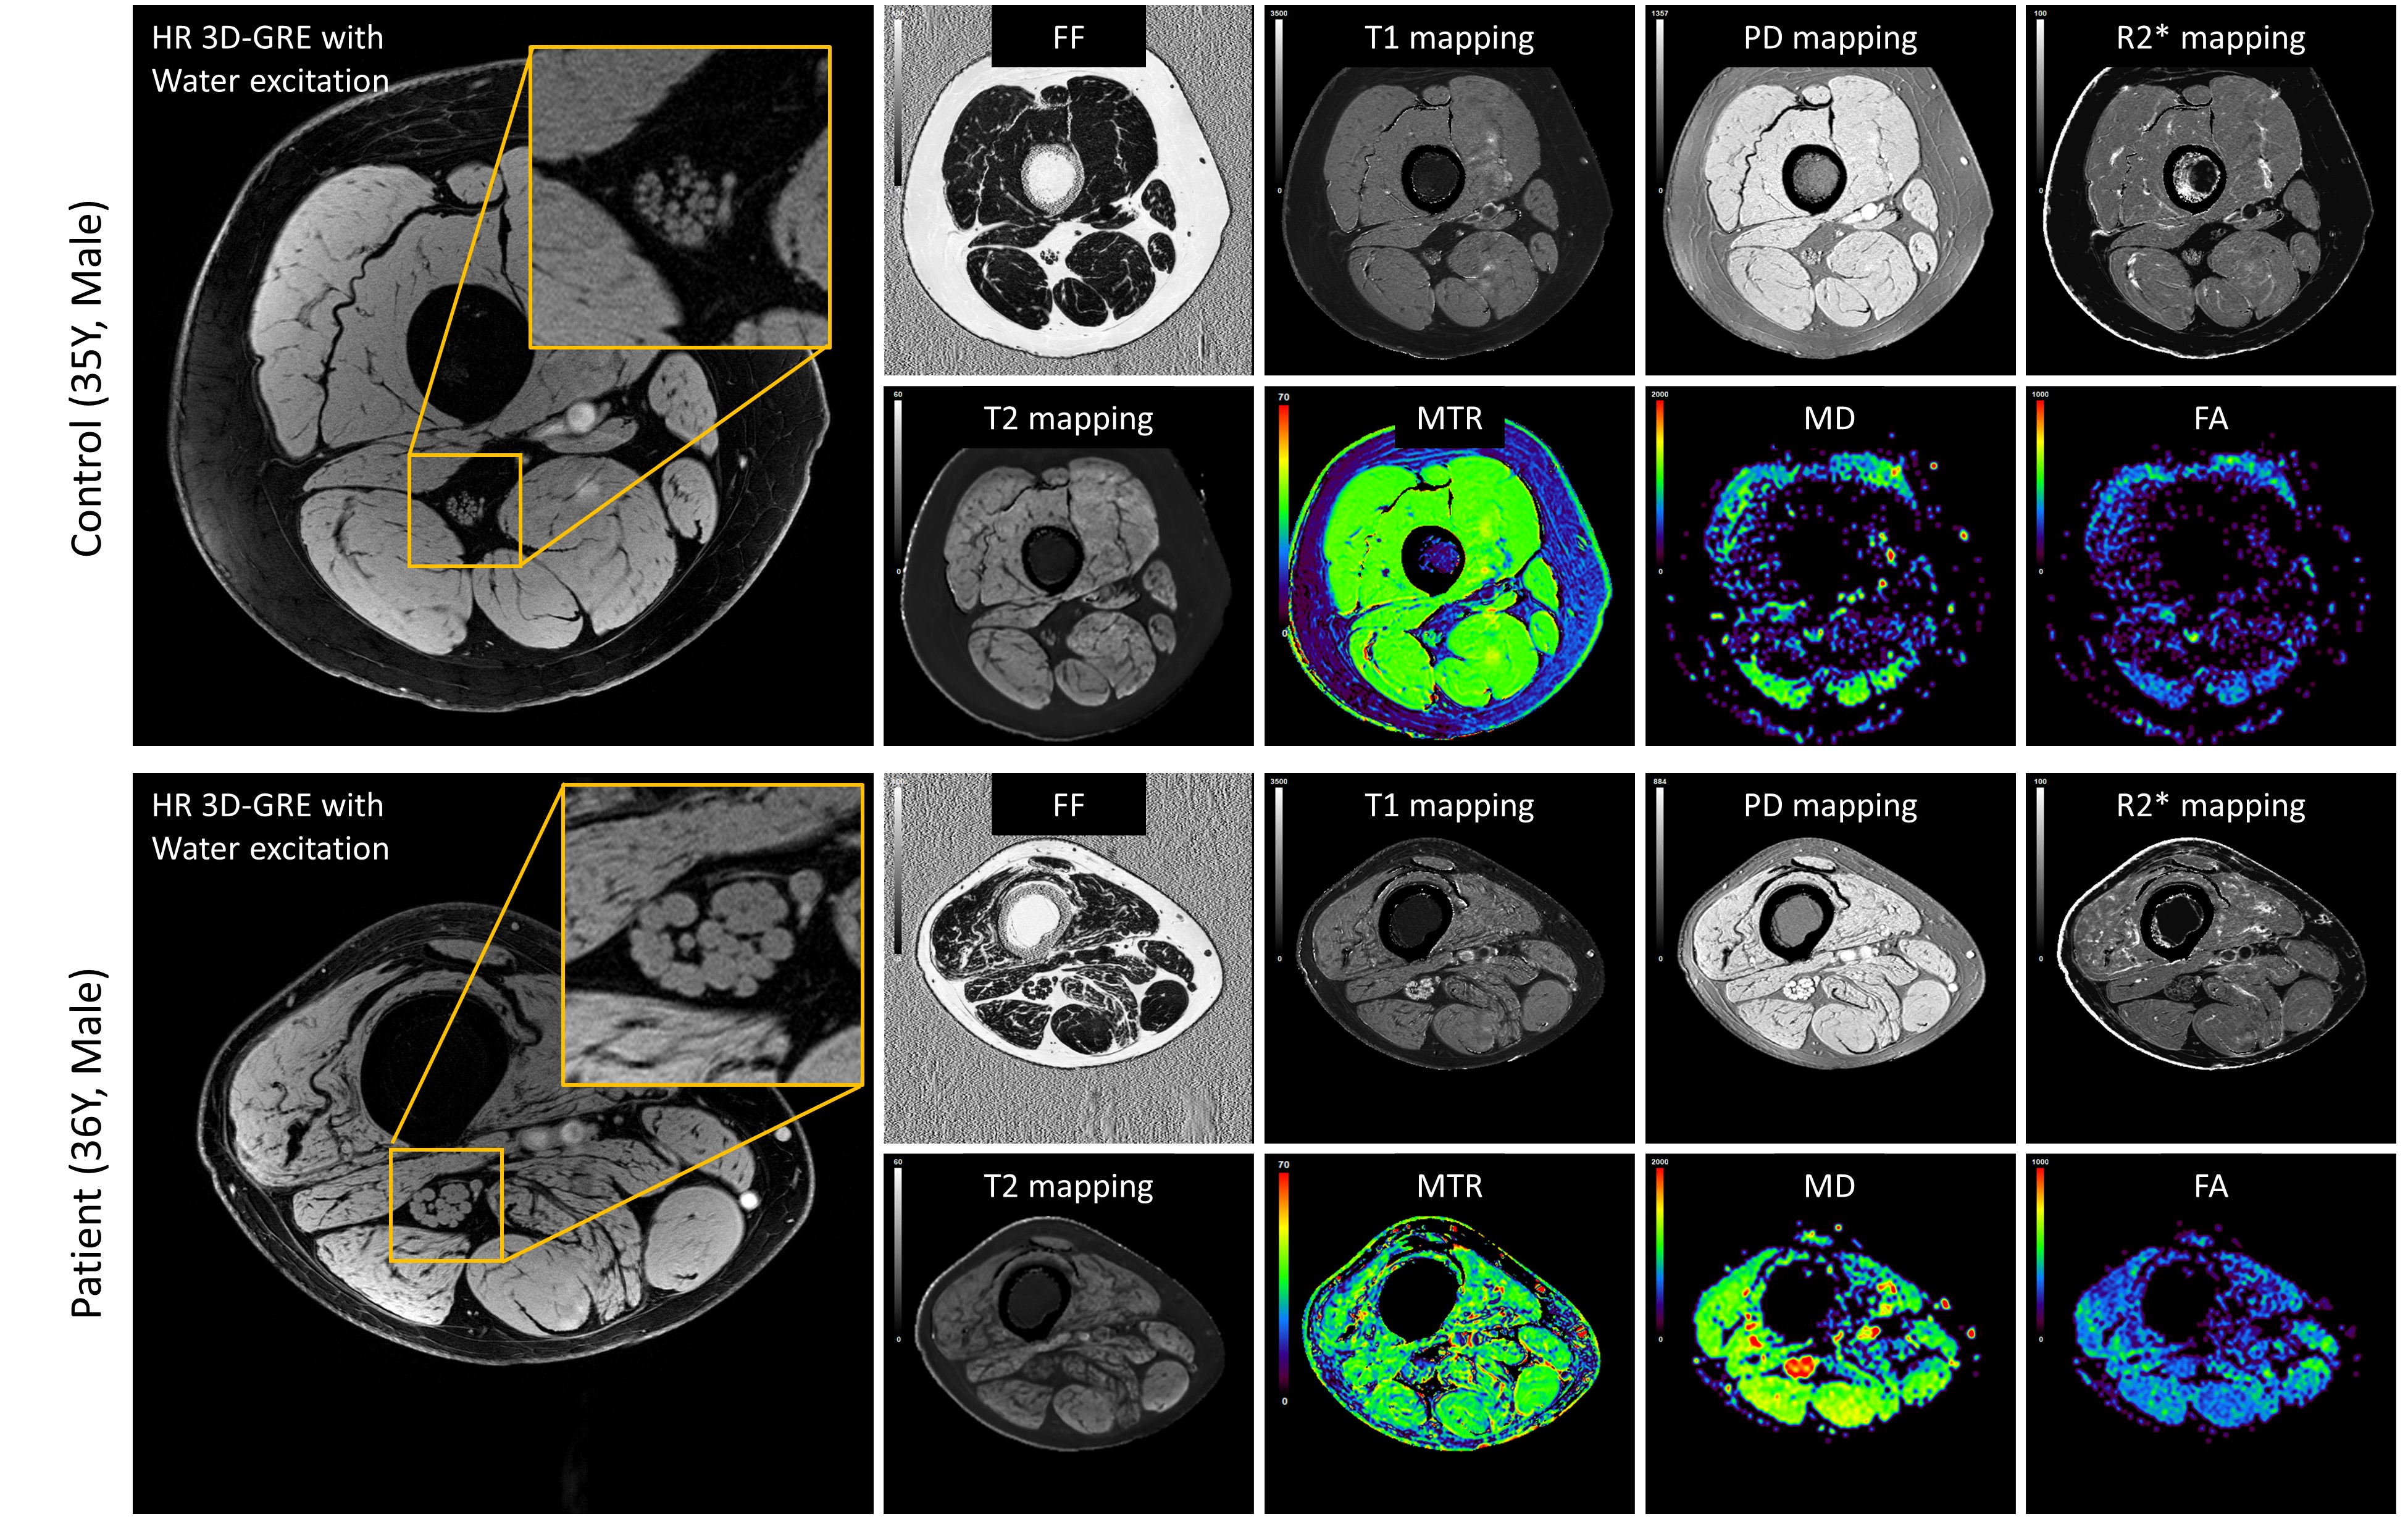
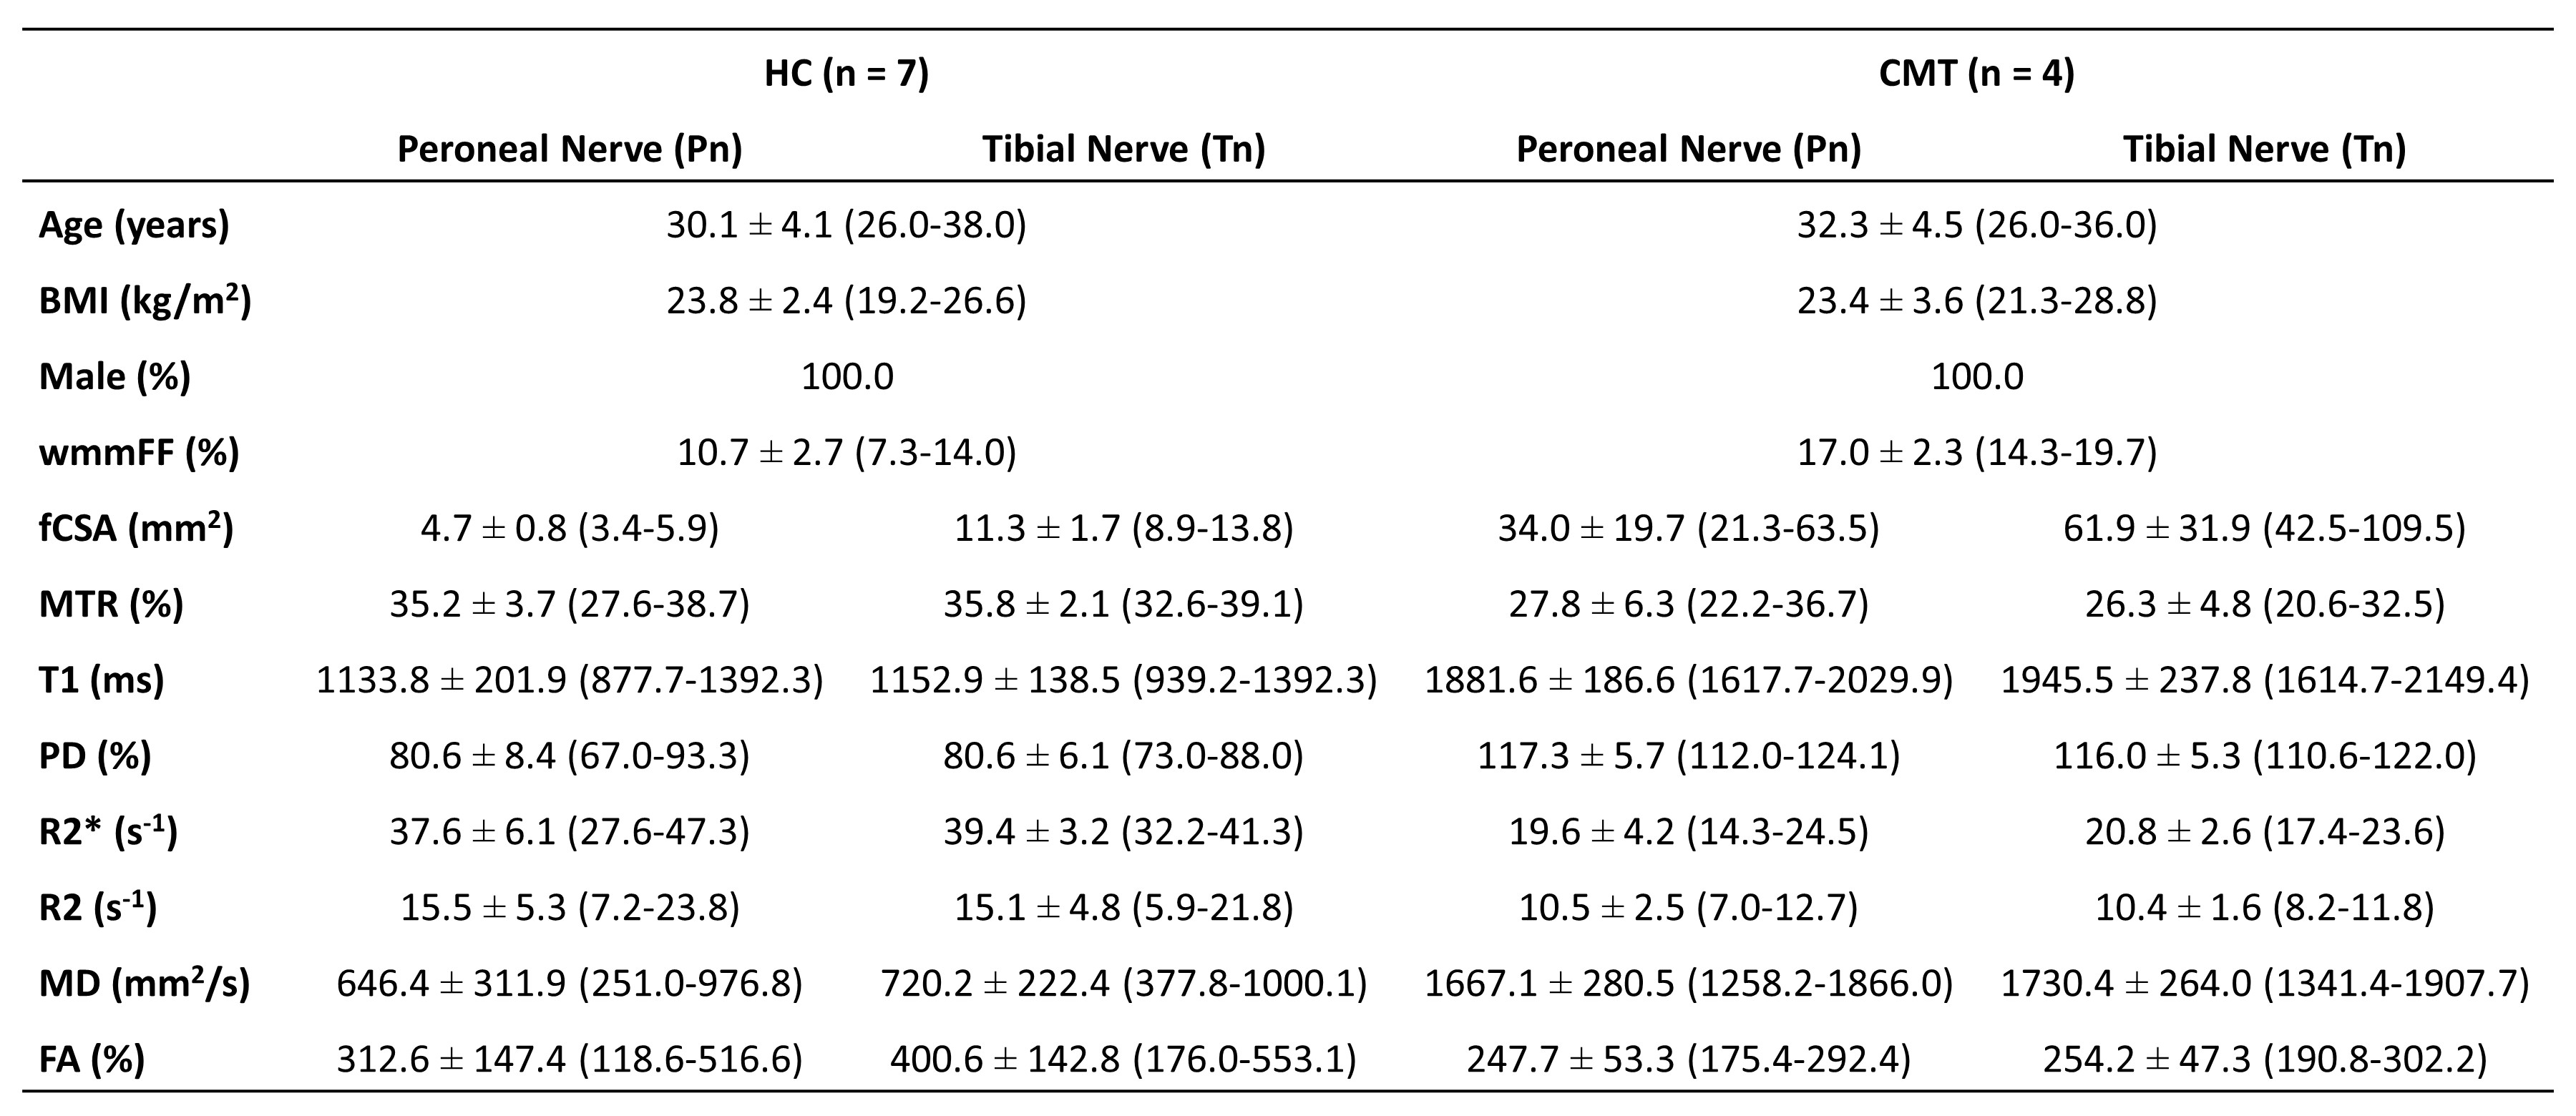
Figure 3 illustrates representative images. Summary demographic and qMRI data are shown in Figure 4. Nerve fascicles were clearly visualized from all data on the 150-micron resolution image (Figure 3). Compared to controls, the CMT cohort had significantly elevated fCSA, T1, PD, T2* and MD for both divisions of sciatic nerves as well as wmmFF, and elevated T2 only for the Tn division, while MTR was decreased for both divisions. FA in both divisions was not different between controls and patients with CMT (Figure 5).Discussion and Conclusion
The elevated T1, PD, and MD as well as decreased MTR, R2*, and R2 in patients with CMT mainly reflect changes of water content and/or myelin density in sciatic nerve. MTR, R2, diffusivity and wmmFF results are consistent with previous studies.3, 4, 7 The interleaved sequence insures minimum motion interference in the water/fat separation. A limitation in this work is that the STAGE processing needs both fat and muscle regions as references for fitting the B1+ and B1- maps. If the data were acquired with fat suppression, there would not be enough pixels for fitting B1 when muscle has been severely diseased. However, the fascicular assessment of nerve fascicle masks from HR images mitigates the interference of surrounding fatty tissues. R2* is the one most insensitive to radiofrequency field inhomogeneity. The larger data variation of Pn compared with Tn was due to the smaller size of Pn. The current sample size is still small. Further analysis with more subjects for functional correlations are needed. Nevertheless, in conclusion, our results show that the qMRI indices are able to detect proximal nerve pathologies in patients with CMT.Acknowledgements
This work is supported by grants from DMC Foundation, NINDS (R01NS066927) and Department of Veterans Affairs (IBX003385A).References
1. Li J, Bai Y, Ghandour K, et al. Skin biopsies in myelin-related neuropathies: bringing molecular pathology to the bedside. Brain 2005;128:1168-1177.
2. Chen Y, Haacke EM, Li J. Peripheral nerve magnetic resonance imaging. F1000Research 2019,8(F1000 Faculty Rev):1803 (https://doi.org/10.12688/f1000research.19695.1).
3. Morrow JM, Sinclair CD, Fischmann A, et al. MRI biomarker assessment of neuromuscular disease progression: a prospective observational cohort study. The Lancet Neurology 2016;15:65-77.
4. Dortch RD, Dethrage LM, Gore JC, Smith SA, Li J. Proximal nerve magnetization transfer MRI relates to disability in Charcot-Marie-Tooth diseases. Neurology 2014;83:1545-1553.
5. Vaeggemose M, Vaeth S, Pham M, et al. Magnetic resonance neurography and diffusion tensor imaging of the peripheral nerves in patients with Charcot‐Marie‐Tooth Type 1A. Muscle & nerve 2017;56:E78-E84.
6. Cornett KM, Wojciechowski E, Sman AD, et al. Magnetic resonance imaging of the anterior compartment of the lower leg is a biomarker for weakness, disability, and impaired gait in childhood Charcot–Marie–Tooth disease. Muscle & nerve 2019;59:213-217.
7. Chhabra A, Carrino JA, Farahani SJ, et al. Whole‐body MR neurography: Prospective feasibility study in polyneuropathy and Charcot‐Marie‐Tooth disease. Journal of Magnetic Resonance Imaging 2016;44:1513-1521.
8. Li J. Charcot-Marie-Tooth neuropathy type 4J. GeneReviews®[Internet]: University of Washington, Seattle, 2013.
9. Anderson T, Krajewski K, Li J. Hereditary Sensory Autonomic Neuropathy Type-1C (HSAN1c) by a Novel Mutation of Asn177Asp in SPTELCS2 Gene (P3. 4-035). AAN Enterprises, 2019.
10. Chen Y, Liu S, Buch S, Hu J, Kang Y, Haacke EM. An interleaved sequence for simultaneous magnetic resonance angiography (MRA), susceptibility weighted imaging (SWI) and quantitative susceptibility mapping (QSM). Magnetic resonance imaging 2018;47:1-6.
11. Zhang T, Chen Y, Bao S, et al. Resolving phase ambiguity in dual‐echo dixon imaging using a projected power method. Magnetic resonance in medicine 2017;77:2066-2076.
12. Chen Y, Liu S, Wang Y, Kang Y, Haacke EM. STrategically Acquired Gradient Echo (STAGE) imaging, part I: Creating enhanced T1 contrast and standardized susceptibility weighted imaging and quantitative susceptibility mapping. Magnetic resonance imaging 2018;46:130-139.
13. Wang Y, Chen Y, Wu D, et al. STrategically Acquired Gradient Echo (STAGE) imaging, part II: Correcting for RF inhomogeneities in estimating T1 and proton density. Magnetic resonance imaging 2018;46:140-150.
14. Haacke EM, Chen Y, Utrainen D, et al. STrategically Acquired Gradient Echo (STAGE) Imaging, part III: Technical Advances and Clinical Applications of A Rapid Multi-Contrast Multi-Parametric Brain Imaging Method. Magnetic resonance imaging 2020;65:15-26;DOI:10.1016/j.mri.2019.09.006.
15. Penny WD, Friston KJ, Ashburner JT, Kiebel SJ, Nichols TE. Statistical parametric mapping: the analysis of functional brain images: Elsevier, 2011.
16. Gold GE, Han E, Stainsby J, Wright G, Brittain J, Beaulieu C. Musculoskeletal MRI at 3.0 T: relaxation times and image contrast. American Journal of Roentgenology 2004;183:343-351.
17. Stanisz GJ, Odrobina EE, Pun J, et al. T1, T2 relaxation and magnetization transfer in tissue at 3T. Magnetic Resonance in Medicine: An Official Journal of the International Society for Magnetic Resonance in Medicine 2005;54:507-512.
Figures