1563
Comparison of brain atrophy in patients with type 2 diabetes from the Diabetes and Dementia (D2) study and stroke patients from the CANVAS study1The Florey Institute of Neuroscience and Mental Health, University of Melbourne, Melbourne, Australia, 2Department of Medicine, University of Melbourne, Austin Health, Heidelberg, Australia, 3Austin Health Endocrine Centre, Heidelberg, Australia, 4Department of Endocrinology & Diabetes, St Vincent's Hospital, Melbourne, Australia, 5Department of Cardiology, Austin Health, Heidelberg, Australia, 6Department of Neurology, Austin Health, Heidelberg, Australia
Synopsis
Type 2 diabetes and stroke are associated with reduced brain volumes and independently present a high risk for cognitive impairment or dementia. The interaction between diabetes and stroke and its effects on brain atrophy are unknown. We used linear mixed-effect modelling to estimate rates of atrophy over two years based on FreeSurfer segmentation of MR images of healthy participants and patients with type 2 diabetes and/or stroke. Cerebral atrophy, defined by volume reductions in specific regions of interest, was accelerated the most in the group with only type 2 diabetes. Thalamus was affected more by stroke.
Introduction
Patients with type 2 diabetes mellitus (T2DM), especially those who are older than 70 years, are likely to develop cognitive impairment or dementia at least twice more than those without T2DM1. Type 2 diabetes is also associated with decreased brain volume2,3. Similarly, stroke survivors have a high risk of developing cognitive impairment or dementia4. Regional and whole brain atrophy precedes such cognitive impairment, especially the reduction of hippocampal volume which is known to be more accelerated in the hemisphere ipsilateral to the stroke infarct5. However, it is unknown whether T2DM and stroke together has an additive effect on the rate of brain atrophy.We present preliminary findings comparing brain atrophy over two years in four groups of participants: non-demented with no history of stroke sampled from the Diabetes and Dementia (D2)6 study and healthy, first-ever ischemic stroke with (T2DM+) and without type 2 diabetes (T2DM-) sampled from the Cognition and Neocortical Volume after Stroke (CANVAS)7.
Methods
D2 and stroke participants were recruited from the acute stroke units and outpatient diabetes clinics of the Austin, Box Hill, and Royal Melbourne hospitals in Victoria, Australia. T1-weighted MPRAGE sequences were obtained at baseline and 2-year follow-up timepoints using a 3T Siemens scanner and were segmented using the longitudinal pipeline8 in FreeSurfer (v6.0). We chose to estimate changes in five measures: cortical thickness (CT), hippocampal, thalamic, and cortical gray matter (CGM) volumes, and brain hemisphere volume (HBV). As we were aware of atrophy differences in stroke with respect to lesion site, we estimated the atrophy rates using ipsilesional and contralesional volumes (e.g. for a lesion in left hemisphere, the left hippocampal volume was considered ispilesional) and excluded volumes of infarcted cortical and subcortical regions. For CANVAS control and D2 participants, we averaged between left and right volumes.Statistical analyses were performed in MATLAB (R2018a). Differences between groups on demographic and clinical variables were examined using Two-sample t-test, Wilcoxon Rank Sum test, and Fisher Exact test. We used a linear mixed-effect model to estimate atrophy rates within groups and to analyse differences between groups. The model included: uncorrelated random intercept and slope, group-time interaction, and age, sex, years-of-education, a composite cerebrovascular risk factor (cVRF) and total intracranial volume (TIV) as covariates. cVRF was coded based on sum of known risk factors: body mass index ≥30kg/m2, hypertension, cholesterol, smoking ≥1 cigarette/day, and alcohol intake ≥14 units/week. A sum ≥2 was coded as a risk in the cVRF array.
Results
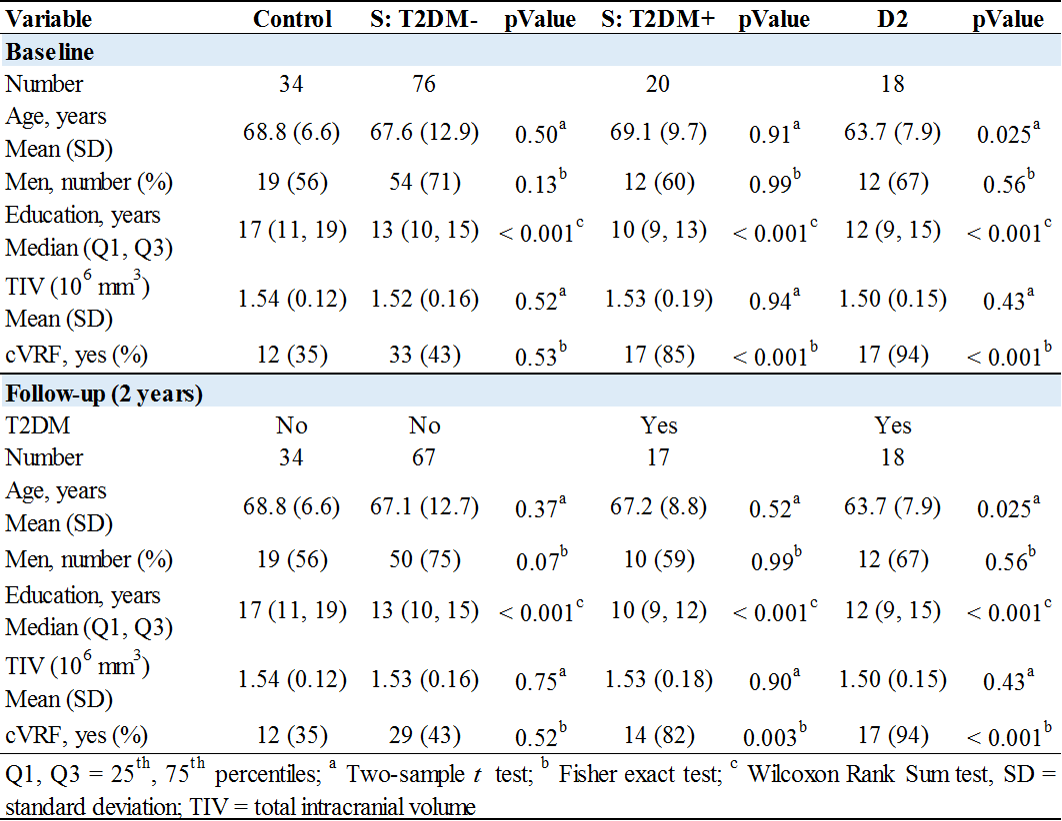
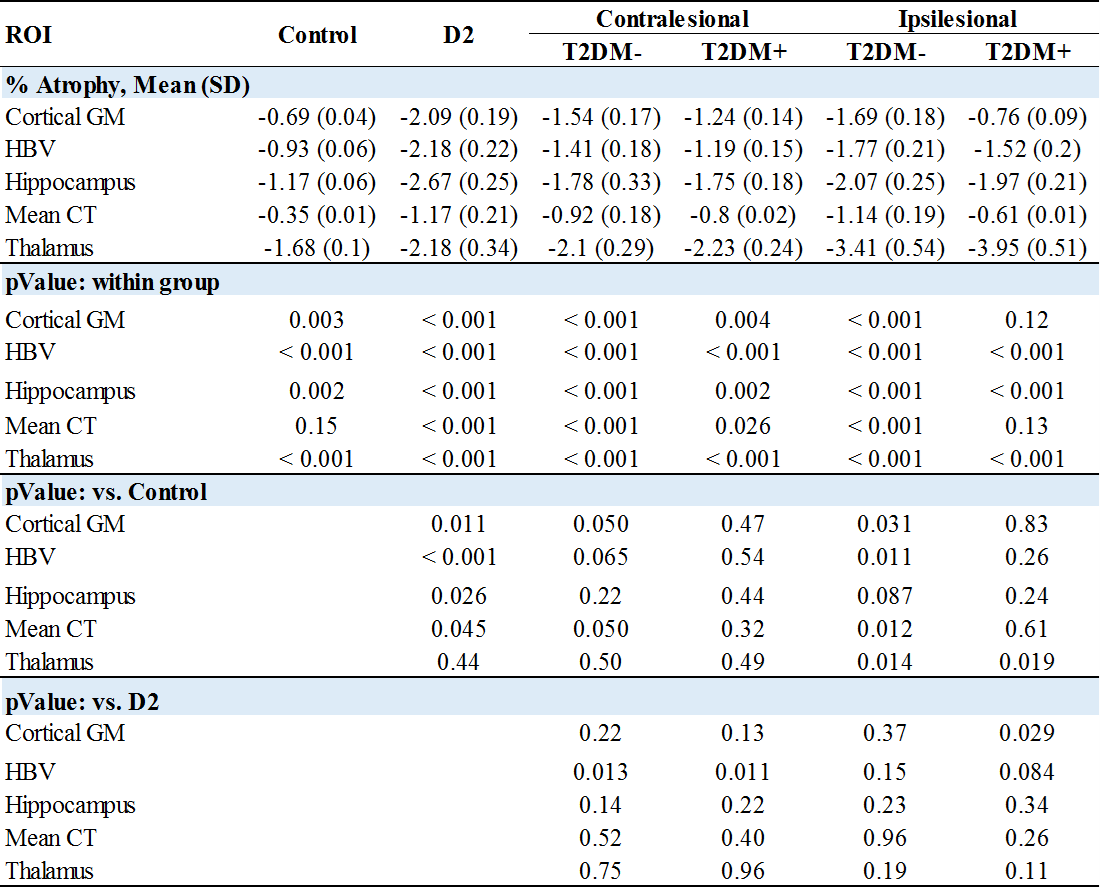
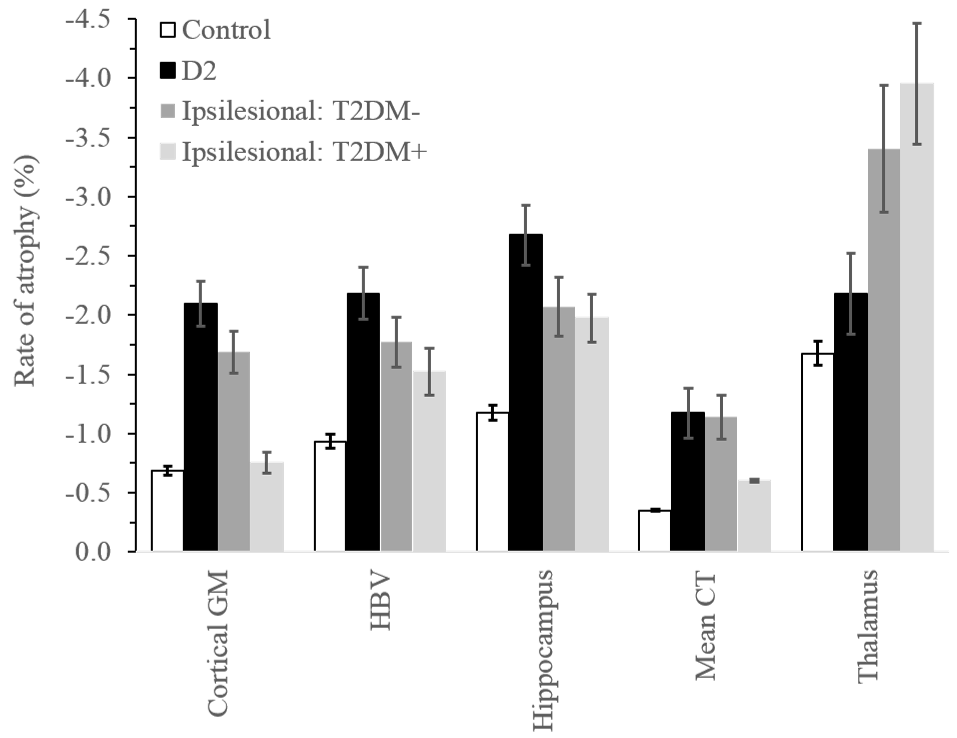
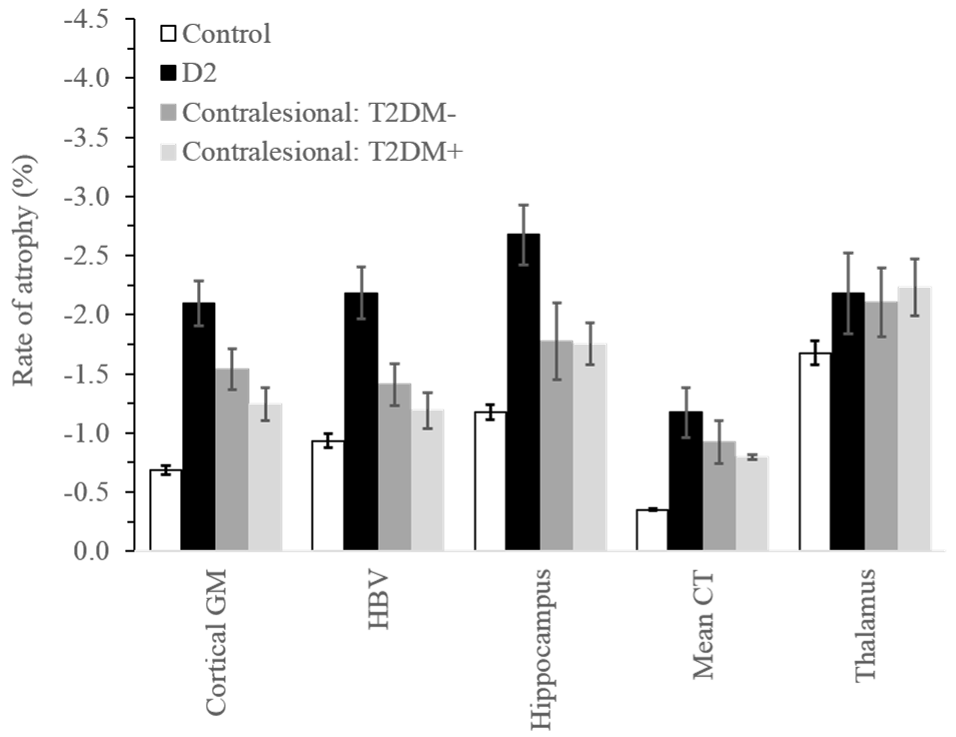
Comparisons of demographic and clinical variables between groups are shown in Fig. 1. There were no significant differences in sex and TIV. The D2 group was significantly younger and both D2 and stroke with T2DM had significantly higher cVRF. All stroke and D2 groups were significantly less educated compared to controls. Age (p<0.001) was significantly associated with all five volumetric measures, as was TIV except for cortical thickness. Sex was only associated with cortical thickness (p<0.001). Years-of-education showed borderline significance with hippocampal and thalamic volumes (p~0.06).Rates of atrophy are presented in Fig. 2. The three patient groups were compared to healthy control. In addition, atrophy rates in the stroke groups were compared to those in D2. For stroke, rates of atrophy were not significantly different between the T2DM- and T2DM+ groups, both ipsi- (Fig. 3) and contralesionally (Fig. 4). Between baseline and 2-year timepoint, all measures in all four groups experienced a significant reduction except for cortical thickness in control and in T2DM+ ipsilesionally.
Compared to control, the rates of atrophy in the D2 group were significantly higher for all regions considered, except for thalamus. They were also higher for HBV compared to both stroke groups contralesionally (p~0.01), and for cortical GM compared to T2DM+ ipsilesionally (p=0.029). The ipsilesional rates of atrophy in the stroke T2DM- group were significantly higher for all measures compared to control, except for hippocampus. Contralesionally, the rates were still higher compared to control, but differences did not reach significance (p=0.05 for CT and CGM). The thalamus ipsilesional rate of atrophy in T2DM+ was significantly higher (p=0.019) compared to control.
Discussion
We investigated rates of brain atrophy over two years in healthy participants and patients with type 2 diabetes mellitus and/or stroke. As anticipated5, rates of atrophy in the ipsilesional hemisphere were generally higher than their counterparts in the contralesional hemisphere regardless of whether the stroke participants had diabetes or not. The presence of type 2 diabetes in stroke seems to have played a role in reducing atrophy of most regions compared to the stroke group without diabetes which showed significant differences from control for all regions, except for thalamus. Finally, left ventricular hypertrophy (LVH) is prevalent in type 2 diabetes and independently predicts cognitive impairment. In this study, we were blinded to the concentration of LVH in D2. The presence of LVH could have been the reason behind elevated atrophy rates in D2 compared to healthy control and stroke with and without type 2 diabetes. Future studies will investigate the influence of LVH on brain atrophy in the aforementioned analysis groups.Conclusion
Type 2 diabetes mellitus significantly contributed to accelerated atrophy in considered regions; except for thalamus neurodegeneration which was affected more by ischemic stroke.Acknowledgements
This work was supported by the National Health and Medical Research Council project grant (APP1020526), the Brain Foundation, Wicking Trust, Collie Trust, and Sidney and Fiona Myer Family Foundation. The Florey Institute of Neuroscience and Mental Health acknowledges the strong support from the High Performance Computing (HPC) system operated by Research Platform Services at the University of Melbourne.References
1. Biessels, G. J., et al. (2006). "Risk of dementia in diabetes mellitus: a systematic review." Lancet Neurol 5(1): 64-74.
2. Wisse LE, de Bresser J, Geerlings MI et al (2014) Global brain atrophy but not hippocampal atrophy is related to type 2 diabetes. J Neurol Sci 344(1-2):32–36.
3. van Elderen SG, de Roos A, de Craen AJ et al (2010) Progression of brain atrophy and cognitive decline in diabetes mellitus: a 3-year follow-up. Neurology 75(11):997–1002.
4. Kalaria, R.N. (2016). Stroke injury, cognitive impairment and vascular dementia. Biochim Biophys Acta, 1862, 915-925.
5. Khlif, M. S., et al. (2019). "Assessment of longitudinal hippocampal atrophy in the first year after ischemic stroke using automatic segmentation techniques." NeuroImage: Clinical: 102008. https://doi.org/10.1016/j.nicl.2019.102008.
6. Patel SK, et al. Does left ventricular hypertrophy affect cognition and brain structural integrity in type 2 diabetes? Study design and rationale of the Diabetes and Dementia (D2) study. BMC Endocrine Disorders 2017; 17:24.
7. Brodtmann, A., et al. (2014). "Charting cognitive and volumetric trajectories after stroke: protocol for the Cognition And Neocortical Volume After Stroke (CANVAS) study. Int J Stroke 9(6): 824-828.
8. Iglesias, J.E. (2015). A
computational atlas of the hippocampal formation using ex vivo, ultra-high
resolution MRI: Application to adaptive segmentation of in vivo MRI. NeuroImage,
115, 117-137.
Figures