1560
Delayed cerebrovascular response within deep white matter may alter the cortical-subcortical connections in small vessel disease patients1Department of Radiology, Taipei Medical University - Shuang Ho Hospital, New Taipei, Taiwan, 2Institute of Biomedical Engineering, National Taiwan University, Taipei, Taiwan, 3Department of Radiology, Stanford University, Palo Alto, CA, United States
Synopsis
We applied cross-correlation method on breath-holding task to estimate the cerebrovascular response (CVR) strength and latency within deep white matter. The CVR latency showed significant negative correlation with working memory (WM) 1-back accuracy (r = -0.546, p = 0.009). Further, the significant negative correlation between the average CVR latency within deep white matter and the functional connectivity in specific regions of WM activation area, including left anterior insular cortex and bilateral putamen was found. The result suggested that the changes of cortical-subcortical connections in cerebral small vessel disease can be reflected by the delayed CVR latency within deep white matter.
Introduction
Cerebral small vessel disease (cSVD) denotes a spectrum of lesions of vascular etiology, which localize to subcortical structures 1, 2, leading to deep gray matter and white matter damage 3, 4. Studies have suggested that the cSVD burden, including microbleed 5, white matter hyperintensity 6-8, lacune 6, 9 and dilated perivascular space 6, are highly associated with impaired cerebrovascular reactivity (CVR). However, the impact of CVR dynamics on functional connectivity has not been studied systematically in cSVD patients. Thus, we aim to evaluate CVR in both response strength and temporal characteristic domain within deep white matter for cSVD patients. We hypothesized that the altered CVR dynamics could reflect the cSVD-associated functional connectivity changes.Methods
This study was approved by the local research ethics committee. All participants provided written informed consent. 22 right-handed cSVD patients (male/female: 17/5; age: 54.4±9.3 years old) fulfilling the definition of "small vessel occlusion" in TOAST criteria were recruited 10. All participants underwent resting state fMRI and task fMRI (breath-holding (BH) task and 1-back verbal working memory (WM) task) sequentially in a 3T MRI scanner (Discovery MR750; GE Healthcare, Milwaukee, Wis). The BH protocol comprised two 30-s periods of self-paced breathing at the beginning and end of the protocol, and six 60-s cycles of alternating periods of 15-s apnea (BH) preceded by a preparatory exhalation, and followed by 30-s of self-paced breathing. In the WM 1-back task, the target stimuli (i.e., 0-9) will be any number identical to the number which preceded it a trial back. It consists of 60 series of five numbers, 20 of which (33%) will contain targets. Participants will be required to respond to every stimulus using a two-buttoned response box. The fMRI scans used T2*-weigthed echo-planar imaging with the following parameters: TR/TE=2000/35msec; flip angle=90°; FOV=230mm2 ; matrix size=64x64; slice thickness=4mm; 40 slices).Voxel-wise CVR latencies were measured using linear cross-correlation between each voxel time series and the reference BH time series. The brain-derived reference BH time series 11 consisted the average time series across voxel showed significant correlated (p<0.05, FWE) with the canonical BH regressor in the whole brain. The CVR latency was defined as the time shift yielding the maximum of the cross-correlation function. The BH time series and regressor was first upsampled to a resolution of 500 msec using Fourier interpolation, and time shift was permitted to range between +/- 9sec. The brain activity during the WM 1-back condition was obtained by general linear model. The WM task activation regions-of-interests (ROIs) (Table 1) were defined by a 5-mm diameter sphere centered at the WM task activation regions (p<0.05, FWE; Figure 1). The inter-regional resting-state functional connectivities were calculated using Pearson’s correlations between the regional averaged time series of all possible pairs of ROIs. The correlation coefficients were transformed to Fisher’s Z score to improve normality 12.
Finally, the WM 1-back activation strength of each ROI as well as the resting-state functional connectivity between ROI pairs were extracted to test whether they were correlated to the average CVR as well as the average CVR latency within white matter ROI. The voxels with >90% white matter probability were extracted as the white matter ROI. To further reduce the likelihood of gray matter partial volume, the mask (Figure 4A) is eroded 3-dimensionally by 6 times 13.
Results
Similar to the previous studies 14, 15, the lower CVR strength and later CVR latency was found in deep white matter (Figure 2). The CVR latency showed significant negative correlation with the latency corrected CVR strength within white matter (r=-0.445, p=0.038; Figure 3A) and the WM 1-back accuracy (r=-0.445, p=0.038; Figure 3B).The WM 1-back activation strength at L AIC, L putamen, and R putamen showed significant positive correlation with the latency corrected CVR (Figure 4C), while showed significant negative correlation with the CVR latency (Figure 4D) within deep white matter. Further, the CVR latency within deep white matter showed significant negative correlations with resting-state functional connectivity (Figure 5) between L AIC (Figure 6A), bilateral putamen (Figure 6B, C), and other cortical WM activation regions.
Discussion & Conclusion
The CVR latency showed significant correlation with WM task performance in cSVD patients. The result supported the association between the delayed CVR dynamics within white matter and the decreased WM capacity of patients.The significant correlation between CVR latency and functional connectivity in specific regions of WM activation area, including L AIC and bilateral putamen was found. The AIC is the key structures of the salience network, which is thought to be particularly involved in initiating control signals to engage brain regions mediating attention, WM, and higher order cognitive processes 16, 17. The putamen receives inputs from cortex while the globus pallidus projects to the dorsomedial nuclei of the thalamus 18. Sefcsik et al. 19 suggested that the frontal-subcortical circuit between the putamen and frontal motor areas plays a role in higher cognitive processing. The result suggested that the changes of cortical-subcortical connections in cSVD patients can be reflected by the delayed CVR dynamics within white matter. Taken together, the altered CVR dynamics within white matter might be an important indicator to reflect the cSVD-associated functional connectivity changes and WM capacity declined.
Acknowledgements
This work is partially supported by Ministry of Science and Technology, Taiwan (MOST 107-2634-F-038-001, MOST 106-5420-011-300)References
1. Lammie GA, Brannan F, Slattery J, et al. Nonhypertensive cerebral small-vessel disease: an autopsy study. 1997; 28: 2222-2229.
2. Stevens RD, Hannawi Y, Sair HJJoCBF, et al. Small vessel disease and the resting functional architecture of the brain. 2014; 34: 1089-1090.
3. Pantoni LJTLN. Cerebral small vessel disease: from pathogenesis and clinical characteristics to therapeutic challenges. 2010; 9: 689-701.
4. Schmidtke K and Hüll MJJotns. Cerebral small vessel disease: how does it progress? 2005; 229: 13-20.
5. Conijn MM, Hoogduin JM, van der Graaf Y, et al. Microbleeds, lacunar infarcts, white matter lesions and cerebrovascular reactivity—a 7 T study. 2012; 59: 950-956.
6. Hund-Georgiadis M, Zysset S, Naganawa S, et al. Determination of cerebrovascular reactivity by means of FMRI signal changes in cerebral microangiopathy: a correlation with morphological abnormalities. 2003; 16: 158-165.
7. Sam K, Crawley AP, Conklin J, et al. Development of white matter hyperintensity is preceded by reduced cerebrovascular reactivity. 2016; 80: 277-285.
8. Yezhuvath US, Uh J, Cheng Y, et al. Forebrain-dominant deficit in cerebrovascular reactivity in Alzheimer's disease. 2012; 33: 75-82.
9. Molina C, Sabín JA, Montaner J, et al. Impaired cerebrovascular reactivity as a risk marker for first-ever lacunar infarction: a case-control study. 1999; 30: 2296-2301.
10. Adams Jr HP, Bendixen BH, Kappelle LJ, et al. Classification of subtype of acute ischemic stroke. Definitions for use in a multicenter clinical trial. TOAST. Trial of Org 10172 in Acute Stroke Treatment. 1993; 24: 35-41.
11. Chang C, Thomason ME and Glover GHJN. Mapping and correction of vascular hemodynamic latency in the BOLD signal. 2008; 43: 90-102.
12. Lowe M, Mock B and Sorenson JJN. Functional connectivity in single and multislice echoplanar imaging using resting-state fluctuations. 1998; 7: 119-132.
13. Thomas BP, Liu P, Park DC, et al. Cerebrovascular reactivity in the brain white matter: magnitude, temporal characteristics, and age effects. 2014; 34: 242-247.
14. Champagne AA, Bhogal AA, Coverdale NS, et al. A novel perspective to calibrate temporal delays in cerebrovascular reactivity using hypercapnic and hyperoxic respiratory challenges. 2017.
15. Sam K, Conklin J, Holmes KR, et al. Impaired dynamic cerebrovascular response to hypercapnia predicts development of white matter hyperintensities. 2016; 11: 796-801.
16. Menon VJTics. Large-scale brain networks and psychopathology: a unifying triple network model. 2011; 15: 483-506.
17. Seeley WW, Menon V, Schatzberg AF, et al. Dissociable intrinsic connectivity networks for salience processing and executive control. 2007; 27: 2349-2356.
18. Herrero M-T, Barcia C and Navarro JJCsNS. Functional anatomy of thalamus and basal ganglia. 2002; 18: 386-404.
19. Sefcsik T, Nemeth D, Janacsek K, et al. The role of the putamen in cognitive functions—a case study. 2009; 1: 215-227.
Figures
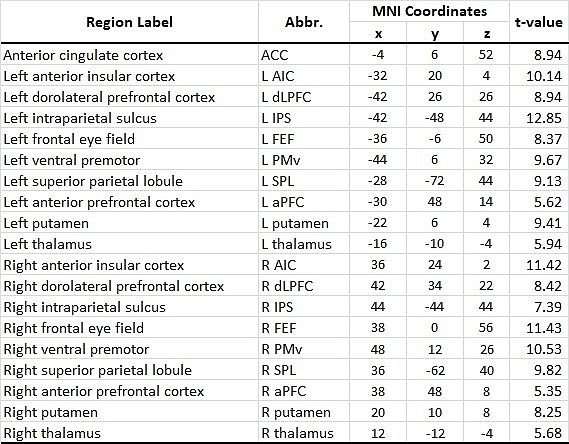
Table 1 List of working memory task activation region-of interests (ROIs)

Figure 1 Working memory (WM) 1-back task: activation map
Masked by the significant threshold: p<0.05 (FWE).
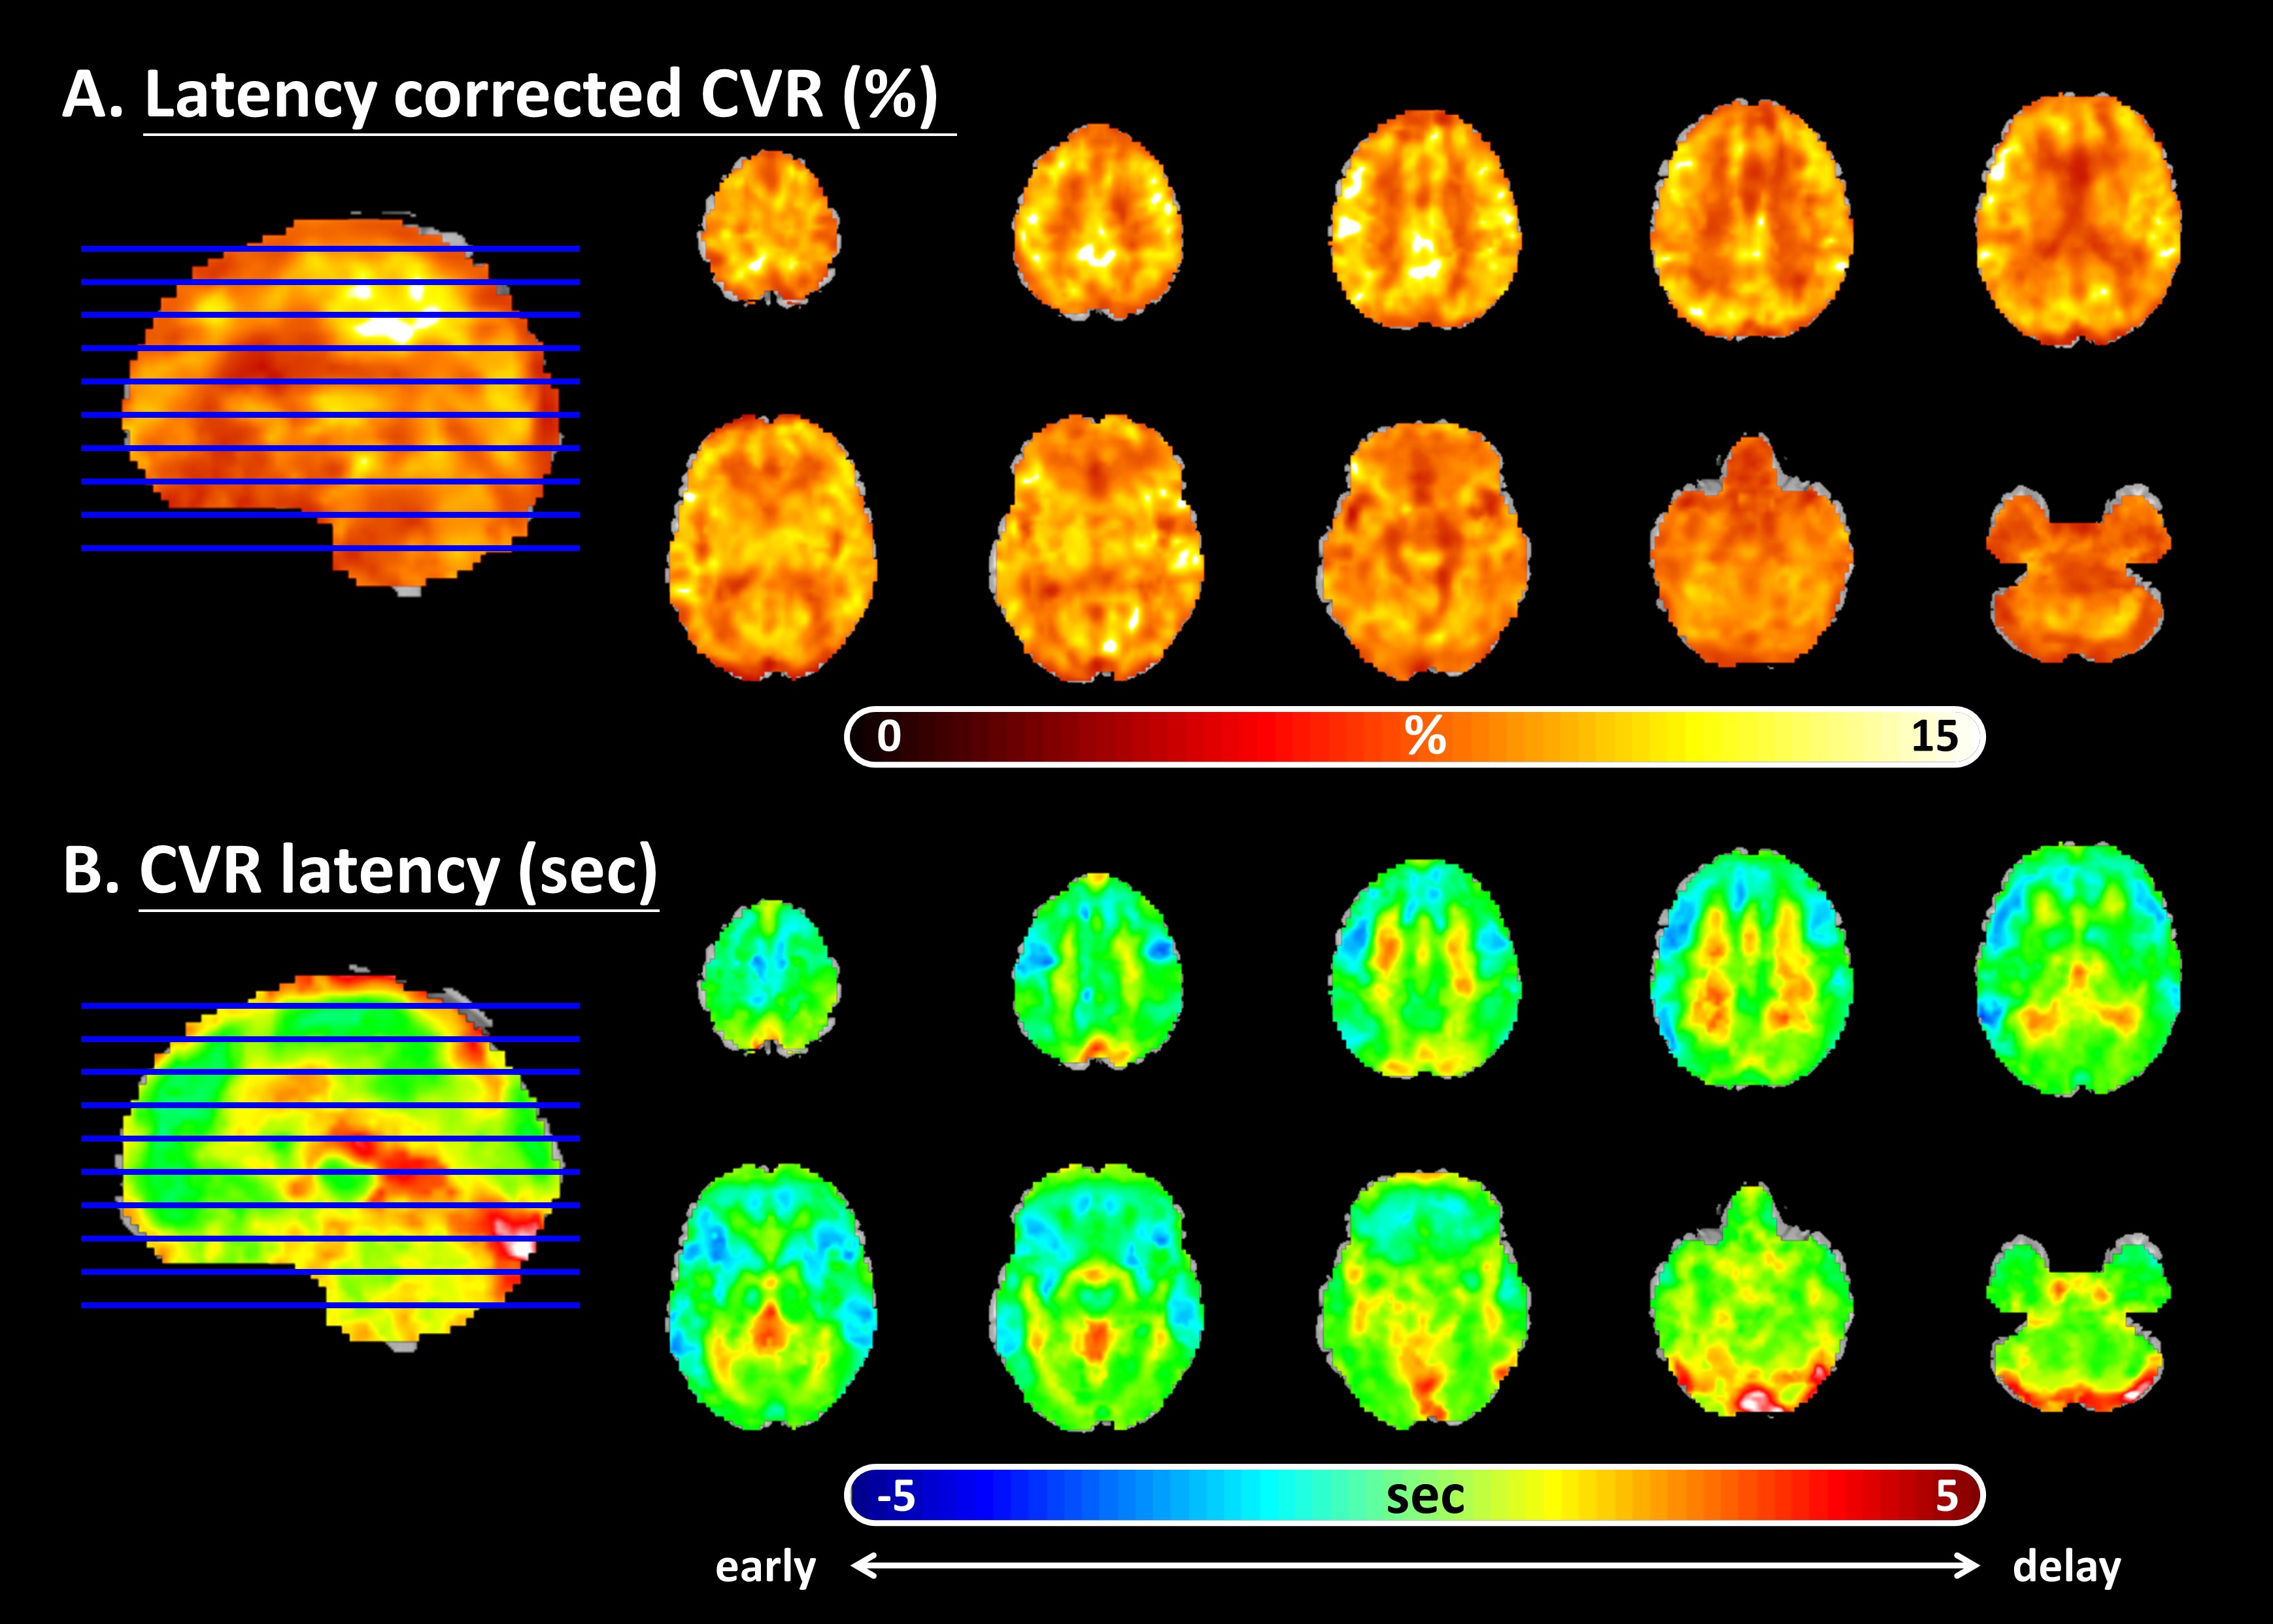
Figure 2 Breath-holding (BH) task: cerebrovascular reactivity (CVR) activation and latency map
(A). Percentage BOLD signal changed map (after cross-correlation latency shift)
(B). Latency map (Note that: The cold color indicated the latencies earlier than whole brain averaged latency, while the warm color showed the slower part.)
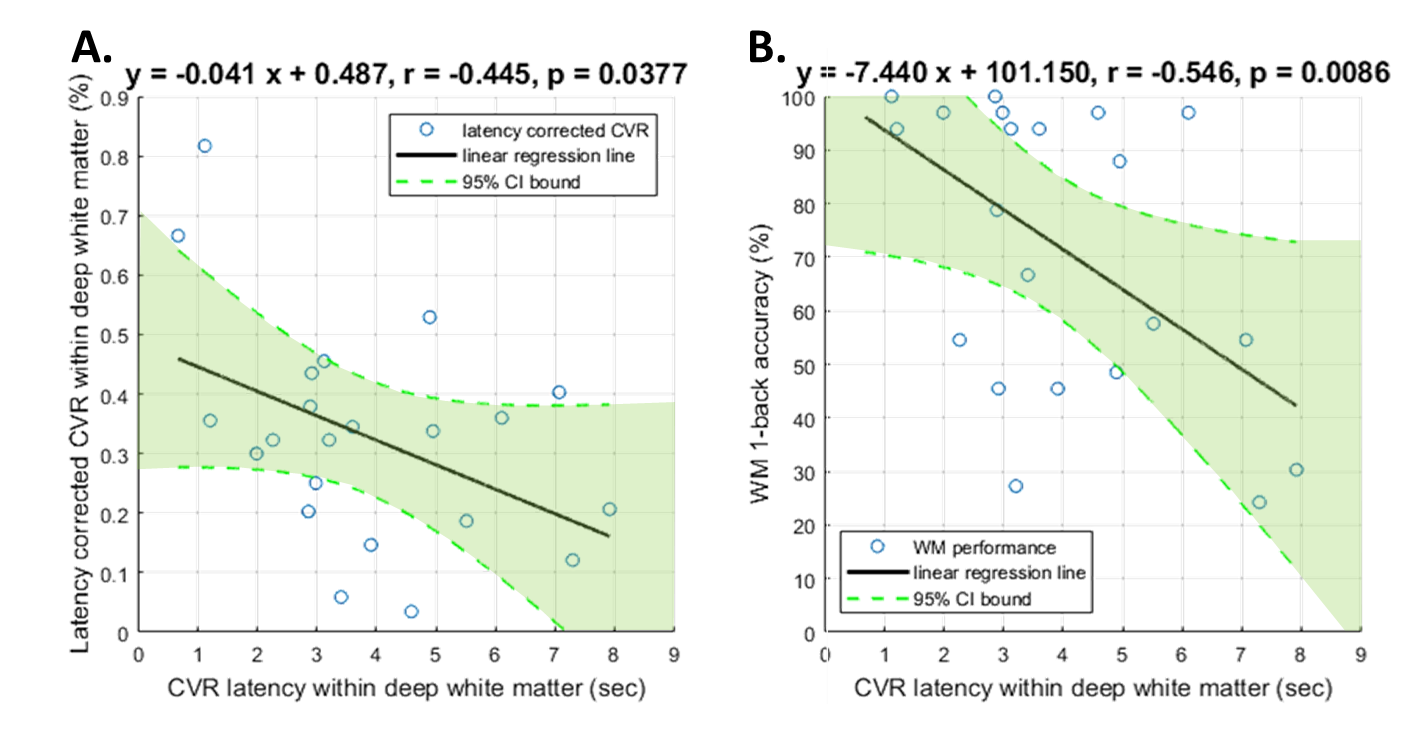
Figure 3 The linear regression relation of the average cerebrovascular reactivity (CVR) latency and the average latency corrected CVR within white matter as well as the working memory (WM) 1-back accuracy.
(A). Significant negative correlation between the average CVR latency and the average latency corrected CVR within white matter (r=-0.445, p=0.0377).
(B). Significant negative correlation between the average CVR latency within white matter and the WM 1-back accuracy (r=-0.546, p=0.0086).
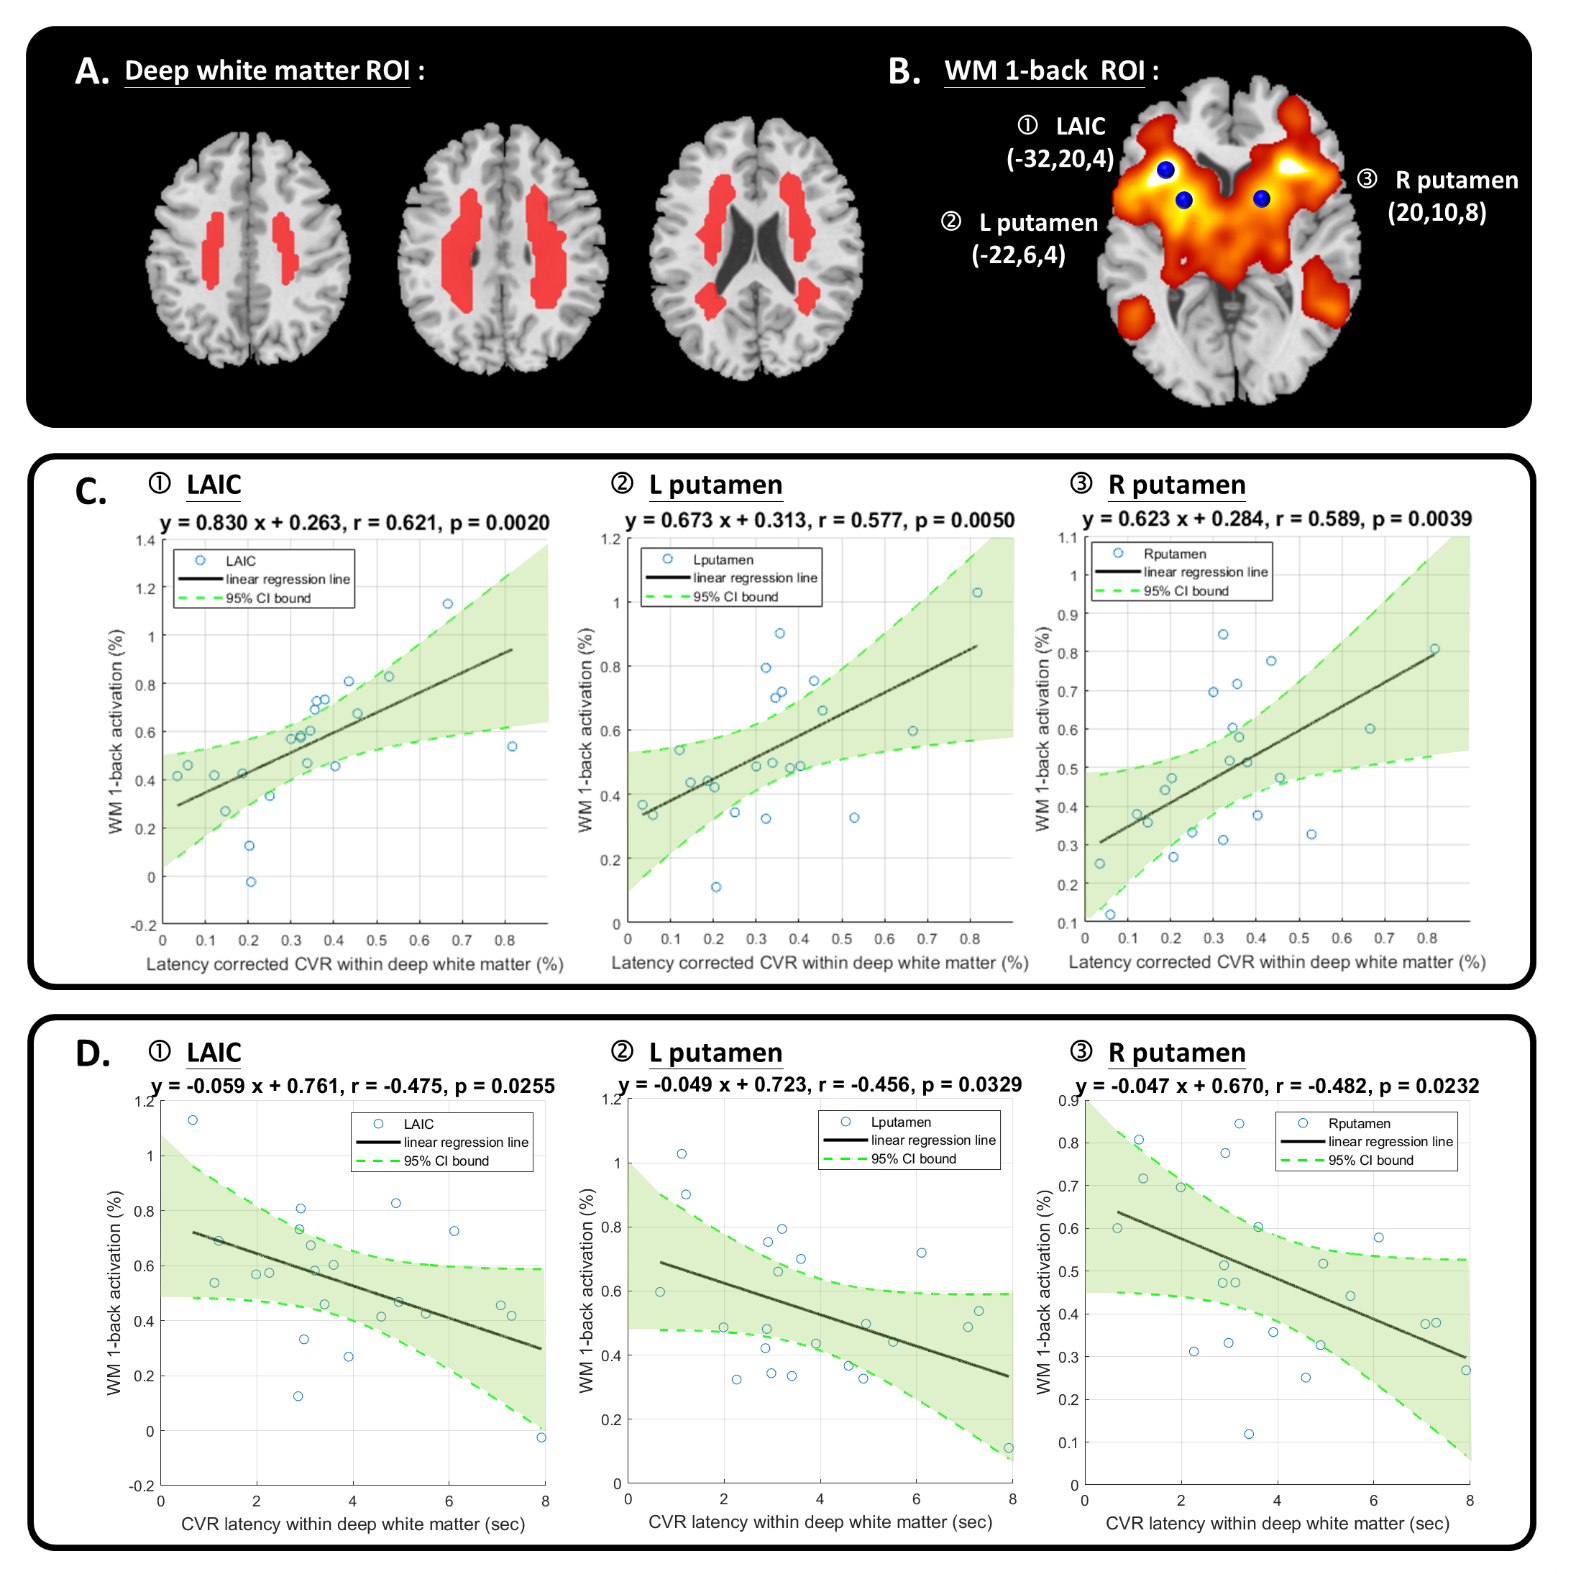
Figure 4 The linear regression relation of working memory (WM) 1-back activation and the average cerebrovascular reactivity (CVR) as well as CVR latency within white matter.
(A). The white matter ROI.
(B). The WM 1-back activation ROIs.
(C). Significant positive correlation between WM 1-back activation of each ROI (1. L AIC, 2. L putamen, and 3. R putamen) and average latency corrected CVR within white matter.
(D). Significant negative correlation between of WM 1-back activation of each ROI (1. L AIC, 2. L putamen, and 3. R putamen) and average CVR latency within white matter.
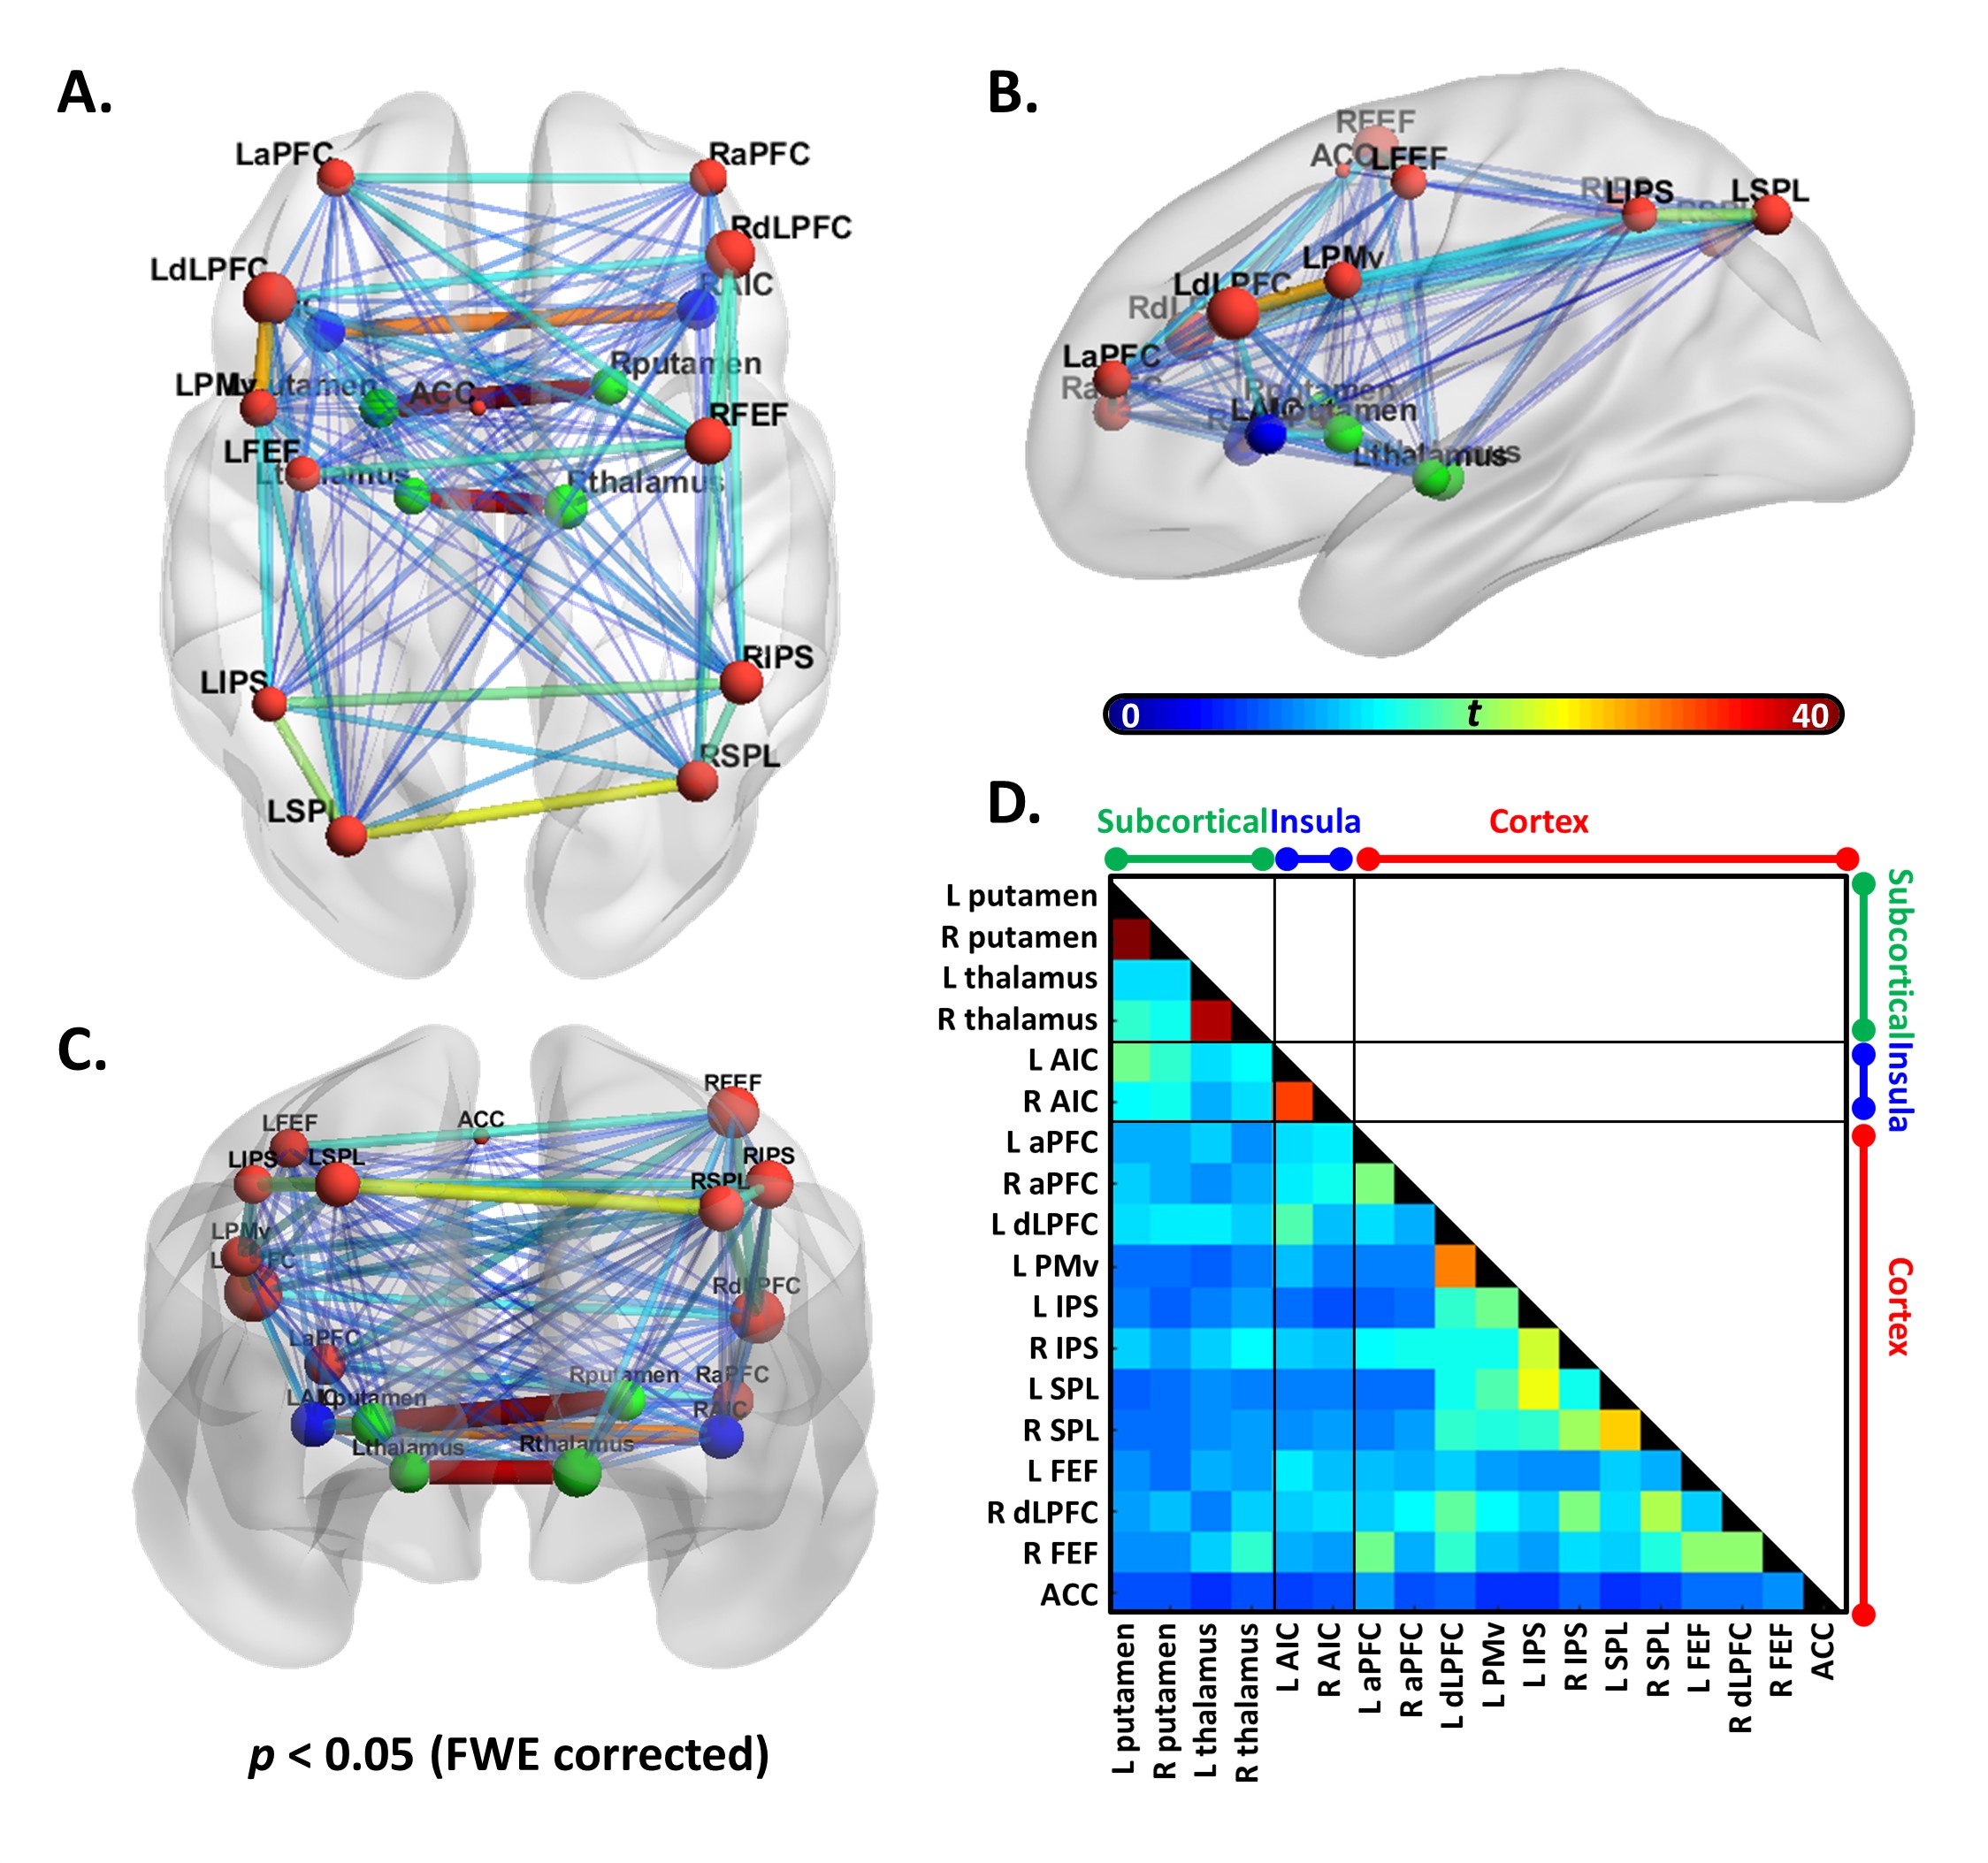
Figure 5 The resting-state functional connectivity between the working memory (WM) activation regions.
The (A). axial (B). sagittal (C). coronal view of the connected subnetwork in 0.01-0.08 Hz frequency band that showed significant connectivity.
Size of the node corresponds to average connectivity of each local node, and the color of the node represents different location (red: cortex; blue: insula; green: subcortical).
The thickness and color of edge represents the connectivity strength.
(D). Association matrix of resting-state connectivity between each node pair.

Figure 6 The linear regression relation of resting-state functional connectivity and the average cerebrovascular reactivity (CVR) latency within white matter.
(A). Significant negative correlation of connectivity between L AIC and other ROIs and average CVR latency.
(B). Significant negative correlation of connectivity between R putamen and other ROIs and average CVR latency.
(C). Significant negative correlation of connectivity between L putamen and other ROIs and average CVR latency.
Note that the thickness of the edges represents the connectivity between each ROI pair.