1559
Higher levels of myelination were observed in chronic fatigue syndrome patients relative to healthy controls1Menzies Health Institute Queensland, Griffith University, Gold Coast, Australia, 2Centre for Advanced Imaging, The University of Queensland, Brisbane, Australia, 3Gold Coast University Hospital, Gold coast, Australia
Synopsis
Myalgic Encephalomyelitis (ME)/Chronic fatigue syndrome (CFS) patients suffer from a variety of physical and neurological complaints indicating the central nervous system plays a role in CFS pathophysiology. Studies based on genetic, immune system, psychiatric, and brain volume abnormalities and white matter hyperintensities have been investigated to identify the pathomechanism of this disease. However, assessment of myelination in brain regions between ME/CFS patients and healthy controls has not been investigated. In this study, we showed elevated myelination in white matter regions and grey matter regions in ME/CFS patients relative to normal controls.
INTRODUCTION
Myalgic Encephalomyelitis (ME) also known as Chronic fatigue syndrome (CFS) is a complex illness characterised by profound fatigue for more than 6 months that impairs cognitive and motor dysfunction, and unrefreshing sleep.1 Patients who suffer from ME/CFS report a variety of physical complaints as well as neurological symptoms.Different study based on infectious agents, genetic susceptibilities, immune system abnormalities and psychiatric disorders2 have been conducted but no precise underlying causes of ME/CFS have been identified. MRI studies have also been conducted based on the white matter hyperintensities (WMH) and volume-based analysis (increase in ventricular volume, decrease in brain and white matter volume) 3,4 to find the definite marker for underlying causes of ME/CFS. However, these findings are inconsistent across studies.5
Furthermore, no study have reported changes in myelination in brain regions between ME/CFS patients and healthy controls. Therefore, in this study we implemented T1- and T2-weighted imaging technique6 to investigate the change of myelination between ME/CFS patients and normal subjects.
METHODS
The study was approved by the local human ethics committee and written informed consent was obtained from 45 individuals (age 47.4 ± 12.0), meeting the Fukuda criteria1 for ME/CFS, and 27 gender-matched healthy controls (43.1 ± 14.1 yrs. old).The T1 and T2 weighted data were acquired using a 3T Skyra MRI scanner (Siemens Healthcare, Erlangen, Germany) with a 64-channel head coil (Nova Medical, Wilmington, USA). Three dimensional T1-weighted images were acquired using a T1-weighted magnetization prepared rapid gradient-echo (MPRAGE) sequence with repetition time (TR) = 2400 ms, echo time (TE) = 1.81 ms, flip-angle = 8°, acquisition matrix = 224 $$$\times$$$ 224$$$\times$$$208, voxel size 1 mm $$$\times$$$1mm$$$\times$$$1 mm. Three dimensional T2-weighted images were acquired using Siemens T2 ‘SPACE’ with TR=3200 ms, TE=563 ms, with variable flip angle, matrix size= 256 $$$\times$$$ 256$$$\times$$$208, voxel size 0.88 mm $$$\times$$$0.8mm$$$\times$$$0.9 mm. Forty (Thirty-seven white matter and three grey matter regions) regions of interest (ROIs) were created utilizing ICBM-DTI-81 white-matter labels atlas7 and Harvard-Oxford template8 using FSL.9 The data were analysed using MRTool6 incorporated in SPM12 (https://www.fil.ion.ucl.ac.uk/spm/) to map the whole brain myelin using the ratio of T1 and T2 weighted images.6 The two-independent t-test analysis was performed to test statistically significant difference in ratio of T1-w/T2-w intensity between ME/CFS patients and healthy control.
RESULTS
We analysed forty (thirty-seven white matter and three grey matter) ROIs. Out of forty ROIs, only twenty-one ROIs showed significant difference in myelination between ME/CFS patients and healthy control as shown in Fig 1 and 2.Figs. 1 and 2 show eighteen white matter and three grey matter regions with significantly elevated myelin in ME/CFS patients relative to healthy controls. We also observed that left medial lemniscus (ML-L), and right and left inferior cerebellar peduncle (ICP-R and ICP-L) have lower myelination (both in ME/CFS patients and healthy controls) in comparison to other white matter regions (see Fig.1). We found that left/right thalamus (T-L and T-R) and sensory motor cortex (SM) have less myelination in comparison to other white matter regions (see Fig.2).
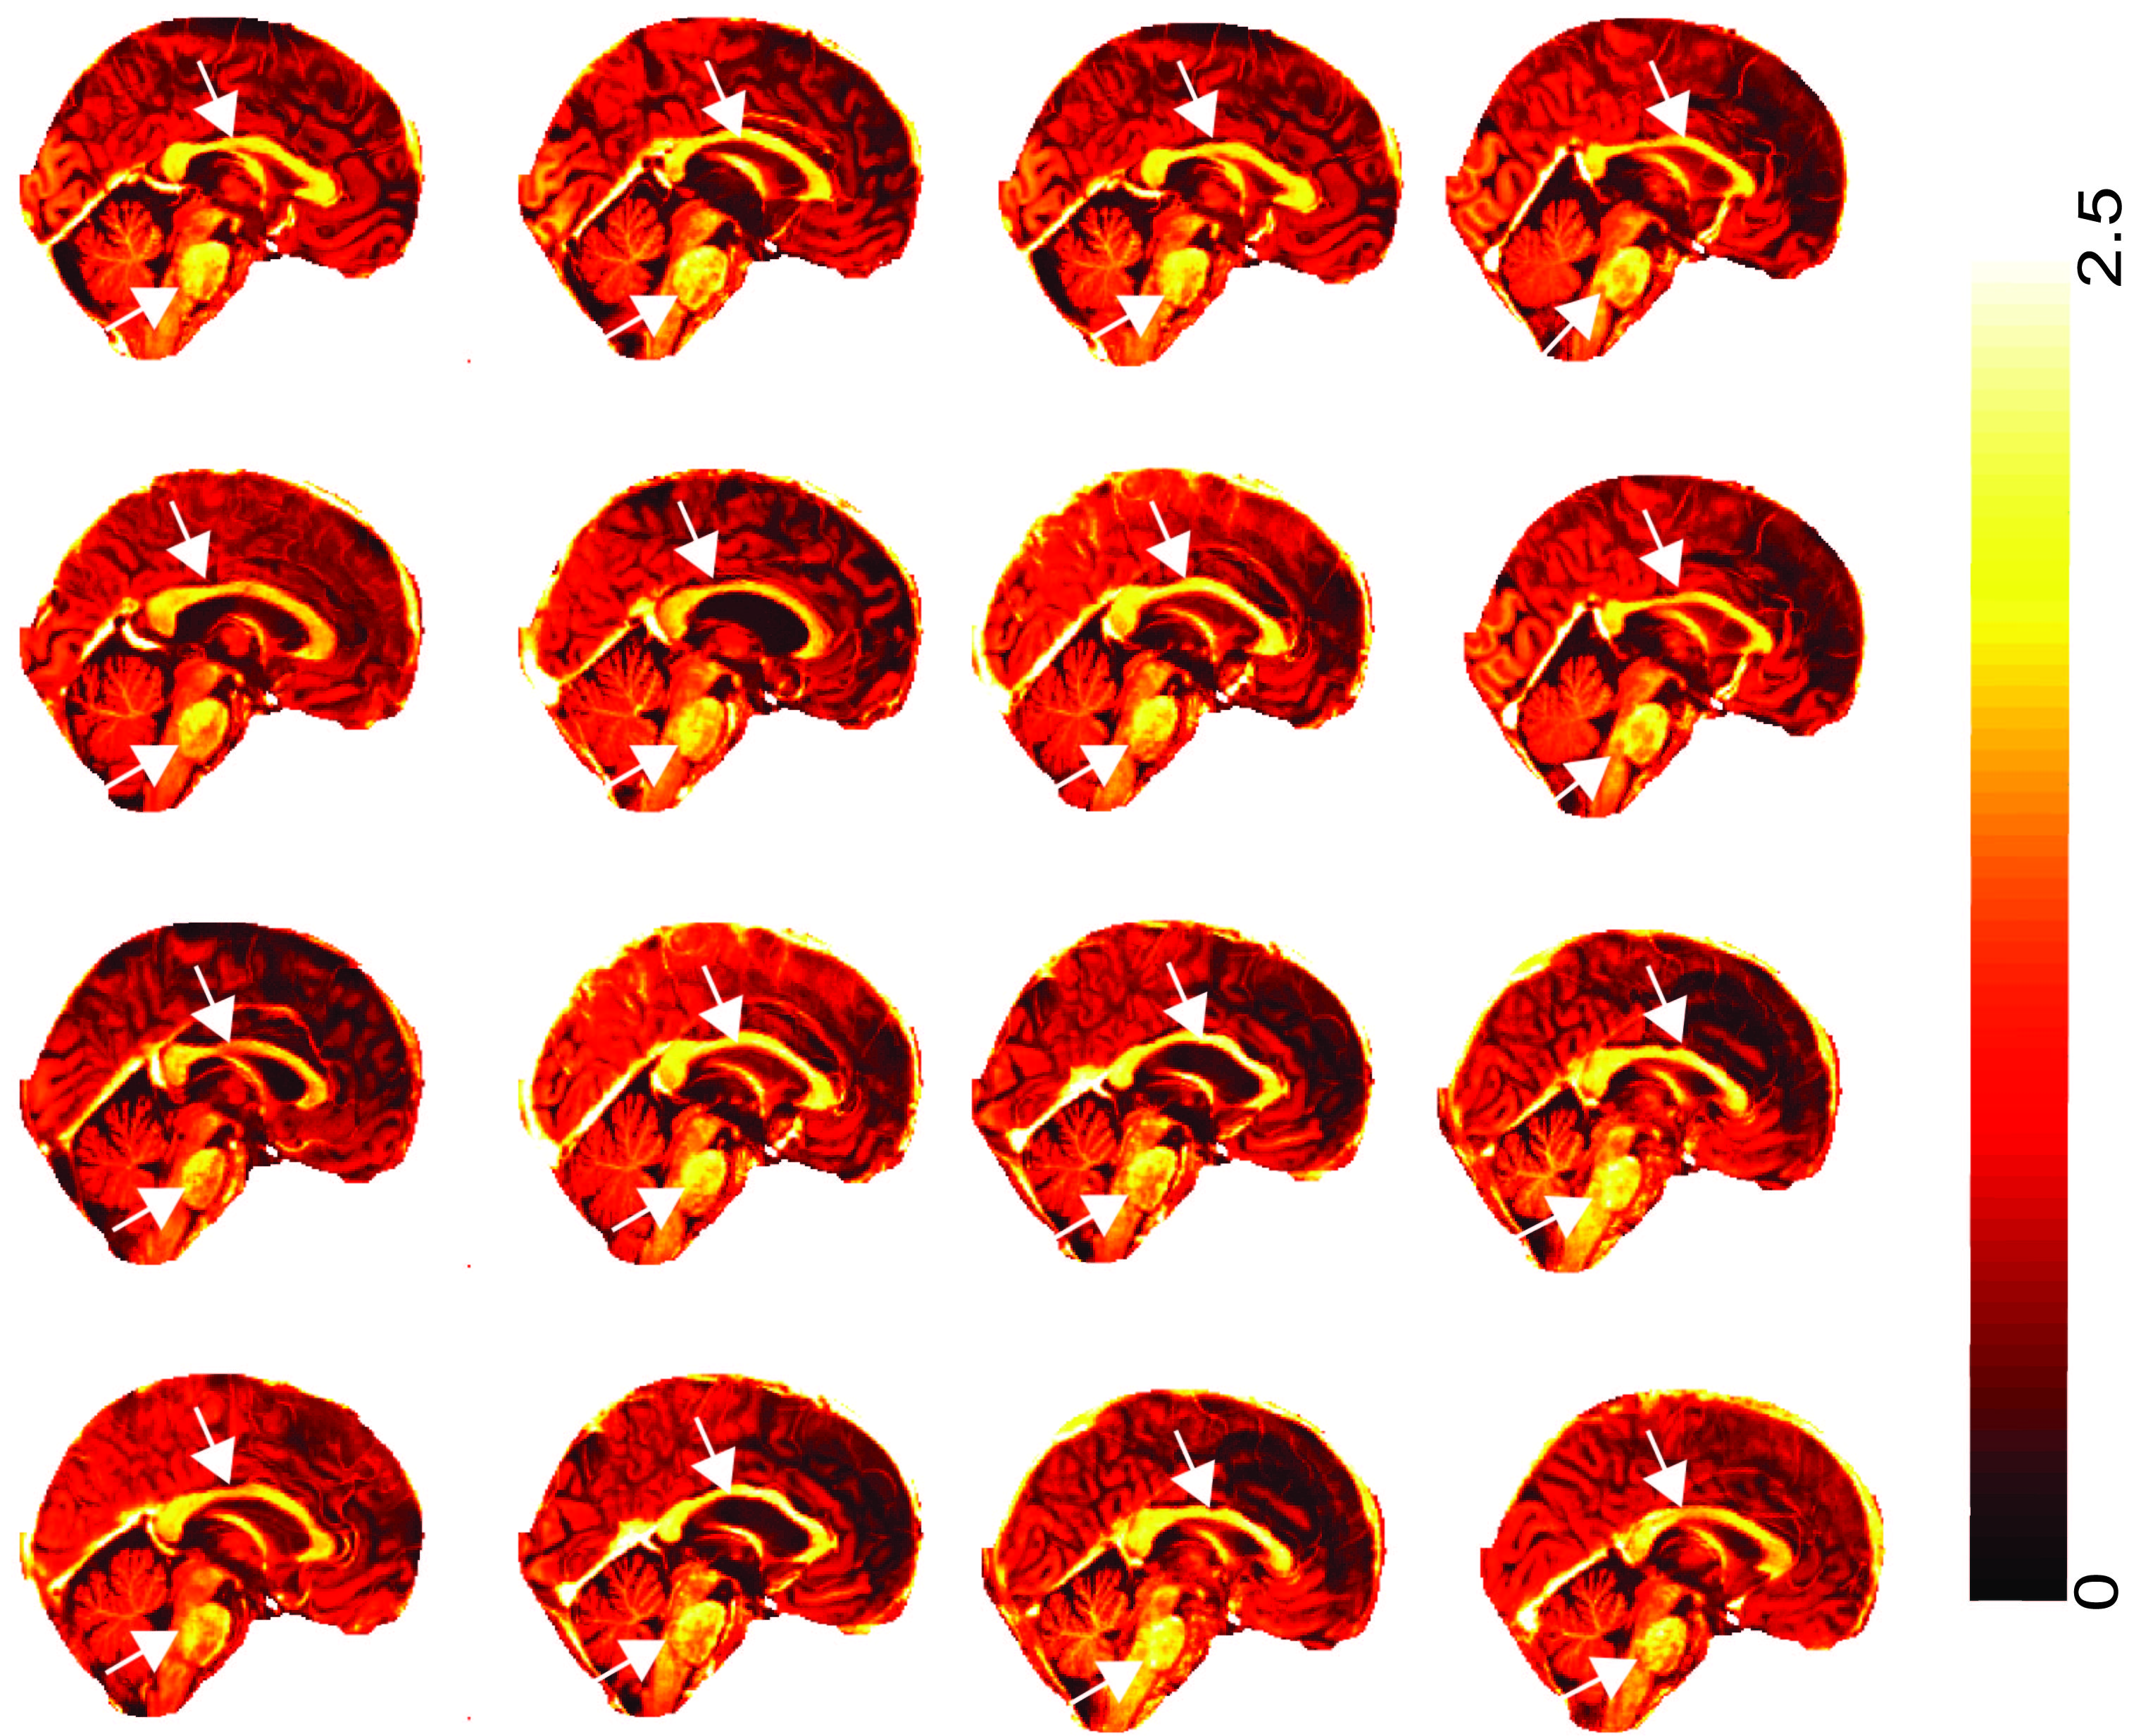
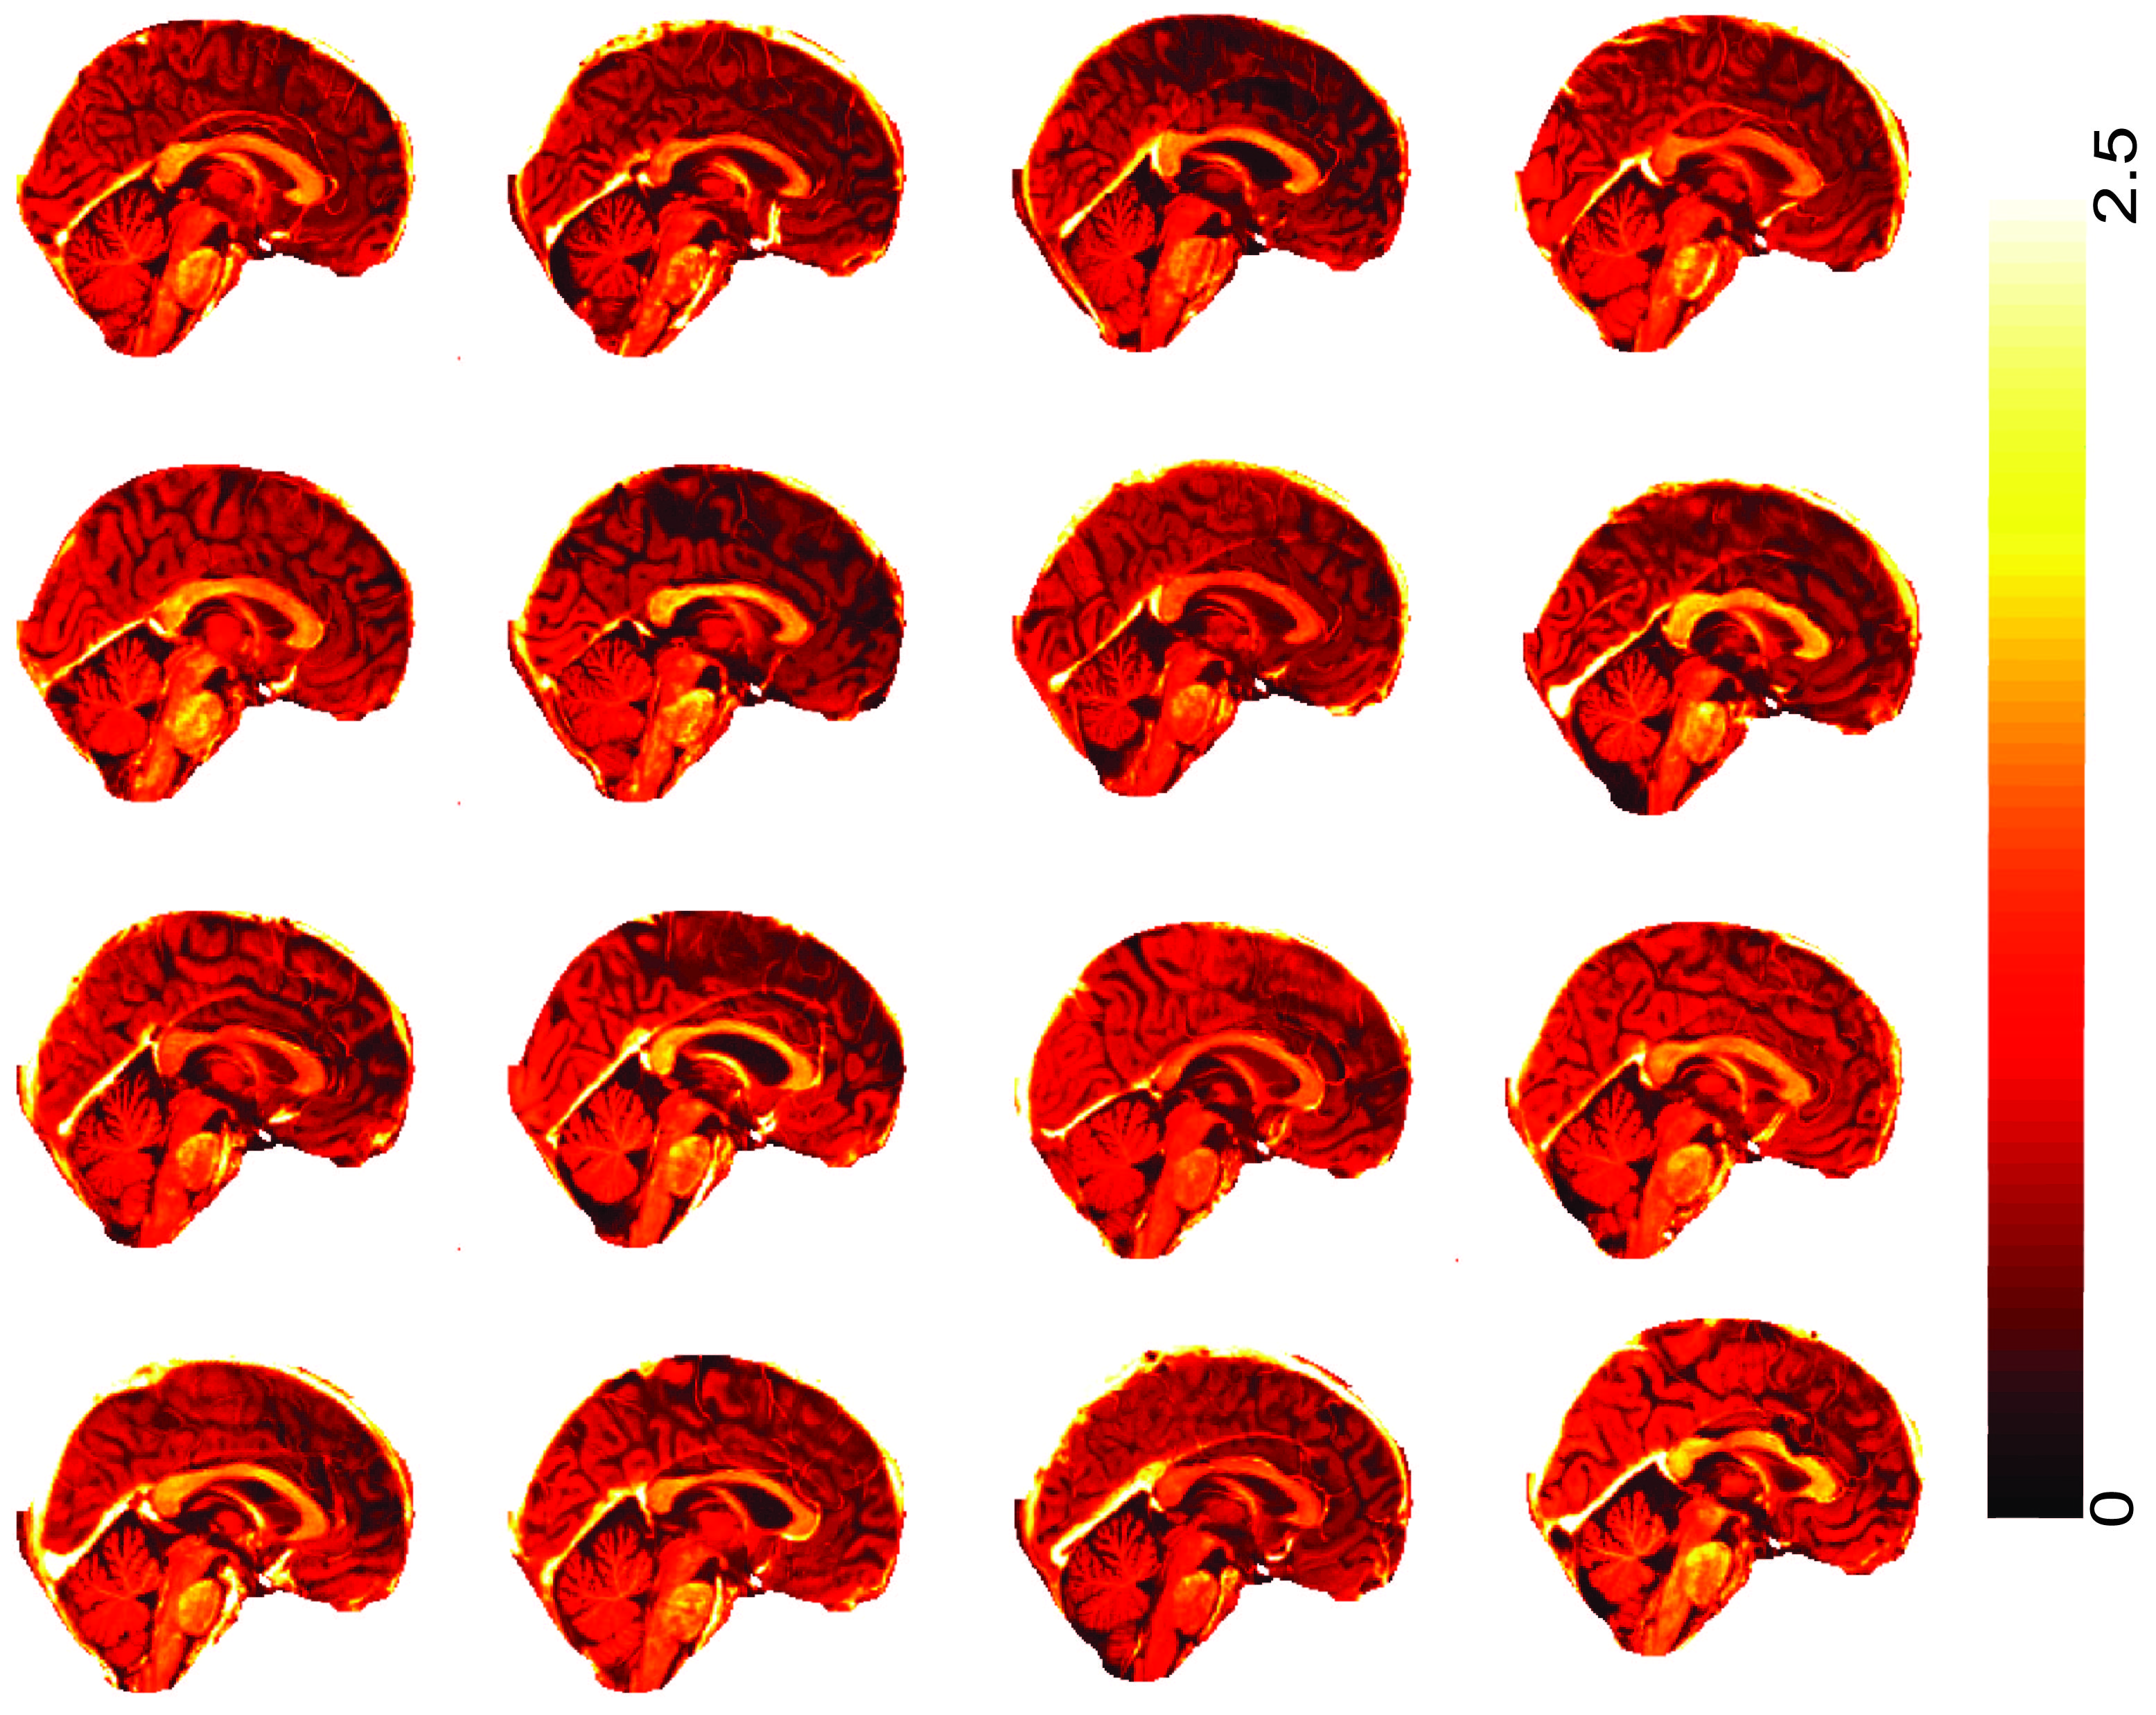
Fig 3 and 4 shows the T1-w/T2-w image of sixteen ME/CFS patients (out of forty-five) and healthy controls (out of twenty-seven) in sagittal section. We found that ME/CFS patients showed higher myelination in brain stem regions and the corpus callosum (white arrows in Fig 3) in-comparison to healthy controls (see Fig 4).
DISCUSSION
Our findings of a higher level of myelination in ME/CFS patients is similar to the previous study. A diffusion study has reported higher fractional anisotropy (FA) values in white matter regions in ME/CFS patients which is related to degree of myelination.10 Another study also found higher T1 relaxation values in white matter regions that could be due to myelination.11 However, the increase of myelination in ME/CFS patients as a potential role in the pathomechamsim and the development of a biomarker remains unknown. Future investigations conducting a multi-modal image modalities experiment would provide further assessment and information of possible increment of myelination in ME/CFS patients.CONCLUSION
Our regions-based finding showed elevated myelination in white matter regions and grey matter regions in ME/CFS patients relative to normal controls. This finding was also consistent with the whole brain myelin maps. Thereby, change of myelination could play a potential role in the pathomechamsim and biomarker development for ME/CFS patients.Acknowledgements
We thank the patients and healthy controls who donated their time and effort to participate in this study. This study was supported by the Stafford Fox Medical Research Foundation, the Judith Jane Mason Foundation (MAS2015F024), Mr Douglas Stutt, and the Blake-Beckett Foundation. The financial support did not affect any aspect of the study.References
[1] K. Fukuda, “The Chronic Fatigue Syndrome: A Comprehensive Approach to Its Definition and Study,” Ann. Intern. Med., vol. 121, no. 12, p. 953, Dec. 1994.
[2] H. Cabanas, K. Muraki, N. Eaton, C. Balinas, D. Staines, and S. Marshall-Gradisnik, “Loss of Transient Receptor Potential Melastatin 3 ion channel function in natural killer cells from Chronic Fatigue Syndrome/Myalgic Encephalomyelitis patients,” Mol. Med., vol. 24, no. 1, p. 44, Aug. 2018.
[3] G. Lange, J. DeLuca, J. A. Maldjian, H.-J. Lee, L. A. Tiersky, and B. H. Natelson, “Brain MRI abnormalities exist in a subset of patients with chronic fatigue syndrome,” J. Neurol. Sci., vol. 171, no. 1, pp. 3–7, Dec. 1999.
[4] G. Lange et al., “Quantitative assessment of cerebral ventricular volumes in chronic fatigue syndrome,” Appl. Neuropsychol., vol. 8, no. 1, pp. 23–30, 2001.
[5] H. Cope and A. S. David, “Neuroimaging in chronic fatigue syndrome,” J. Neurol. Neurosurg. Psychiatry, vol. 60, no. 5, pp. 471–473, May 1996.
[6] M. Ganzetti, N. Wenderoth, and D. Mantini, “Whole brain myelin mapping using T1- and T2-weighted MR imaging data,” Front. Hum. Neurosci., vol. 8, Sep. 2014.
[7] S. Mori, S. Wakana, P. C. Van Zijl, and L. M. Nagae-Poetscher, MRI atlas of human white matter. Elsevier, 2005.
[8] J. A. Frazier et al., “Structural Brain Magnetic Resonance Imaging of Limbic and Thalamic Volumes in Pediatric Bipolar Disorder,” Am. J. Psychiatry, vol. 162, no. 7, pp. 1256–1265, Jul. 2005. [9] S. M. Smith et al., “Advances in functional and structural MR image analysis and implementation as FSL,” NeuroImage, vol. 23, pp. S208–S219, Jan. 2004.
[10] M. M. Zeineh et al., “Right arcuate fasciculus abnormality in chronic fatigue syndrome,” Radiology, vol. 274, no. 2, pp. 517–526, Feb. 2015.
[11] L. R. Barnden et al., “Hyperintense sensorimotor T1 spin echo MRI is associated with brainstem abnormality in chronic fatigue syndrome,” NeuroImage Clin., vol. 20, pp. 102–109, 2018.
Figures