1556
Physiological correlates of brain pulsatility in cerebrovascular small vessel disease using data-driven high temporal resolution fMRI1Wellcome Centre for Integrative Neuroimaging, University of Oxford, Oxford, United Kingdom, 2Institute of Biomedical Engineering, University of Oxford, Oxford, United Kingdom, 3Centre for the Prevention of Stroke and Dementia, University of Oxford, Oxford, United Kingdom
Synopsis
Small vessel disease (SVD) is associated with stroke and dementia, however pathophysiological mechanisms are poorly understood, and effective treatments are lacking. Here, we determine the association between systemic arterial pulsatility and tissue-level cerebral pulsatility in patients with SVD, and its modulation by anti-hypertensive medication, using a novel analysis technique. We observe a significant association between systemic pulsatility and regional cerebral pulsatility, at baseline and on antihypertensive medication. The association was strongest in periventricular white matter most commonly affected by SVD. This regional dependence suggests that pulsatility is a pathophysiological factor underlying tissue damage in SVD, providing a potential treatment target.
Introduction:
Cerebral small vessel disease (SVD) is a major cause of both stroke and dementia. However, despite a high prevalence and significant disease burden, its underlying pathophysiology is not well understood, and specific treatments are lacking. Arterial stiffening is posited as a key pathophysiological factor1 which results in ineffective damping of the arterial blood waveform, elevated cerebral pulsatility, and ultimately white matter (WM) damage.Here, we assess the association between systemic arterial pulsatility with regional tissue-level measures of cerebral pulsatility in patients with a previous lacunar stroke, and its modulation by anti-hypertensive medication. Using a recently developed data-driven resting-state (rs) fMRI measure of regional cerebral pulsatility2,3,4, we hypothesised that systemic and cerebral measures of pulsatility would be most strongly associated in regions most commonly affected by WM hyperintensities.
Methods:
Nine patients (64.4±14.1 years, 7M/2F) were scanned at one centre of a multicentre, randomised controlled trial (TREAT-SVDs) comparing the effect of antihypertensive medication on small vessel function in SVD. Inclusion criteria were adults with lacunar stroke currently using no more than two antihypertensive drugs.Following withdrawal of usual antihypertensives, each patient received three antihypertensive drugs (amlodipine, losartan and atenolol) for four weeks each, in a randomised order. Imaging was performed at baseline (no drug), and every four weeks to assess pharmacological effects. Mean brachial systolic BP (SBP), diastolic BP (DBP) and pulse pressure (PP=SBP–DBP) were measured immediately before, during and after each scan, taking the mean of ≥3 measures in each arm (Vicorder ‘BP-trending’).
MRI was performed at 3 tesla (Siemens Prisma), including T1-weighted MPRAGE (TR/TE=2000/2.03ms, 1mm isotropic resolution, whole head coverage, FA=8°), rs-fMRI (TR/TE=430/40ms, Multiband 6, 30 slices, 3mm isotropic resolution, 1010 volumes, FA=90°), and field map from a double-echo gradient echo sequence (TR/TE1/TE2=482/4.92/7.38ms, 2mm isotropic resolution, FA=46°).
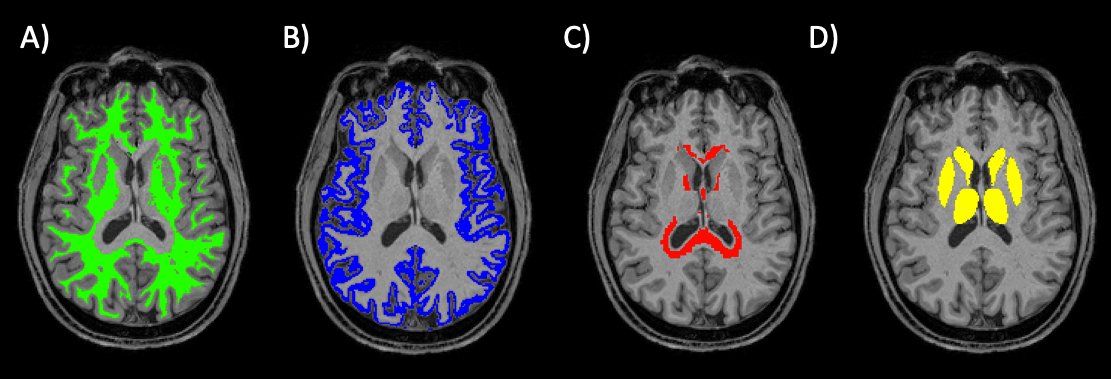
T1-weighted images were automatically segmented (FAST, FIRST, FSL5,6) to generate masks of cortical grey matter (GM), deep GM, WM and CSF. WM was divided into subcortical and periventricular WM (PVWM) through automated dilation of ventricular CSF (Figure 1). rs-fMRI images were linearly co-registered to T1-weighted images, and tissue masks transformed to functional space. MRI metrics of pulsatility were derived using a data-driven iterative general linear model (iGLM)2,3. Data were pre-processed (motion corrected, skull-stripped, distortion corrected, de-meaned) using FEAT7. rs-fMRI power spectra (PS) were thresholded to remove neuronal components <0.2 Hz, and fitted to a GLM model on a voxel-wise basis, incorporating both cardiac and respiratory components (estimated from whole-brain data). The GLM coefficient for the cardiac frequency (range 0.5-1.16Hz), βc, was thresholded (p<0.05) on a voxel-wise basis, and a refined power spectrum estimated from significantly pulsatile voxels. GLM fitting, thresholding and PS estimation were repeated until convergence of PS between iterations. Finally, the pulsatility magnitude (βc) was normalised by whole-brain mean rs-fMRI signal (S0), defined as Fractional Pulsatility, to allow between-subject comparison.
Drug allocation remains blinded for analysis until trial completion; thus drug sessions were combined across subjects for group-level preliminary analysis. Data were tested for normality using a Shapiro-Wilk test, and parametric/nonparametric tests chosen accordingly.
Results:
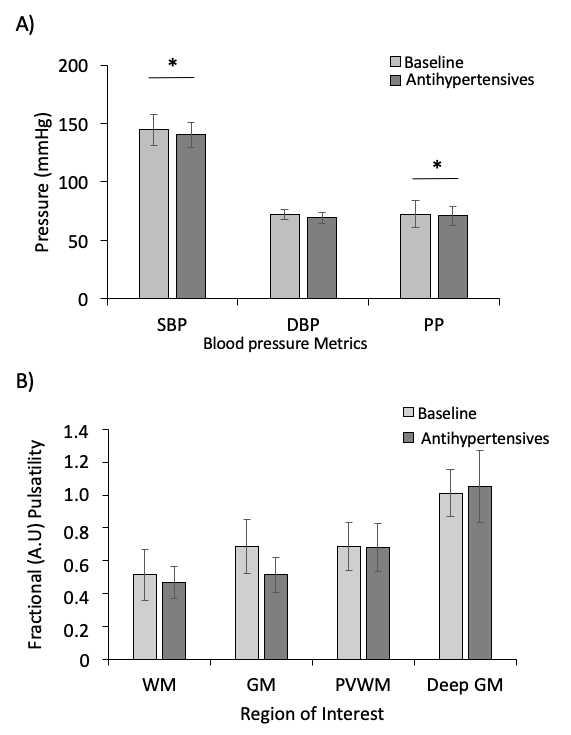
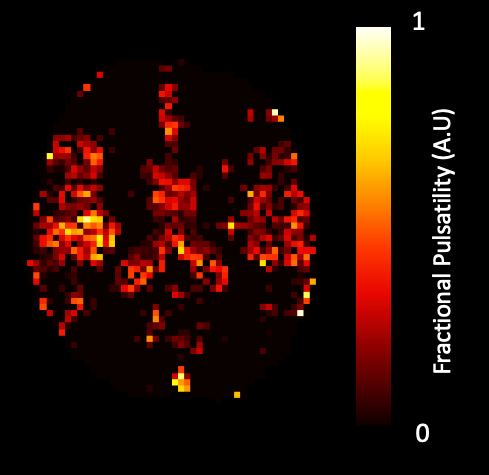
MRI data from three patients showed excessive motion (≥ 5mm) which was not fully removed through motion correction. Affected time-series were truncated from 1010 to 300 dynamics to remove artefacts and included in group analysis for 2 of the 3 subjects. In the final subject, truncation led to a failure of iGLM convergence, and this dataset was excluded from further analysis.Medication significantly lowered PP (p=0.003), mean SBP (p=0.002) with DBP unaltered (Wilcoxon signed-rank, Figure 2A). Fractional pulsatility showed a non-significant trend to reduction with medication in GM and WM (Figure 2B). A representative map of Fractional Pulsatility is shown in Figure 3.
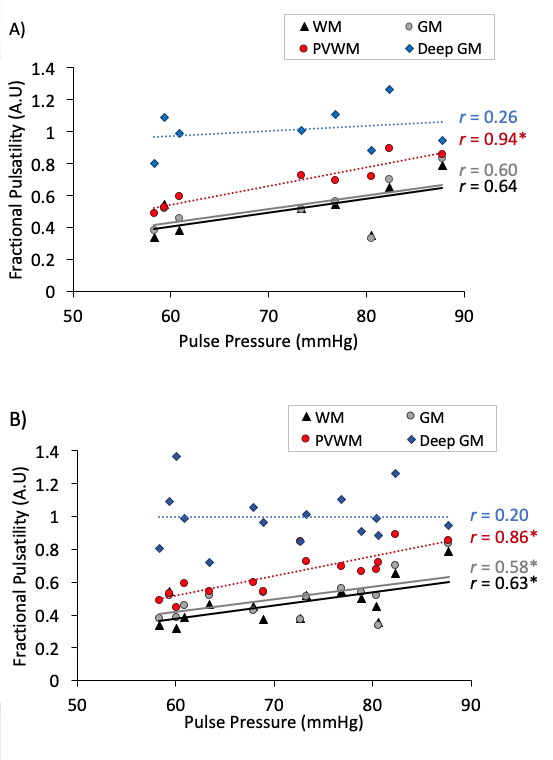
At baseline, there was a significant association between PP and Fractional Pulsatility in PVWM (r= 0.94, p<0.001, Figure 4A), with trends for association in WM (r=0.64, p=0.087) and GM (r=0.640 p=0.11). Across all visits, there was a significant association between PP and Fractional Pulsatility (Figure 4B) in WM (r=0.63, p=0.0082), GM (r=0.58, p=0.018) and PVWM (r=0.86 p<0.001). Deep GM showed no significant association with PP.
Discussion:
We observed a significant association between systemic pulse pressure and data-driven rs-fMRI measures of regional cerebral pulsatility, both at baseline and on antihypertensive medication. The strength of association varied across tissue types, and was strongest in periventricular WM, known to be at increased risk of tissue damage. Regional dependence could indicate that pulsatility is a pathophysiologically causative factor in the development of WM damage in SVD, and a potential treatment target. Furthermore, this analysis provides a practical method to measure epidemiological associations and assess treatment effects with pulsatility using MRI, independent of external physiological measures.Prior to unblinding at study completion, we are underpowered to determine an effect of specific antihypertensive treatments or between-drug differences in cerebral pulsatility. However, we demonstrate the feasibility and validity of rs-fMRI to assess treatment effects relevant to SVD. The trend for reduction in pulsatility across multiple tissues may reflect concordant effects of BP reduction under antihypertensives; however, unblinding will be required for adequate sensitivity. This will also allow group-level, voxel-wise analysis for between-drug effects.
Acknowledgements
This research was supported by the National Institute for Health Research (NIHR) Oxford Biomedical Research Centre (BRC). The TREAT-SVDs trial is funded by an EU Horizon 2020 grant (No 666881). AW is funded by a Wellcome Trust CRCD Fellowship (206589/Z/17/Z). The Wellcome Centre for Integrative Neuroimaging is funded by a Centre Grant (203139/Z/16/Z). The views expressed are those of the author(s) and not necessarily those of the NHS, the NIHR or the Department of Health.References
[1] Wardlaw et al., The Lancet Neurology, a8: 684-696 (2019)
[2] Viessmann et al., NeuroImage 162: 93-105 (2017)
[3] Viessmann et al., NeuroImage 287: 68-76 (2019)
[4] Ray et al., Proc. ISMRM, #2661 (2019)
[5] Zhang et al., IEEE Trans Med, 20: 45-57 (2001)
[6] Patenaude et al., NeuroImage, 56:907-922, (2011)
[7] Woolrich et al., NeuroImage, 14: 1370–1386 (2001)
Figures