1555
Synthetic MRI reveals leukoaraiosis is associated with cerebral small vessel diseases rather than cerebral atherosclerosis1Radiology, Beijing Hospital, Beijing, China, 2GE Healthcare, Beijing, China
Synopsis
We explored the feasibility of applying Synthetic MRI to quantify leukoaraiosis and further investigated the association of leukoaraiosis with small vascular cerebral diseases and large vessel atherosclerosis in individuals with acute cerebral vascular symptom. The results show that LA could be evaluated by the volume and relaxation time from synthetic MRI and it was associated with lacune and cerebral microbleeds rather than large cerebral atherosclerosis. This finding suggests that quantitative information provided by Synthetic MRI can help to evaluate leukoaraiosis, and leukoaraiosis may be a type of cerebral small vascular diseases instead of intracranial or extracranial cerebral atherosclerosis.
Introduction
Synthetic MRI could provide quantitative T1, T2, PD values in leukoaraiosis(LA) lesions in addition to the volume information which has been widely used in the studies of white matter diseases[1]. This study sets out to demonstrate the validity of quantifying LA by relaxometric characteristics from Synthetic MRI. Furthermore, we aim to implement Synthetic MRI to investigate the association of LA with small vascular cerebral diseases (Csvds) and large vessel atherosclerosis.Methods
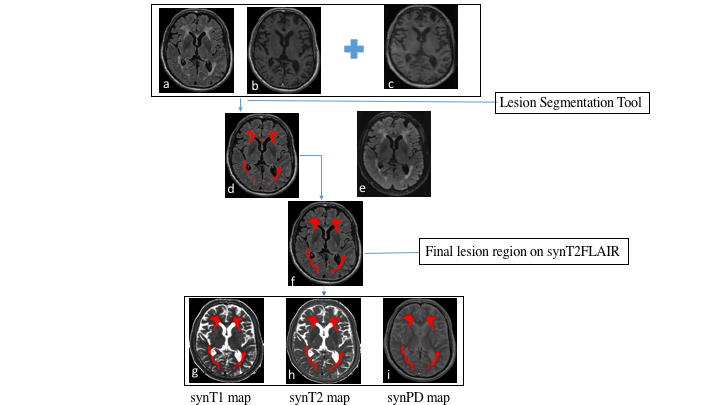
One hundred and thirty-one patients with acute cerebral vascular symptom were enrolled in this study. All participants underwent the conventional T2-weighted imaging (T2WI), BRAVO, CUBE FLAIR, and Synthetic MRI acquisition on a 3.0T MR system (SIGNA Pioneer, GE Healthcare, Milwaukee, WI). Either CT angiography (CTA) or MR angiography (MRA) was also obtained. The detail acquisition parameters are as follows: 1) T2WI, TR/TE = 5637/130 ms, FOV = 240×240 mm, matrix = 448×448, slice thickness/gap = 5/1.5 mm; 2) BRAVO, TR/TE = 7.1/2.6 ms, FOV = 224×224 mm, matrix = 224×224, slice thickness = 1 mm; 3) CUBE FLAIR, TR/TE = 5500/100 ms, FOV = 256×256 mm, matrix = 256×256, slice thickness = 1.4 mm; 4) Synthetic MRI, TR/TE1/TE2 = 4303/22/88.1 ms, FOV = 240×240 mm, matrix = 320×256, slice thickness/gap = 4/1 mm. The acquired synthetic MRI data was processed with SyMRI software (ver. 8.0, SyntheticMR, Linkoping, Sweden) to generate the T1-weighted image (synT1W), T2-weighted FLAIR image (synT2FLAIR), T1 map (synT1 Map), T2 map (synT2 Map), and proton density map (synPD Map)[2]. The synT2FLAIR and synT1W images were further processed by Lesion Segmentation Tool (LST version 2.0.4) using the lesion growth algorithm with BRAVO images as the reference, and a threshold of 0.1[3]. Due to the inconsistency between synT2FLAIR and conventional FLAIR image[2], CUBE FLAIR images were registered and resampled to synT2FLAIR images as the reference for manual lesion region adjustment. To avoid the lesion contamination from CSF in periventricular region, a CSF mask segmented from BRAVO images, was used to mask out the lesion within. A representative example of LA lesion extraction work flow was shown in Figure 1.The quantitative measurements of LA including T1, T2, PD values and the LA volume ratio (LAVR) were extracted.The absence or presence of lacune and cerebral microbleeds (CMBs) was rated based on CUBE FLAIR and T2*WI images. Intracranial or Extracranial atherosclerosis stenosis (ICAS or ECAS) was defined as lumen narrowing more than 50% on MRA or CTA. Spearman correlation was conducted to analyze the association of LAVR with T1 T2, and PD value, respectively. Multivariable logistic regression analysis was performed to determine the correlation of LAVR with Csvds and ICAS or ECAS after adjusting for potential confounding factors.Results
LAVR demonstrated a positive association with T2 value, a negative association with T1 value, and no association with PD value. In the multivariable regression analysis, LAVR was independently correlated with age (OR =1.13; 95% CI = 1.07–1.20; P < 0.001), lacune (OR = 3.03; 95% CI = 1.17–7.87; P = 0.022) and CMBs (OR = 6.95; 95% CI = 1.59–30.45; P = 0.01). A statistical significance was found in both age (OR = 1.10; 95% CI = 1.05–1.15; P < 0.001) and lacune (OR = 2.43; 95% CI = 1.01–5.83; P = 0.047) with T2 value of LA. There was a significant relationship between lacune and PD value of LA (OR = 2.81; 95% CI = 1.24–6.35; P = 0.013). Meanwhile, age, lacune and CMBs were not associated with T1 value of LA (P = 0.668, 0.994 and 0.282, respectively). Furthermore, we also found that ICAS and ECAS were not associated with T1,T2, PD value and LAVR (P = 0.588, 0.75, 0.506 and 0.14, respectively).Discussion and Conclusion
Synthetic MRI could simultaneously provide quantitative measurements of T1, T2, and PD value and the volume information of LA. Our results demonstrated that the relaxometric characteristics show some relationship with volume of LA, indicating that the these parameters could reveal the pathophysiological features of LA. The correlation of LA with lacune and CMBs rather than ICAS or ECAS suggests that LA may be a kind of Csvds, which shares a common pathological mechanism with lacune and CMBs. Further studies are needed to validate our results and explore their clinical significances with a larger sample size.Acknowledgements
No acknowledgement found.References
[1]Hagiwara A, Hori M, Yokoyama K, et al. Synthetic MRI in the Detection of Multiple Sclerosis Plaques. AJNR American journal of neuroradiology. 2017; 38(2):257-263.
[2]Hagiwara A, Warntjes M, Hori M, et al. SyMRI of the Brain: Rapid Quantification of Relaxation Rates and Proton Density, With Synthetic MRI, Automatic Brain Segmentation, and Myelin Measurement. Investigative radiology.2017; 52 (10):647-657.
[3]Schmidt P, Gaser C, Arsic M, et al. An automated tool for detection of FLAIR-hyperintense white-matter lesions in Multiple Sclerosis. NeuroImage. 2012; 59 (4):3774-3783.
Figures