1553
Brain Iron Imaging Markers in the Presence of White Matter Hyperintensities1Physics and Astronomy, University of Rochester, Webster, NY, United States, 2Neurology, University of Rochester, Rochester, NY, United States, 3Imaging Sciences, University of Rochester, Rochester, NY, United States
Synopsis
HIV-infected individuals are at increased risk of developing white matter hyperintensities (WMHs), which can lead to increased iron deposition in deep gray matter structures. In this abstract, we evaluate three region of interest (ROI) brain iron metrics and introduce a novel population-based whole-brain iron metric, the expected iron coefficient (EIC), derived from quantitative susceptibility mapping (QSM) in the context of HIV and mild WMH burden. While the ROI metrics did not show any significant differences between cohorts, the EIC was able to detect iron related differences in a cohort with WMH burden, due to increased statistical power.
Introduction
Excessive iron accumulation in deep grey matter (DGM) is implicated in several neurogenerative diseases predominantly affecting the white matter1. It has been reported that iron accumulation in DGM may contribute to neurodegeneration through the generation of reactive oxygen species and may be associated with white matter hyperintensities (WMH)2. Quantitative susceptibility mapping (QSM) and R2* mapping are some of the most sensitive MRI techniques for studying brain iron3. Here we evaluate three iron sensitive markers (QSM, R2*, and iron microenvironment coefficient (IMC)4) and introduce a novel population-based marker, expected iron coefficient (EIC), reflective of iron deposition, in the presence of HIV-infection and mild WMH burden.Methods
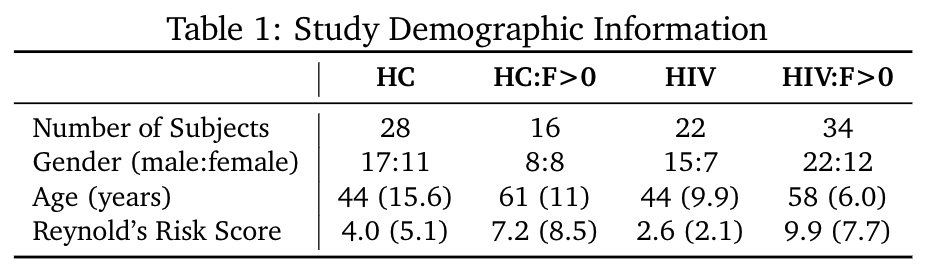
We propose the EIC as a novel whole brain iron marker to detect subtle changes in iron deposition in the presence of white matter disease that cannot otherwise be detected with standard region-of-interest (ROI) or voxel-based based approaches. The EIC is calculated for each population by regressing the average QSM values of each subject in a cohort against the ROI-based expected iron depositions (EID) across the brain: $$\chi = EIC * EID + \rho$$ where $$$\chi$$$ is the mean susceptibility in ppb, $$$\rho$$$ is a linear combination of related clinical covariates, and the EID, in mg non-haemin iron per 100g fresh weight, is calculated for each ROI in Hallgren et al.5 in which a, b, and c are region specific constants and t is age in years: $$EID = a(1 - e^{-bt}) + c$$ Differences in EIC between populations reflect deviations in typical iron deposition across the brain in the context of particular pathologies. The EIC combines the statistical power of multiple brain regions to detect iron-related differences between cohorts.In an ongoing study, 100 subjects (mean± SD age = 52.0 ± 14.7 years, range = 19 – 78 years) were evaluated and divided into four cohorts (HC, HC:F>0, HIV, and HIV:F>0) based on HIV-status and WMH presence to study the effects of cerebrovascular disease in HIV patients (Table 1). All imaging was conducted on a 3T (Siemens Prisma) scanner equipped with a 64-channel head coil (Erlangen, Germany). The protocol includes high-resolution T1-weighted (T1w) anatomical images using the MPRAGE sequence (TI=950ms, TE/TR=3.87ms/1,620ms, 1mm isotropic resolution). QSM data was acquired with a 3D mGRE pulse sequence (8-echo bi-polar readout train, TE of 1st echo=2.7ms, TR=62ms, echo spacing =1.5ms, bandwidth=930Hz/pixel, voxel size=0.94×0.94×2mm3). QSM and R2* maps were calculated using the Morphology Enabled Dipole Inversion with zero-tissue referencing (MEDI+0) toolbox, with default settings.6-9 T1w images were used for registration to MNI152 2mm space. The caudate (CAU), putamen (PUT), globus pallidus (PAL), thalamus (THA), prefrontal area, frontal white matter, and parietal lobes were selected as ROIs and applied as masks in native QSM space by the JHU and Harvard-Oxford atlases available in FSL10. Paired-sample t-tests and ANCOVA analyses were conducted to evaluate the QSM, R2*, IMC and EIC markers in the presence of mild WMHs.
Results
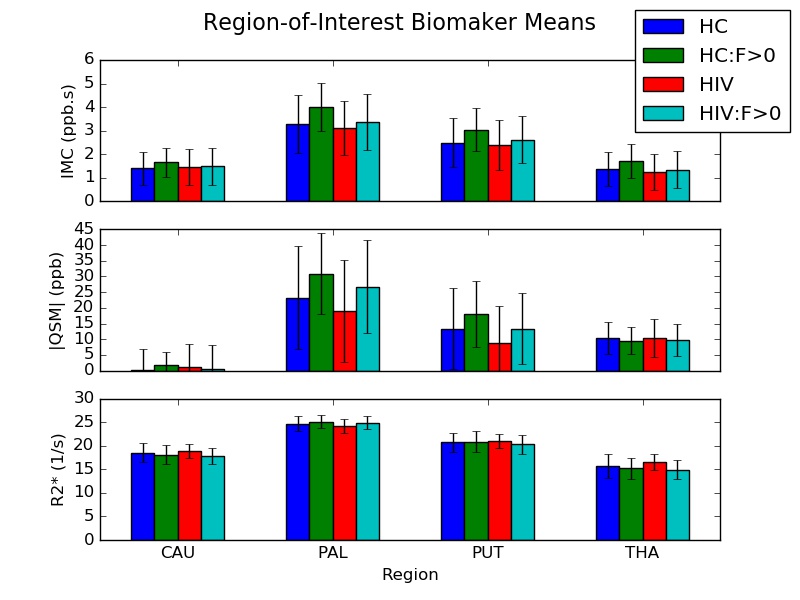
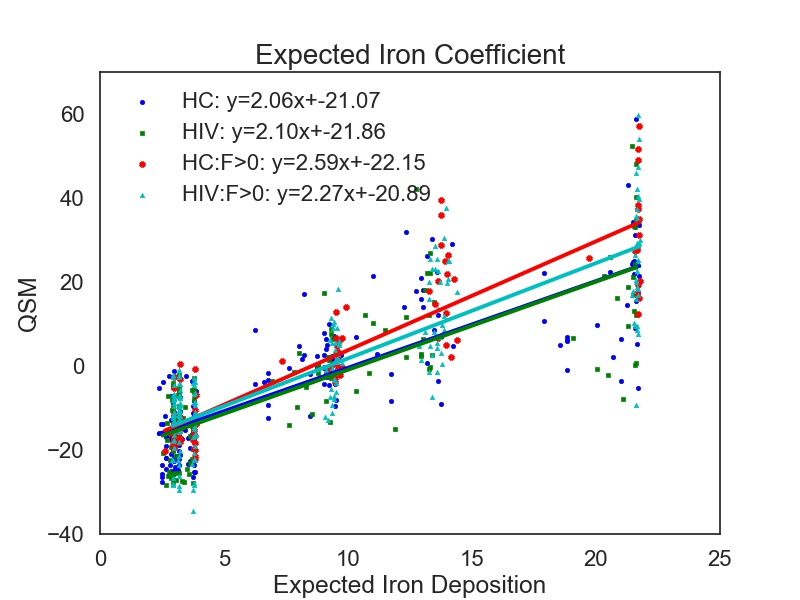
DGM ROIs and example R2* and QSM maps are presented in Figure 1. Figure 2 shows the group means of the IMC, QSM, and R2* metrics. After false discovery rate correction, none of the ROI metrics showed any significant cohort differences. Figure 3 shows a scatterplot of the mean susceptibility versus EID per region. Regression slopes reflect the EIC for each cohort. An F-test comparing multivariate full and restricted models showed equal variance between overall models. T-tests of EICs between cohorts showed that the HC and HIV cohorts were significantly different from the HC:F>0 cohort (p=0.000072). No other EIC comparisons showed significant differences.Discussion
The results show that there is no significant difference between any of the cohorts using any ROI-based metric. QSM, R2*, and the IMC are thought to be measures sensitive to changes in iron deposition and distribution. The IMC additionally provides information about the mesoscopic properties of iron distribution in DGM, which are not significantly different in the presence of HIV nor WMHs.We introduce a new population-based brain iron imaging marker, EIC, which is the regression slope between QSM and EID across the entire brain, to detect iron deposition effects between populations. Since the EIC is the slope between QSM and EID, which is a function of age, the EIC cannot increase or decrease with respect to age. Rather, the EIC can only deviate from healthy aging due to an underlying condition. Due to its utilization of multiple instead of individual ROIs, with increased statistical power, it is shown to be able to detect more subtle deviations in iron deposition in the presence of WMHs.
Conclusion
In this study we evaluated four iron-related imaging markers to find effects of HIV and mild WMH burden. We found that while no significant differences were identified in ROI-based markers, the introduced group-level imaging marker EIC was able to find significant differences between healthy controls and patients with mild WMH burden. While the limitations of interpretation of this new marker are still being explored, we believe the increased EIC reflects increased iron deposition in the context of WMHs.Acknowledgements
This work was made possible by the NIH 5R01AG054328-03 grant. We would also like to acknowledge the study coordinators and study participants.
References
1. Thomas M, Jankovic J. Neurodegenerative disease and iron storage in the brain. Curr Opin Neurol, 17:437–442, 2004.
2. Yan S, Sun J, Chen Y, Selim M, Lou M. Brain iron deposition in white matter hyperintensities: a 3-T MRI study. Age (Dordr) 35, 1927e1936, 2013.
3. Langkammer C, et al. Quantitative susceptibility mapping (QSM) as a means to measure brain iron? A post mortem validation study. NeuroImagevol, 62,3:1593-9, 2012.
4. Taege, Yanis, Hagemeier J, Bergsland H, Dwyer M, Weinstock-Guttman B, Zivadinov R, and Schweser F. Assessment of mesoscopic properties of deep gray matter iron through a model-based simultaneous analysis of magnetic susceptibility and R2* - A pilot study in patients with multiple sclerosis and normal controls. NeuroImage, 186:308–320, 2019.
5. Hallgren B, and Sourander P. The Effect of Age on the Non-Haemin Iron in the Human Brain. Journal of Neurochemistry, 3:41–51, 1958.
6. de Rochefort et al. Quantitative Susceptibility Map Reconstruction from MR Phase Data Using Bayesian Regularization: Validation and Application to Brian Imaging. MRM, 63(1):194-206, 2010.
7. Liu Z, et al. MEDI+0: Morphology Enabled Dipole Inversion with Automatic Uniform Cerebrospinal Fluid Zero Reference for Quantitative Susceptibility Mapping. MRM, 2017.
8. Liu J, Liu T, et al. Morphology Enabled Dipole Inversion for Quantitative Susceptibility Mapping Using Structural Consistency Between the Magnitude Image and the Susceptibility Map. Neuroimage, 59(3): 2560-2568, 2013.
9. Liu T, et al. Nonlinear Formulation of the Magnetic Field to Source Relationship for Robust Quantitative Susceptibility Mapping. Magn Reson Med, 69:467-476, 2013.
10. Jenkinson M, Beckmann C, Behrens T, Woolrich M, Smith S. FSL. Neuroimage, 62:782-90, 2012.
Figures