1551
Increases in Arteriolar Cerebral Blood Volume in Huntington’s Disease Measured with Inflow-based Vascular-space-occupancy (iVASO) MRI at 7T1The Russell H. Morgan Department of Radiology and Radiological Sciences, Johns Hopkins University School of Medicine, Baltimore, MD, United States, 2F.M. Kirby Research Center for Functional Brain Imaging, Kennedy Krieger Institute, Baltimore, MD, United States, 3Department of Biomedical Engineering, Johns Hopkins University, Baltimore, MD, United States, 4Department of Neurology, University of Greifswald, Greifswald, Germany, 5Department of Neurology, Johns Hopkins University School of Medicine, Baltimore, MD, United States, 6Department of Psychiatry and Behavioral Sciences, Johns Hopkins University School of Medicine, Baltimore, MD, United States, 7The Solomon H. Snyder Department of Neuroscience, Johns Hopkins University School of Medicine, Baltimore, MD, United States, 8Department of Pharmacology and Molecular Sciences, Johns Hopkins University School of Medicine, Baltimore, MD, United States
Synopsis
Significantly elevated arteriolar cerebral blood volume (CBVa) in premanifest Huntington’s Disease (HD) patients has been reported previously. In this study, inflow-based vascular-space-occupancy (iVASO) MRI at 7 Tesla was used to measure CBVa in HD patients longitudinally. We found significant longitudinal increases in CBVa in premanifest HD patients in several brain regions primarily related to motor, visual and cognitive functions, which suggests CBVa as a potential candidate biomarker for HD especially in the premanifest stage.
INTRODUCTION
Huntington’s Disease (HD) is an autosomal dominant neurodegenerative disease caused by a cytosine-adenine-guanine (CAG) trinucleotide repeat expansion in the Huntingtin gene. It is characterized by motor, psychiatric, and cognitive signs and symptoms and a relentless progression to death.1,2 Genetic testing can identify mutation-positive subjects decades before the clinical onset of motor symptoms.1 The premanifest period in HD is defined as the time period before a clinical diagnosis can be made in the mutation-positive subjects based on the “unequivocal presence of an otherwise unexplained extrapyramidal movement disorder”.3 Since clinical signs and symptoms cannot be relied on as outcome measures in the premanifest period, the development of early biomarkers is of great importance for the evaluation of potential therapeutics in HD. Regional brain atrophy, especially in the striatum, is currently the most commonly used imaging biomarker in HD. There is evidence to suggest that neurovascular changes in the HD brain may occur earlier and progress faster. Neurophysiology studies have shown that small pial arteries and arterioles are the vessels most affected by metabolic changes in the brain. A recent study using the inflow-based vascular-space-occupancy (iVASO) MRI technique4-6 reported significantly elevated arteriolar cerebral blood volume (CBVa) in premanifest HD patients, which correlated with genetic measures and preceded brain atrophy.7,8 Similar results have also been reported using different MRI approaches.9 In this study, we applied iVASO MRI to investigate longitudinal CBVa changes in the brain in premanifest HD patients. Compared with the previous study, the iVASO MRI technique has been improved from single-slice acquisition to 3D whole-brain coverage, which can measure regional CBVa in the entire brain.METHODS
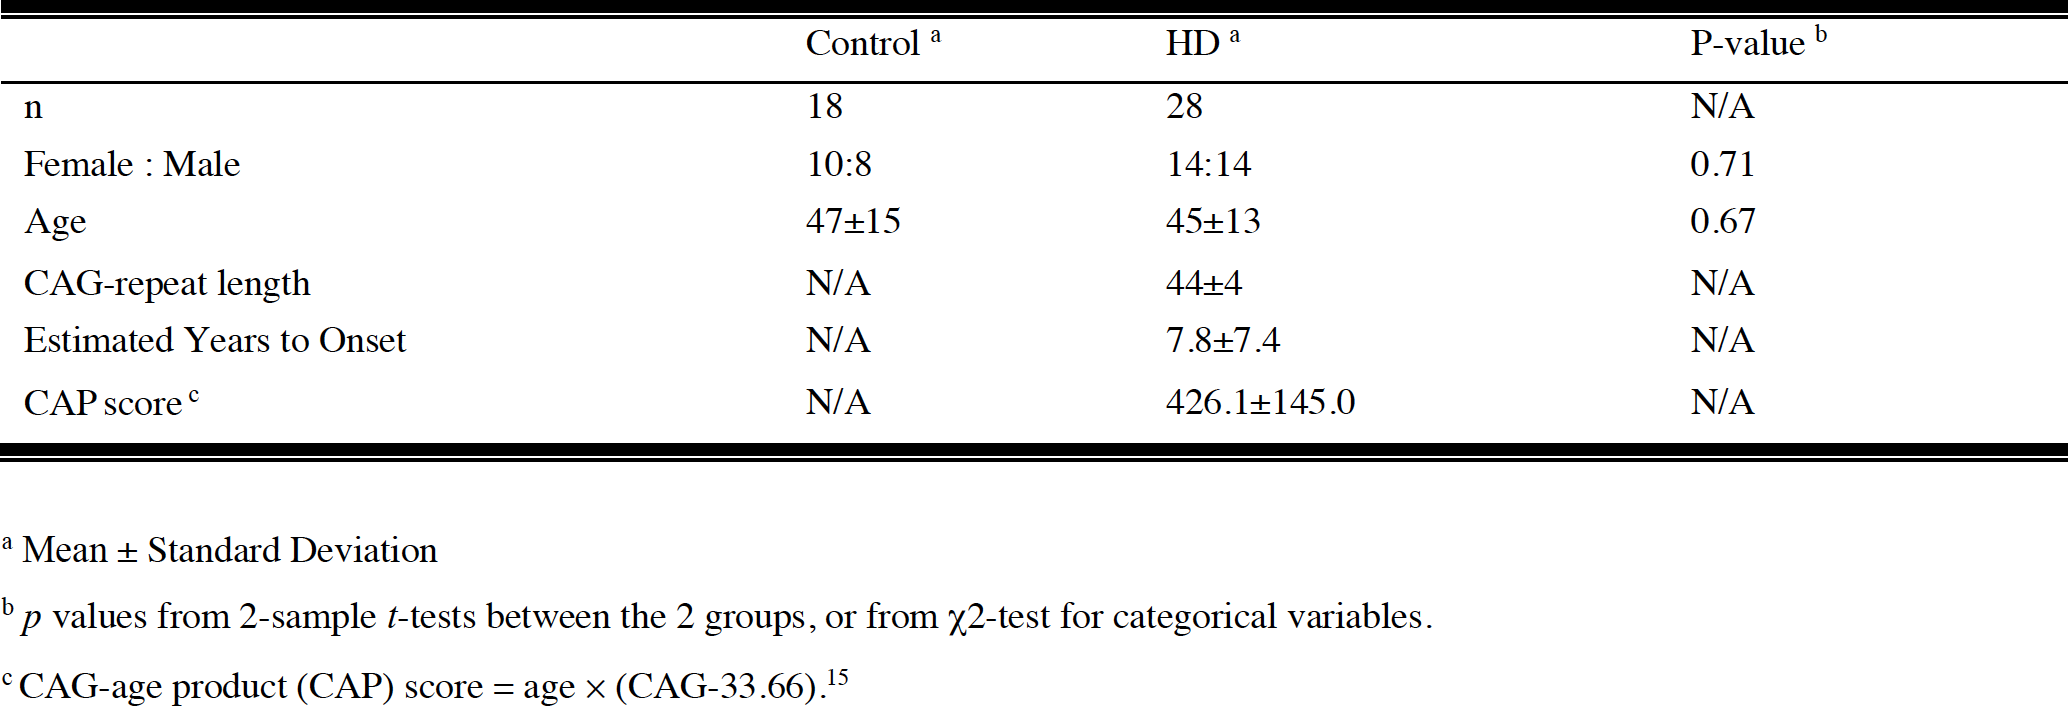
28 premanifest HD patients and 18 controls were recruited for this study, matched in sex and age (Table 1a). Among them, 15 premanifest HD patients, and 8 controls completed a follow-up scan approximately one year after the initial visit (Table 1b). We note that more male HD patients were involved at the follow-up scan. Therefore, it is important to include sex as a covariate in all analysis, and longitudinal analysis was limited to the comparison of results within the same subjects. MRI scans were performed on a 7T Philips scanner: 1) MP2RAGE anatomical scan (voxel=0.65mm isotropic); 2) CBVa was measured using 3D-iVASO-MRI with whole-brain coverage (voxel=2x2x4mm3; other parameters see the reference cited10). Images were analyzed using Matlab6 (Mathworks, USA) and SPM8 (UCL, UK). Partial volume effects from white-matter and cerebrospinal-fluid surrounding the grey-matter voxels were corrected on the iVASO signals as described previously.7 Group difference was assessed using multivariate analysis of covariance, and multiple comparisons were corrected by the Benjamini-Hochberg false discovery rate (FDR) procedure.11 Longitudinal data analysis was performed using a two-sample matched-pairs Fisher-Pitman permutation test (number of permutations = 50000).12RESULTS
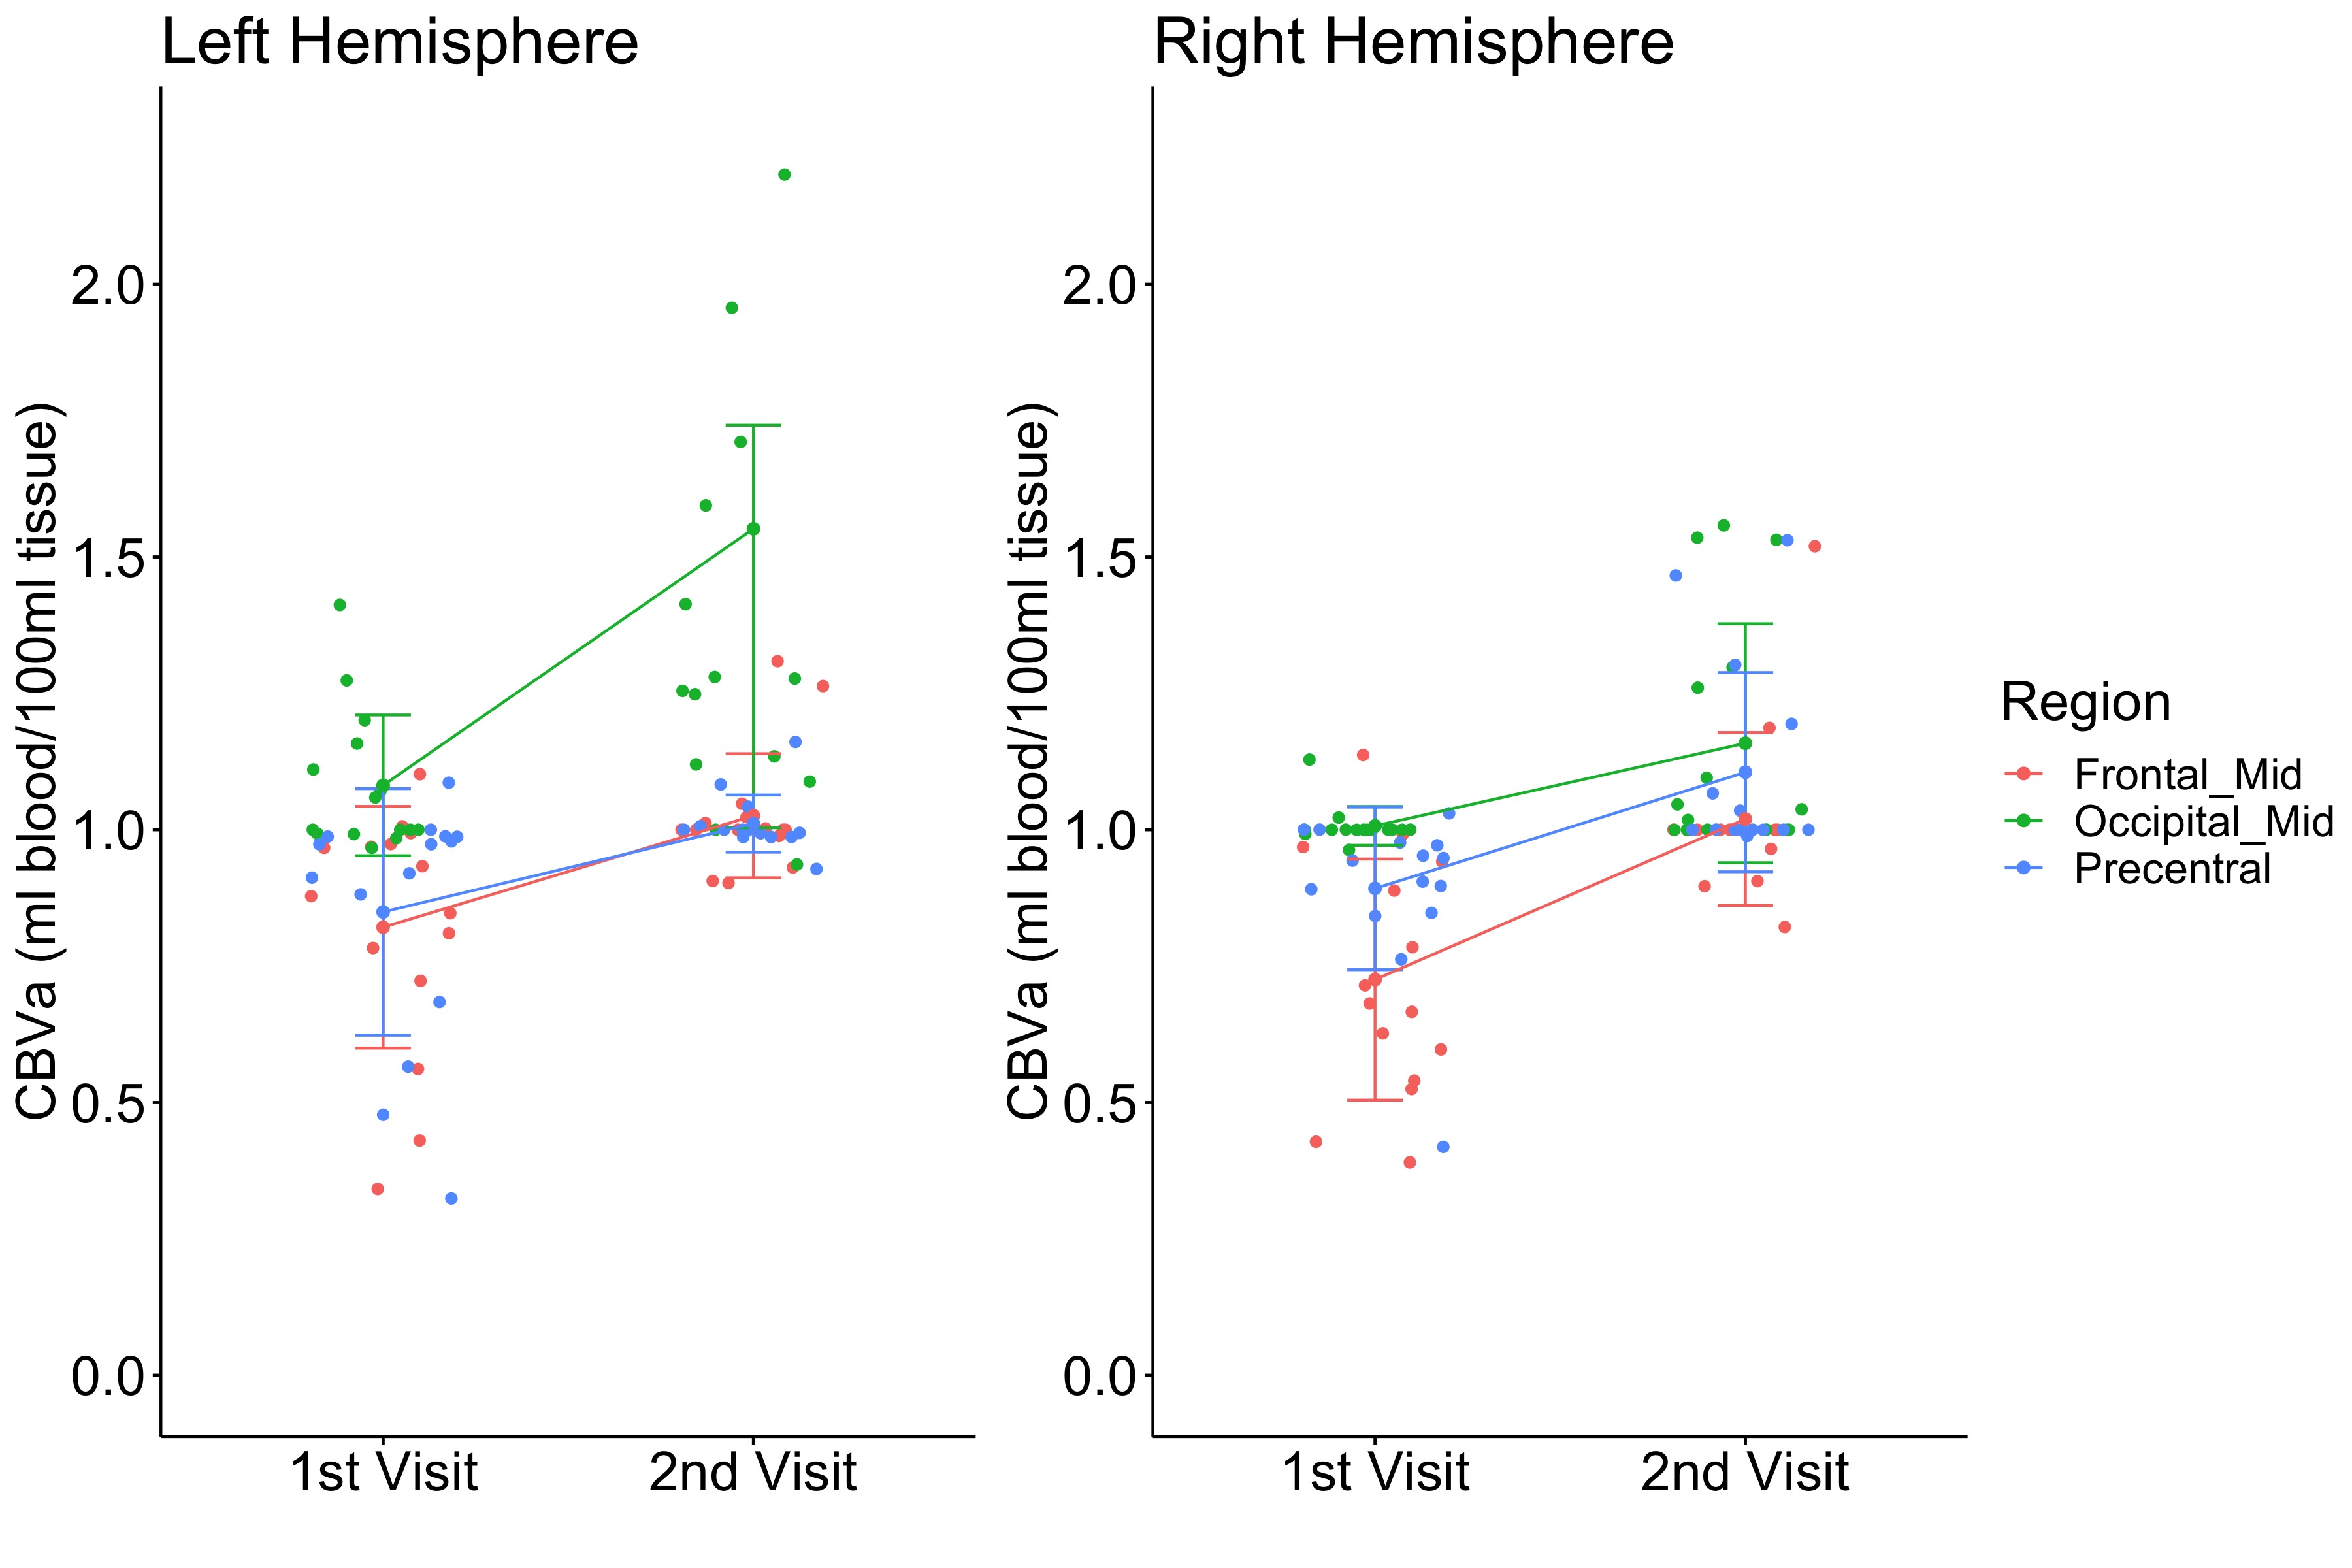
Figure 1 shows all regions with significantly increased CBVa in premanifest HD patients compared to controls at the first visit overlaid on normalized anatomical scans. The quantitative results are summarized in Table 2. Several regions (frontal_mid, occipital_mid, and precentral) showed significant longitudinal increases in CBVa at the second visit (Figure 2).DISCUSSION
The cross-sectional findings at the first visit in this study were consistent with our previous reports.7,8 CBVa values in controls were all in normal range for humans. The brain regions of HD gene-carriers with increased CBVa include the striatum (caudate and putamen), typically the earliest region showing atrophy in HD. Many regions related to sensorimotor functions (paracentral, precentral, postcentral, and supplementary motor area) also showed increased CBVa, consistent with the central role of motor abnormalities in HD. Visual impairment and cognitive decline are also affected in HD. In our data, several regions in the occipital and prefrontal cortex, primarily related to vision and cognition, respectively, showed increased CBVa in HD patients. Among the regions with cross-sectional increases in CBVa at the first visit, our longitudinal data showed significant increases in CBVa in three areas: precentral, occipital_mid, and frontal_mid, primarily associated with motor, visual and cognitive functions. The striatum did not show further CBVa increase at the follow-up visit compared to the initial scan, which seems to indicate that an increase in striatal CBVa might occur earlier in the striatum than in cortical regions, and then plateaued. Histological studies have reported significantly increased vessel density and length, but slightly decreased vessel diameter in HD mouse model,13 which are congruent with our MRI findings of increased CBVa. An increased level of vascular endothelial growth factor (VEGF), a protein that stimulates angiogenesis and regulates vessel growth, was found in mutant huntingtin striatal cells14, suggesting a mechanism for the increased CBVa. Whether this microvascular change is a direct effect of the HD mutation or is secondary to metabolic changes in the HD brain remains to be further investigated.CONCLUSION
We confirmed and expanded findings of increased CBVa in premanifest HD patients made in a previous cross-sectional study, and in addition found significant longitudinal increases in CBVa in premanifest HD patients in several brain regions primarily related to motor, visual and cognitive functions in the brain. These results further indicate that CBVa may be a potential biomarker for HD, especially in the premanifest stage.Acknowledgements
This study was supported by the Dana Foundation and the Huntington’s Disease Society of America (HDSA).References
1. Ross CA, Aylward EH, Wild EJ, et al. Huntington disease: natural history, biomarkers and prospects for therapeutics. Nat Rev Neurol 2014;10:204-16.
2. Reiner A, Dragatsis I, Dietrich P. Genetics and neuropathology of Huntington's disease. Int Rev Neurobiol 2011;98:325-72.
3. Reilmann R, Leavitt BR, Ross CA. Diagnostic criteria for Huntington's disease based on natural history. Mov Disord 2014;29:1335-41.
4. Donahue MJ, Sideso E, MacIntosh BJ, Kennedy J, Handa A, Jezzard P. Absolute arterial cerebral blood volume quantification using inflow vascular-space-occupancy with dynamic subtraction magnetic resonance imaging. J Cereb Blood Flow Metab 2010;30:1329-42.
5. Hua J, Qin Q, Donahue MJ, Zhou J, Pekar JJ, van Zijl PC. Inflow-based vascular-space-occupancy (iVASO) MRI. Magn Reson Med 2011;66:40-56.
6. Hua J, Qin Q, Pekar JJ, van Zijl PC. Measurement of absolute arterial cerebral blood volume in human brain without using a contrast agent. NMR Biomed 2011;24:1313-25.
7. Hua J, Unschuld PG, Margolis RL, van Zijl PC, Ross CA. Elevated arteriolar cerebral blood volume in prodromal Huntington's disease. Mov Disord 2014;29:396-401.
8. Hua J, Unschuld P, Margolis R, Van Zijl P, Ross C. Elevated Arteriolar Cerebral Blood Volume in Prodromal Huntington's Disease Patients Measured with Ultra-High Field Magnetic Resonance Imaging (S20.005). Neurology 2013;80:S20.005-S20.
9. Drouin-Ouellet J, Sawiak SJ, Cisbani G, et al. Cerebrovascular and blood-brain barrier impairments in Huntington's disease: Potential implications for its pathophysiology. Ann Neurol 2015;78:160-77.
10. Hua J, Brandt AS, Lee S, et al. Abnormal Grey Matter Arteriolar Cerebral Blood Volume in Schizophrenia Measured With 3D Inflow-Based Vascular-Space-Occupancy MRI at 7T. Schizophr Bull 2017;43:620-32.
11. Benjamini Y, Hochberg Y. Controlling the False Discovery Rate: A Practical and Powerful Approach to Multiple Testing. Journal of the Royal Statistical Society Series B (Methodological) 1995;57:289-300.
12. Kaiser J. An Exact and a Monte Carlo Proposal to the Fisher–Pitman Permutation Tests for Paired Replicates and for Independent Samples. The Stata Journal 2007;7:402-12.
13. Franciosi S, Ryu JK, Shim Y, et al. Age-dependent neurovascular abnormalities and altered microglial morphology in the YAC128 mouse model of Huntington disease. Neurobiol Dis 2011.
14. Niatsetskaya Z, Basso M, Speer RE, et al. HIF prolyl hydroxylase inhibitors prevent neuronal death induced by mitochondrial toxins: therapeutic implications for Huntington's disease and Alzheimer's disease. Antioxid Redox Signal 2010;12:435-43.
15. Langbehn DR, Brinkman RR, Falush D, Paulsen JS, Hayden MR, Group IHsDC. A new model for prediction of the age of onset and penetrance for Huntington's disease based on CAG length. Clin Genet 2004;65:267-77.
16. Lancaster JL, Woldorff MG, Parsons LM, et al. Automated Talairach atlas labels for functional brain mapping. Hum Brain Mapp 2000;10:120-31.
Figures