1550
Revealing reduced CBF and prolonged ATT in prodromal AD using a 3D pCASL with Hadamard encoded multiple PLDs
Yang Wang1, Alexander Cohen1, Guanyu Chen2, Veena Nair3, Piero Antuono4, Malgorzata Franczak4, Vivek Prabhakaran3, Barbara Bendlin5, Shi-Jiang Li2, and the Alzheimer’s Disease Connectome Project6
1Radiology, Medical College of Wisconsin, Milwaukee, WI, United States, 2Biophysics, Medical College of Wisconsin, Milwaukee, WI, United States, 3Radiology, University of Wisconsin School of Medicine and Public Health, Madison, WI, United States, 4Neurology, Medical College of Wisconsin, Milwaukee, WI, United States, 5Medicine, University of Wisconsin School of Medicine and Public Health, Madison, WI, United States, 6Medical College of Wisconsin, Milwaukee, WI, United States
1Radiology, Medical College of Wisconsin, Milwaukee, WI, United States, 2Biophysics, Medical College of Wisconsin, Milwaukee, WI, United States, 3Radiology, University of Wisconsin School of Medicine and Public Health, Madison, WI, United States, 4Neurology, Medical College of Wisconsin, Milwaukee, WI, United States, 5Medicine, University of Wisconsin School of Medicine and Public Health, Madison, WI, United States, 6Medical College of Wisconsin, Milwaukee, WI, United States
Synopsis
Measured using an advanced 3D pCASL with Hadamard encoded multiple PLDs, patients with MCI showed different patterns of reduced CBF and prolonged ATT in comparison with both AD patients and healthy controls, where CBF and ATT changes highly correlated with severity of disease as assessed by neuropsychological test scores. These findings raised the speculation of underlying vascular abnormality in prodromal AD. Our results also suggested that ATT could serve as useful hemodynamic measure of itself, may be of diagnostic utility for prodromal AD or vascular dementia.
INTRODUCTION
Alzheimer’s disease (AD) is characterized by the accumulation of hyperphosphorylated tau and neurotoxic Aβ in the brain, where hypoxia could stimulate this build-up of AD-specific proteins 1. While arterial spin labeling (ASL) perfusion MRI is increasingly proving to be a promising tool for exploring neurovascular changes in AD, the conventional 3D pCASL (pseudo-continuous ASL) with a single post-labeling delay (PLD) is influenced by arterial transit time (ATT), i.e. the time it takes for the blood to travel from the labeling slice to the brain voxel of interest. Taking ATT into account can therefore reduce potential bias when comparing cerebral blood flow (CBF) between groups. Furthermore, ATT is interesting in itself, as it may reflect underlying pathologies2. Emerging evidence has shown reduced CBF in MCI and AD compared to normal elderly adults, whereas ATT prolongation was also observed in AD, although the ATT finding is less consistent across studies3. The neurovascular pathways to AD prognosis remain largely unclear. This study was thus aimed to evaluate both CBF and ATT alterations in mild cognitive impairment (MCI) and AD using an advanced 3D pCASL with Hadamard encoded multiple PLDs.METHODS
90 participants were selected from the ADCP (Alzheimer’s Disease Connectome Project) at both MCW and UW Madison sites, including 15 MCI patients, 11 AD patients and 64 age-matched healthy controls (HC). All subjects underwent a MR perfusion scan on 3T using a 3D pCASL sequence with Hadamard encoded multiple PLDs (1.0s, 1.25s, 2.46s) with TR/TE as 9708/11.24ms and voxel size of 1.875x1.875x4mm3. A long (3.5s) labeling block was divided into three sub-boluses and four images were acquired with control and label sub-boluses corresponding to the Hadamard matrix. This was followed by a segmented stack of spirals readout. A raw magnetization (M0) image was collected on the last repetition. Images for each of the three delays were extracted using a linear combination of the four images. After reconstruction, individual ATT was computed using the signal-weighted delay method4. CBF for each PLD was estimated using the one-compartment model5. The ATT corrected CBF was then estimated6. Additional high-resolution T1-weighted MRPAGE was acquired using parameters: TR/TE=5.36/2.412, Flip angle=8, voxel size=0.5x0.5x0.8. In post-processing, MPRAGE image was first segmented into gray matter, white matter and cerebrospinal fluid using FSL. The M0 image was linearly registered to the MPRAGE. The CBF and ATT maps were registered to the MPRAGE using the M0 to MPRAGE transformation matrix. The MPRAGE image was then registered to MNI space using ANTS and the M0, CBF, and ATT images were registered to MNI (Montreal Neurological Institute) space using the MPRAGE to MNI transformation matrix. Individual CBF and ATT maps were analyzed for the group difference in the frame of general linear model. Age and sex were used as covariates whenever appropriate to control for potential confounds.RESULTS
While no group difference in age, gender and years of education was detected, significant difference in the MoCA (Montreal Cognitive Assessment) score was found (HC > MCI > AD, p<0.0001). At the threshold of p<0.01 (FWE corrected), significant reduction in CBF demonstrated in different areas in the voxel-wise group comparisons of MCI vs. HC, AD vs. MCI, as well as AD vs. HC (Fig 1). Furthermore, significantly increased ATT was detected in different areas in group comparison of MCI vs. HC and AD vs. HC, but no difference in AD vs. MCI (Fig. 1). Further region-of-interest (ROI) analysis was conducted using a template of functional networks7. Significant correlations were detected between the MoCA score and ROI averaged CBF and ATT in most regions, where the highest correlation was found in default mode network (DMN) for both CBF (r=0.793, p<0.001) and ATT (r=-0.685, p<0.005). Stepwise multiple regression analysis showed that 76.8% variance of MoCA score in MCI and AD could be explained by DMN averaged CBF and ATT combined, where decreased DMN CBF or increased DMN ATT significantly predicted the lower MoCA score in MCI and AD patients.DISCUSSION
In accord with previous reports 1,3, we found AD with reduced CBF and prolonged ATT compared to HC. Moreover, MCI showed intermediate changes in reduced CBF between AD and HC groups, but very similar patterns of increased ATT as that in AD, which indicated possible different trajectory of ATT and CBF during the prognosis in prodromal AD. While less CBF was observed secondary to aberration in metabolism commonly seen in MCI and AD, diffuse ATT elevation in prodromal AD might lead to the speculation of underlying vascular impairment. Recent highlights from the Alzheimer’s Disease Neuroimaging Initiative suggested that data-driven AD progression models supported multifactorial interactions rather than a linear cascade of events8, where vascular pathology burden may act through both Aβ dependent and independent mechanisms to exacerbate AD progression8. Further investigation is warranted to validate our findings in longitudinal studies.CONCLUSION
Reduction in regional CBF are an essential feature of AD and have been linked to cerebral amyloid-deposition. Using advanced 3D pCASL with multiple PLDs to characterize neurovascular changes including both CBF and ATT has important clinical implications to help classify patients with respect to their disease signature so that specific pathologies, including vascular pathways, can be therapeutically targeted1.Acknowledgements
This study is part of the Alzheimer’s Disease Connectome Project supported by National Institute on Aging (UF1AG051216).References
1. Strickland S. Blood will out: vascular contributions to Alzheimer's disease. The Journal of clinical investigation. 2018;128(2):556-563. 2. Alsop DC, Detre JA, Golay X, Gunther M, Hendrikse J, Hernandez-Garcia L, Lu H, MacIntosh BJ, Parkes LM, Smits M, van Osch MJ, Wang DJ, Wong EC, Zaharchuk G. Recommended implementation of arterial spin-labeled perfusion MRI for clinical applications: A consensus of the ISMRM perfusion study group and the European consortium for ASL in dementia. Magnetic resonance in medicine : official journal of the Society of Magnetic Resonance in Medicine / Society of Magnetic Resonance in Medicine. 2015;73(1):102-116. 3. Mak HK, Chan Q, Zhang Z, Petersen ET, Qiu D, Zhang L, Yau KK, Chu LW, Golay X. Quantitative assessment of cerebral hemodynamic parameters by QUASAR arterial spin labeling in Alzheimer's disease and cognitively normal Elderly adults at 3-tesla. J Alzheimers Dis. 2012;31(1):33-44. 4. Dai W, Robson PM, Shankaranarayanan A, Alsop DC. Reduced resolution transit delay prescan for quantitative continuous arterial spin labeling perfusion imaging. Magnetic Resonance in Medicine. 2012;67(5):1252-1265. 5. Dai W, Garcia D, de Bazelaire C, Alsop DC. Continuous flow-driven inversion for arterial spin labeling using pulsed radio frequency and gradient fields. Magnetic Resonance in Medicine. 2008;60(6):1488-1497. 6. Van der Thiel M, Rodriguez C, Giannakopoulos P, Burke M, Lebel RM, Gninenko N, Van De Ville D, Haller S. Brain perfusion measurements using multidelay arterial spin-labeling are systematically biased by the number of delays. American Journal of Neuroradiology. 2018;39(8):1432-1438. 7. Yeo BT, Krienen FM, Sepulcre J, Sabuncu MR, Lashkari D, Hollinshead M, Roffman JL, Smoller JW, Zollei L, Polimeni JR, Fischl B, Liu H, Buckner RL. The organization of the human cerebral cortex estimated by intrinsic functional connectivity. Journal of neurophysiology. 2011;106(3):1125-1165. 8. Veitch DP, Weiner MW, Aisen PS, Beckett LA, Cairns NJ, Green RC, Harvey D, Jack CR, Jagust W, Morris JC, Petersen RC, Saykin AJ, Shaw LM, Toga AW, Trojanowski JQ. Understanding disease progression and improving Alzheimer's disease clinical trials: Recent highlights from the Alzheimer's Disease Neuroimaging Initiative. Alzheimer's & Dementia. 2018.Figures
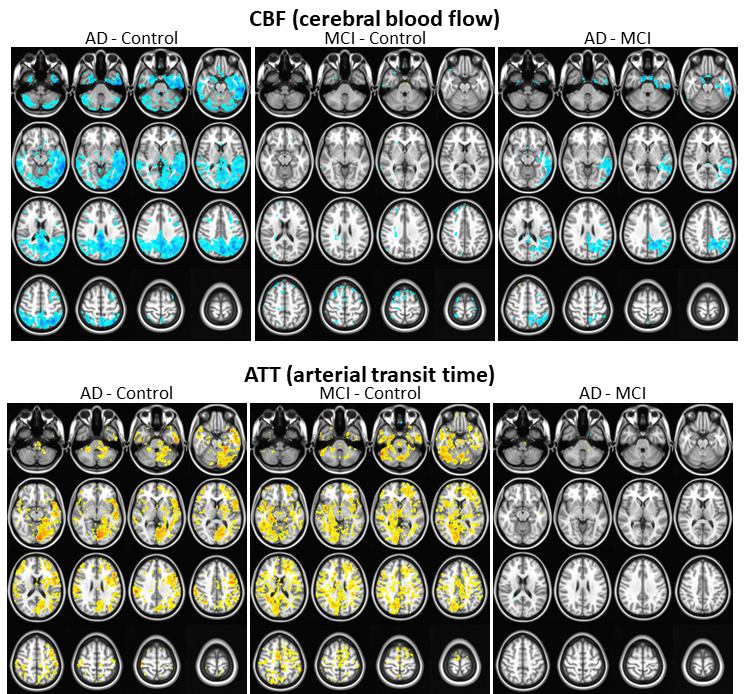
Group comparisons on CBF and ATT (note: hot color indicates increases while cold
color for decreases, corrected p < 0.01)