1549
Brain Iron Deposition and Cognitive Impairment in Idiopathic RBD: A Quantitative Susceptibility Mapping Study1Department of Radiology, Tianjin First Central Hospital, Tianjin Medical Imaging Institute, Tianjin, China, 2School of Graduates, Tianjin Medical Univeristy, Tianjin, China, 3MR Collaboration, Siemens Healthcare Ltd., Beijing, China, 4Department of Radiology, Wayne State University, Detroit, MI, United States
Synopsis
Iron metabolism is a research focus in α‑synucleinopathies. Excessive iron deposition may damage neurons and induce cognitive impairment. However, research on brain iron deposition in patients with idiopathic rapid eye movement sleep behavior disorder (iRBD) is lacking. Using quantitative susceptibility mapping (QSM), the present study showed that iRBD patients have greater brain iron deposition in the substantia nigra and dentate nucleus than healthy controls (HCs). Additionally, brain iron deposition in the striatum and cerebellum was associated with cognitive impairment, suggesting the potential of QSM as an auxiliary biomarker for neurodegeneration and the early evaluation of cognitive decline in iRBD patients.
Introduction
Idiopathic rapid eye movement sleep behavior disorder (iRBD) is the prodromal stage of α‑synucleinopathies. Iron metabolism is a research focus in α‑synucleinopathies. However, the number of previous studies using iron-related R2* mapping is sparse1 and shows R2* mapping to have low accuracy because of confounding factors (e.g., water content, calcium, and local field inhomogeneities).2 In contrast, the use of quantitative susceptibility mapping (QSM) allows for greater accuracy in quantifying iron accumulation in the cerebral nuclei and the hippocampus.3, 4 The purpose of this study was to use QSM to characterize brain iron deposition in iRBD patients and healthy controls (HCs) and then to evaluate for correlations between these imaging findings and cognitive impairment as measured by neuropsychological test scores.Methods
Study participants included 24 iRBD patients and 25 HCs who were age-, gender-, and education-matched. All the participants were observed with overnight video polysomnography (v-PSG).5 Magnetic resonance imaging (MRI) examinations were performed on 14 iRBD patients and 17 HCs using a 3T MRI scanner (MAGNETOM Prisma, Siemens Healthcare, Erlangen, Germany). The imaging parameters of the SWI sequence included: TR/TE = 28/20 ms; field of view = 220 × 200 mm2; voxel resolution = 0.5 × 0.5 × 2 mm3; number of slices = 60; flip angle = 15°; receiver bandwidth/pixel = 120 Hz/pixel; and acquisition time = 372 sec. QSM was reconstructed from phase and magnitude data using SMART (Detroit, Michigan, USA), and susceptibility of the bilateral gray matter nuclei and the hippocampus was measured using SPIN (Detroit, Michigan, USA) (Fig. 1). All the participants underwent neuropsychological testing (e.g., visuospatial, memory, attention-executive, and language). The test results were converted into the averaged neuropsychological-test z-scores. Two independent-sample t-tests were used to study the differences in the susceptibility of the cerebral nuclei and hippocampus. The relationship between the susceptibility of the cerebral nuclei and the hippocampus and neuropsychological-test z-scores in iRBD patients was investigated using Pearson's correlation analysis.Results
The susceptibility of the right substantia nigra (SN) and right dentate nucleus (DN) in iRBD patients was significantly higher compared with HCs (176.37 ± 23.71 vs. 157.74 ± 25.76, P = 0.047; 124.96 ± 31.91 vs. 100.01 ± 20.42, P = 0.013). The susceptibility of the left SN and left DN in iRBD patients was also higher than that in HCs; however, the difference was statistically significant but marginal (170.79 ± 22.80 vs. 156.01 ± 20.45, P = 0.067; 130.57 ± 29.83 vs. 111.22 ± 25.80, P = 0.063). The iRBD patients had significantly lower average cognition, visuospatial function, and memory function than the HCs (P = 0.039, 0.005, 0.038). The susceptibility of the bilateral caudate nuclei (CA) was negatively correlated with the average cognition z-score (right: r = -0.616, P = 0.019; left: r = -0.598, P = 0.024). The susceptibility of the left CA was negatively correlated with the attention-executive z-score (r = -0.542, P = 0.045). The susceptibility of the bilateral putamen (PUT) was negatively correlated with average and visuospatial z-scores (right: r = -0.617, P = 0.019; r = -0.638, P = 0.014; left: r = -0.576, P = 0.031; r = -0.591, P = 0.026). The susceptibility of the right DN was negatively correlated with the memory z-score (r = -0.554, P = 0.040).Discussion
This is the first study to explore brain iron deposition in iRBD patients using QSM and the correlation between iron deposition and cognitive function. In our cohort, we found that iRBD patients had excessive iron deposition in the bilateral SN and DN, with a significant difference on the right side. This suggests that increased brain iron deposition in the SN and DN may be a potential biomarker for early identification of α‑synucleinopathy before extrapyramidal and cerebellar symptoms begin. The iRBD patients had lower performance scores than HCs in visuospatial and memory function domains. This suggests that these factors comprise a possible early marker of neurodegenerative diseases. Brain iron deposition in some cerebral nuclei was negatively correlated with average cognition, attention-executive, visuospatial, and memory function z-scores. This indicates that iron deposition in the striatum and cerebellum may correlate with cognitive impairment in iRBD patients. It further highlights the importance of iron deposition in the mechanism of cognitive impairment in iRBD patients.Conclusion
Excessive brain iron deposition in the SN and DN evaluated by QSM may be a potential imaging biomarker for neurodegeneration in iRBD patients. Iron deposition in the striatum and DN was associated with cognitive impairment in iRBD patients, indicating that iron metabolism could be a potential target for disease-modifying interventions.Acknowledgements
This work was supported by the Natural Scientific Foundation of China (grant number 81901728 to Chao Chai, grant number 81871342 to Shuang Xia). Thanks Rong Xue, Xuan Zhang from the department of neurology for their help in the collection and evaluation of iRBD patients.References
1. Lee JH, Han YH, Cho JW, et al. Evaluation of brain iron content in idiopathic REM sleep behavior disorder using quantitative magnetic resonance imaging. Parkinsonism & related disorders 2014;20(7):776-778.
2. Deistung A, Schafer A, Schweser F, Biedermann U, Turner R, Reichenbach JR. Toward in vivo histology: a comparison of quantitative susceptibility mapping (QSM) with magnitude-, phase-, and R2*-imaging at ultra-high magnetic field strength. NeuroImage 2013;65:299-314.
3. Chai C, Yan S, Chu Z, et al. Quantitative measurement of brain iron deposition in patients with haemodialysis using susceptibility mapping. Metabolic brain disease 2015;30(2):563-571.
4. Chai C, Wang H, Liu S, et al. Increased iron deposition of deep cerebral gray matter structures in hemodialysis patients: A longitudinal study using quantitative susceptibility mapping. Journal of magnetic resonance imaging : JMRI 2019;49(3):786-799.
5. Sateia MJ. International classification of sleep disorders-third edition: highlights and modifications. Chest 2014;146(5):1387-1394.
Figures
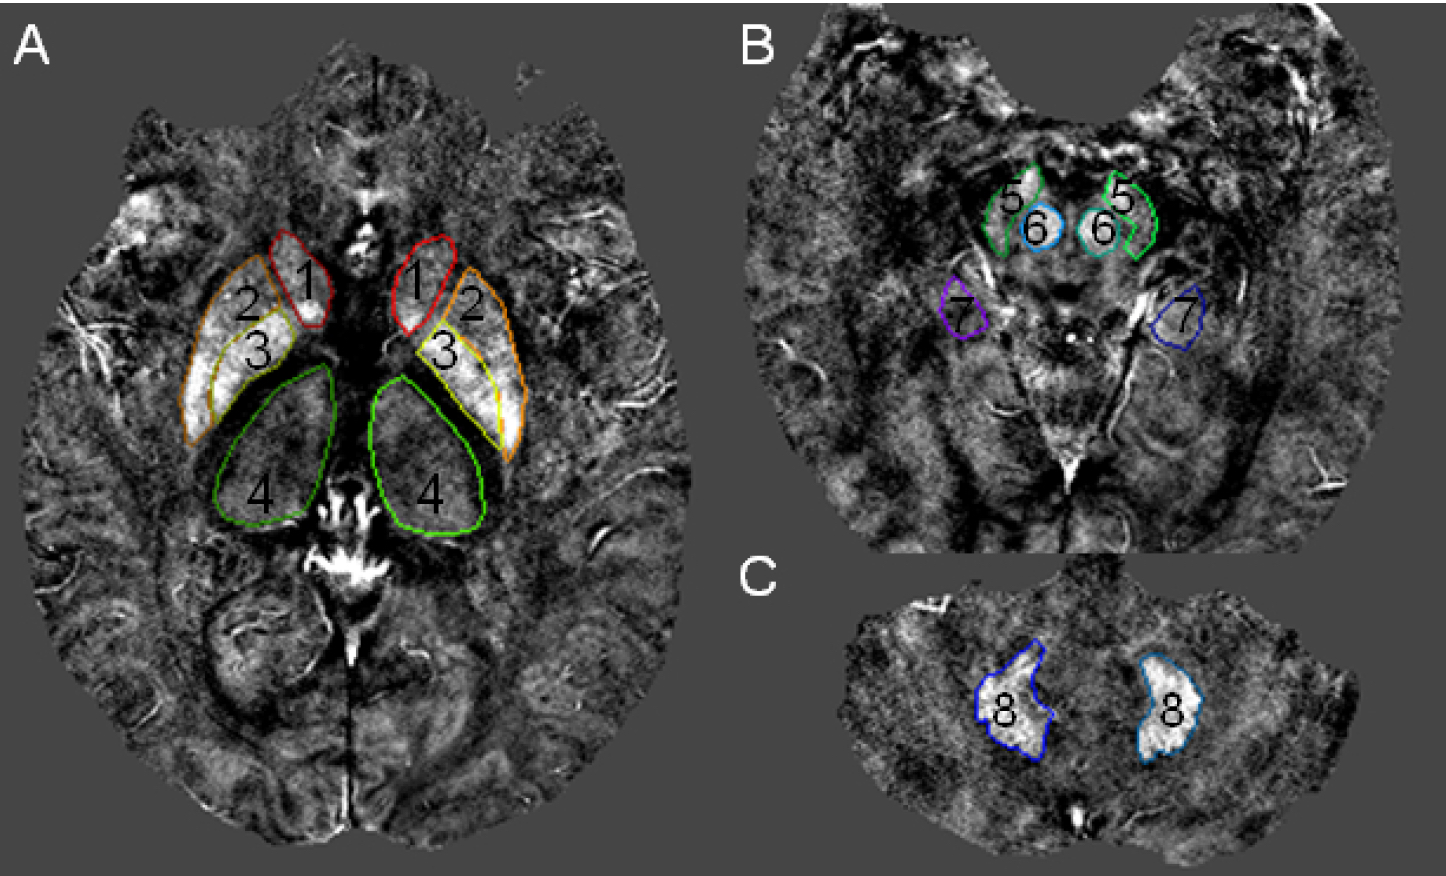
Fig. 1. The volumes of interest of gray matter nuclei and hippocampus outlined in the quantitative susceptibility mapping
1 = caudate head (CA); 2 = putamen (PUT); 3 = globus pallidus (GP); 4 = thalamus (THA); 5 = substantia nigra (SN); 6 = red nucleus (RN); 7 = hippocampus (HP); 8 = dentate nucleus (DN).
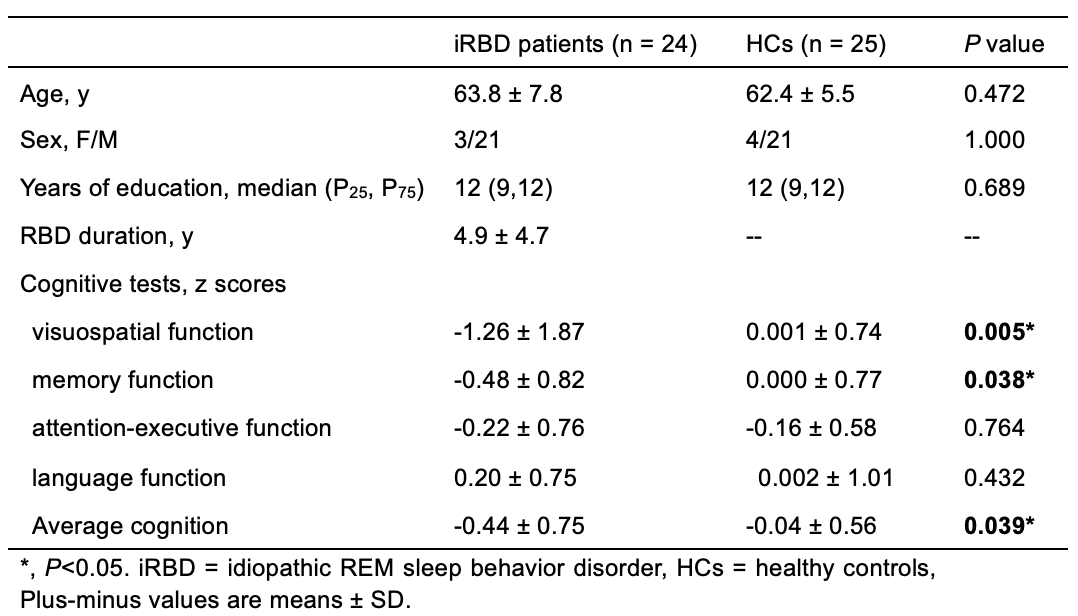
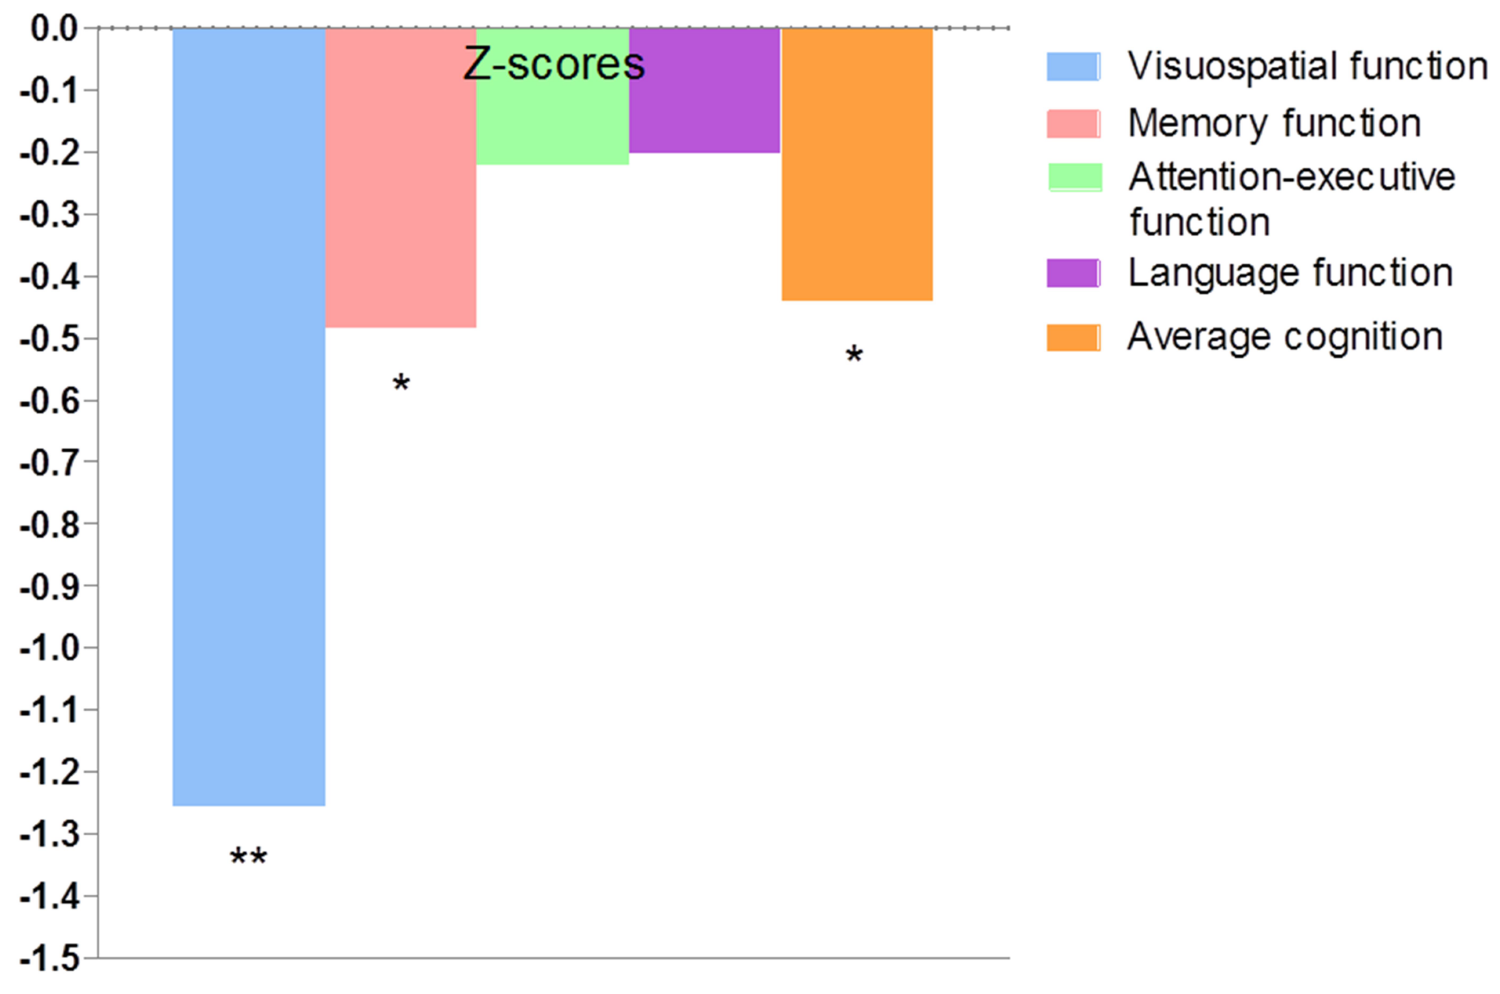
Fig. 3. Cognitive impairment in the iRBD patients compared with HCs
The iRBD patients performed worse in average cognition, visuospatial function and memory function compared with the HCs. Significant differences between the iRBD patients and HCs are represented as ∗p < 0.05, **p < 0.01.
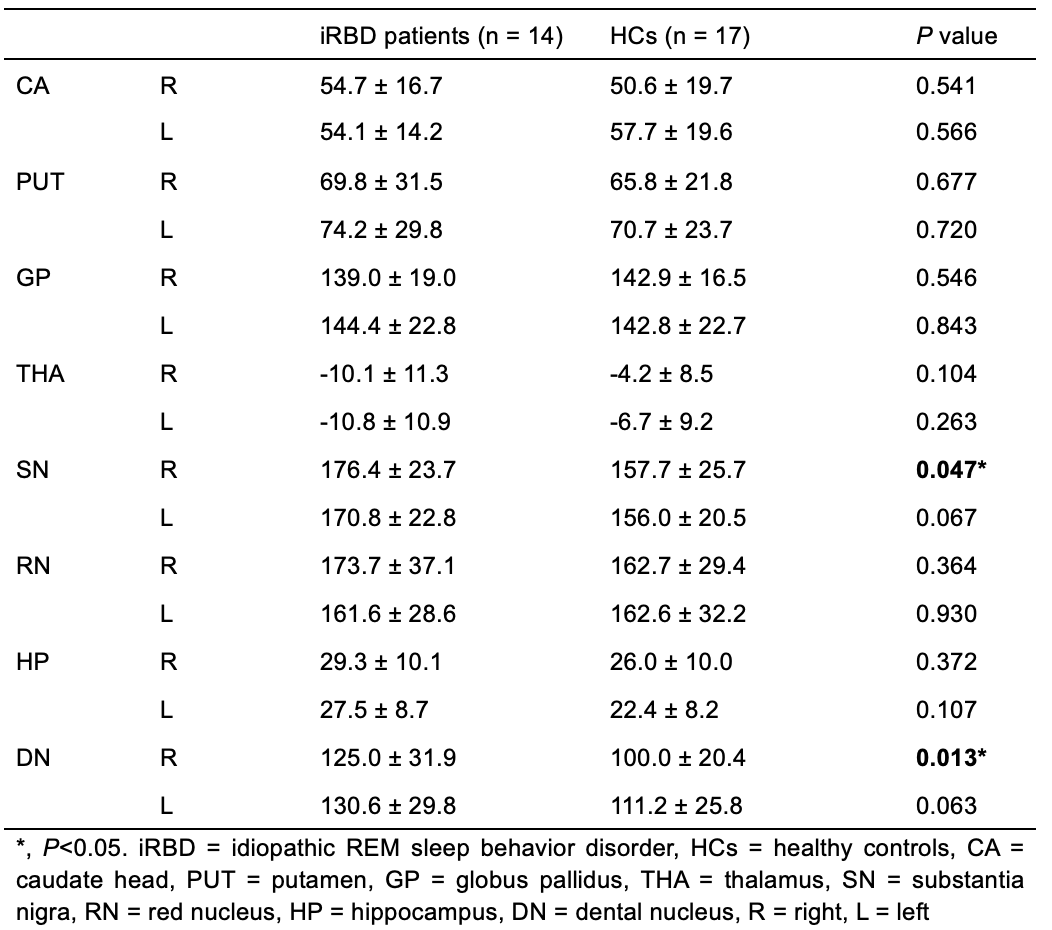
Fig. 4. Comparison of the susceptibility between the iRBD patients and HCs
Significant differences between the iRBD patients and HCs are represented as ∗p < 0.05.
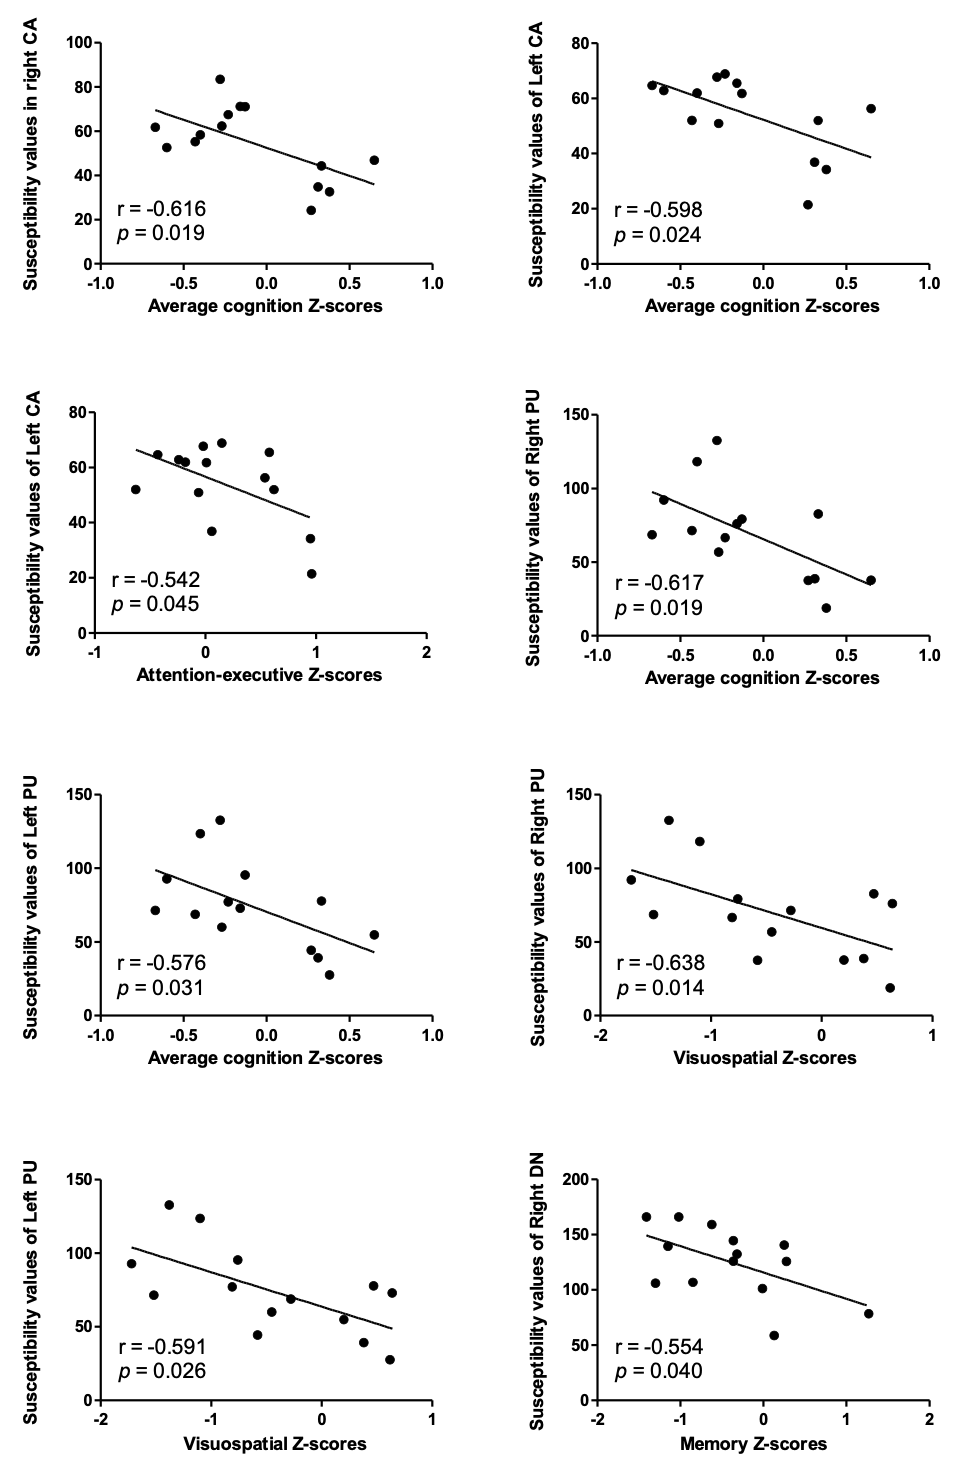
Fig. 5. Correlations between the susceptibility of cerebral structures and cognition in the iRBD patients
CA = caudate head, PUT = putamen, DN = dental nucleus.