1547
Structural and resting state network alterations in Spinocerebellar Ataxia Type 2 in comparison with healthy controls1Department of NMR & MRI Facility, All India Institute of Medical Sciences, New Delhi, India, 2School of Computer & Systems Sciences, Jawaharlal Nehru University, New Delhi, India, 3Department of Neurology, All India Institute of Medical Sciences, New Delhi, India
Synopsis
Spinocerebellar ataxia type 2 (SCA2) is a progressive disorder with an early onset (10-15 years). On resting state functional connectivity and volume morphometrics, we observed reduced midbrain, sensory-motor and prefrontal cortex functional connectivity with cerebellum and atrophy in inferior parietal lobule, middle occipital gyrus, fusiform gyrus, posterior cingulate, precentral gyrus, parahippocampal gyrus, superior temporal gyrus, postcentral gyrus, fusiform gyrus, middle frontal gyrus, middle temporal gyrus, inferior frontal gyrus, middle temporal gyrus, pyramis, uvula, culmen, inferior semi-lunar lobule in SCA2, with respect to healthy controls. Atrophy and alterations in the rsfMRI connectivity suggest deficits in motor and cognition in SCA2 patients.
Introduction
Spinocerebellar Ataxia (SCA) is associated with atrophy of the cerebellum and its progressive degeneration. Different types of SCA (SCA types: 1, 2, 3, 6, 7, 10, 12, 14 and 17) have various pathologies, viz., acquired, and/or genetically transmitted. Spinocerebellar Ataxia Type 2 (SCA2) is a progressive disorder, with an early onset age (10-15 years). SCA2 is characterized by clinical symptoms and the CAG repeat expansion on chromosome. Magnetic resonance Imaging (MRI) based voxel and tensor based morphometry can reveal brain atrophy, and may be associated with abnormalities in structural and functional connectivity of brain structures1-3.Methodology
Thirteen symptomatic SCA2 patients (mean age 32±10 years; 6F/7M) without head tremor and after genetic confirmation obtained from the ataxia clinic, and eighteen healthy subjects (age=33±14, 7F/11M) with no history of neurological and psychiatric disorder other than SCA2 were recruited. All subjects were informed and consent was obtained prior to investigations the examination. Structural MRI (3D T1 weighted, 1 slab of 180 slices) and resting state (rsfMRI) data (220 dynamics, 35 contiguous axial slices, TR=2000 ms; TE= 40 ms) were acquired using 32 channel head coil on a 3 T scanner (Ingenia 3 T, M/s. Philips HealthCare, The Netherlands). MR images were analyzed using CAT12 toolbox4 of SPM (Statistic Parametric Mapping)5 and CONN software6, using default parameters.Results
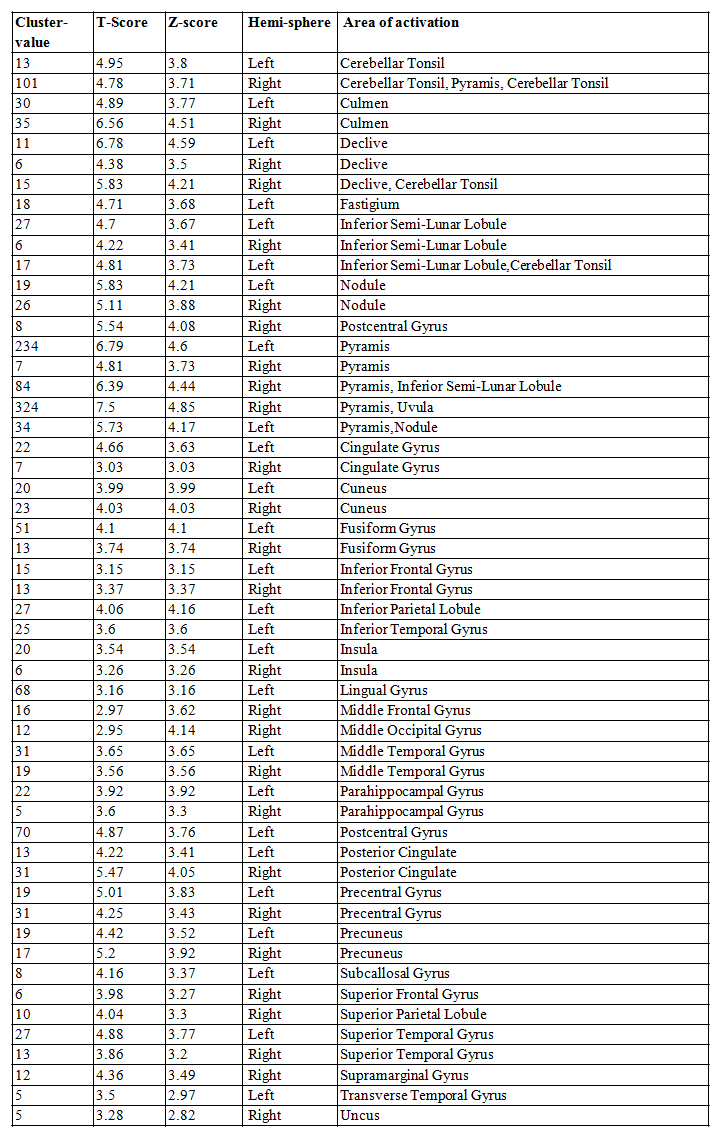
SCA2 group revealed prominent atrophy in bilateral inferior parietal lobule, middle occipital gyrus, fusiform gyrus, posterior cingulate, precentral gyrus, parahippocampal gyrus, superior temporal gyrus, postcentral gyrus, fusiform gyrus, middle frontal gyrus, middle temporal gyrus, inferior frontal gyrus, middle temporal gyrus, insula, lingual gyrus, pyramis, uvula, culmen, inferior semi-lunar lobule, nodule, cerebellar tonsil, culmen, declive, fastigium, inferior semi-lunar lobule, pyramis on comparison with the control (Table 1, Figure 1). We also observed degeneration of the motor area (pre and post central gyrus), somatosensory area and the brainstem. On seed to target analysis, reduced connectivity was observed between cerebellum and mid brain areas (including thalamus, hippocampus), precuneus, frontal medial cortex, supplementary motor cortex and the primary motor area in SCA2 group in contrast to the healthy controls (Figure 2, Table 2).Discussion
Motor control and voluntary activity such as balance, speech and posture are controlled predominantly by cerebellum. Brain atrophy was evident in SCA2 on VBM (voxel based morphometry) measures, more reflected on the ventral stream. We observed functional connectivity alterations in cerebellum and vermis, mid brain, thalamus and precentral gyrus, and may be attributed to impaired motor functions in SCA29. Altered connectivity involving lingual gyrus, temporal occipital fusiform correlate more with language associated motor function and attention networks7-9. Atrophy and alterations in the rsfMRI connectivity suggest deficits in motor and cognition in SCA2 patients.Conclusion
Structural and resting network changes are associated with the spinocerebellar degeneration and may be attributed to the motor and cognitive dysfunctions.Acknowledgements
No acknowledgement found.References
1. Cocozza S, Saccà F, Cervo A, et al. Modifications of resting state networks in spinocerebellar ataxia type 2, Movement Disorders. 2015, 30:1382-90.
2. Olivito G, Cercignani M, Lupo M, et al. Neural substrates of motor and cognitive dysfunctions in SCA2 patients: a network based statistics analysis. NeuroImage: Clinical. 2017;14:719-25.
3. Giocondo F, Curcio G. Spinocerebellar ataxia: a critical review of cognitive and socio-cognitive deficits. International Journal of Neuroscience. 2018;128:182-91.
4. Ashburner J., (2010) VBM tutorial, UCL (http://www.fil.ion.ucl.ac.uk/ ~john/misc/ VBMclass10.pdf)
5. Friston KJ. Statistical parametric mapping. In Neuroscience databases 2003 (pp. 237-250), Springer, Boston, MA.
6. Whitfield-Gabrieli S, Nieto-Castanon A. Conn: a functional connectivity toolbox for correlated and anticorrelated brain networks. Brain connectivity. 2012;2:125-41.
7. Olivito G, Lupo M, Iacobacci C, et al. Microstructural MRI basis of the cognitive functions in patients with spinocerebellar ataxia type 2. Neuroscience. 2017;366:44-53.
8. Reetz K, Rodríguez‐Labrada R, Dogan I, et al. Brain atrophy measures in preclinical and manifest spinocerebellar ataxia type 2. Annals of Clinical and Translational Neurology. 2018;5:128-37.
9. Olivito G, Lupo M, Iacobacci C, et al. Structural cerebellar correlates of cognitive functions in spinocerebellar ataxia type 2. Journal of neurology. 2018;265:597-606.
Figures
Figure 1: Grey matter atrophy in SCA2 with respect to HC (a) rendered on whole brain image and (b) slice view (estimated using CAT12, two sample t-test, p<0.001, uncorrected, voxel threshold 5)