1542
Different iron deposition patterns in hemodialysis patients with and without restless legs syndrome on MRI-QSM1Department of Radiology, Beijing Friendship Hospital, Capital Medical University, Beijing, China, 2GE Healthecare, MR Research China, Beijing, Beijing, China, Beijing, China
Synopsis
Based on gradient echo (GRE) magnetic resonance phase data, quantitative susceptibility mapping (QSM) is a novel technology which allows the noninvasive assessment of magnetic tissue susceptibility distribution in hemodialysis (HD) patients. And iron deficiency in gray matter nuclei has been reported to lead to idiopathic restless legs syndrome (RLS) symptoms. In this study, we investigated the differences of iron deposition patterns between HD-RLS and HD-nRLS patients scanned at 3T. Compared with HD-nRLS patients, HD-RLS patients demonstrated reduced susceptibility in caudate nucleus and puteman. Hence, QSM can be used for HD-RLS diagnosis and intervention.
Introduction
Restless legs syndrome (RLS) is a sensorimotor dysfunction disease, including idiopathic RLS and secondary RLS, which frequently appears in patients who have undergone hemodialysis (HD). RLS is defined by uncomfortable feelings in the legs that occur or become aggravated during the nighttime, and disappear or improve by moving the lower limbs. According to recent studies, the pathogenesis of idiopathic RLS involves both brain iron deficiency and dopaminergic function changes, but many of these potential mechanisms still need further studies. However, the iron deposition pattern of RLS in patients with HD (HD-RLS) may differ from that in those with idiopathic RLS. Obvious alterations in the iron deposition in the brain were found in HD patients, showing elevated iron content in some deep gray matter structures, and revealed that the iron concentration of the central nervous system compartments seems to rise over the duration of HD. Thus, whether regional alterations in brain iron deposition are a causal factor in HD-RLS or not still needs to be elucidated. QSM has been proven to be sensitive to iron in brain tissue. And recent studies have reported that specific subcortical gray matter nuclei, such as THA, caudate, putamen and globus pallidus (GP), can be characterized by QSM with a high spatial resolution level of anatomic structure. The existing literature has focused on exploring the level of iron in idiopathic RLS patients, but few studies have investigated the iron accumulation patterns and correlations between disease severity and brain iron levels in HD-RLS patients, especially by QSM.Purpose
To explore alterations in brain tissue iron deposition in HD-RLS patients and HD patients without RLS (HD-nRLS), and study whether the susceptibility values of deep gray matter structures could possibly serve as a reliable assessment of the severity of HD-RLS, we utilized quantitative susceptibility mapping (QSM) and ROI-based analysis.Methods
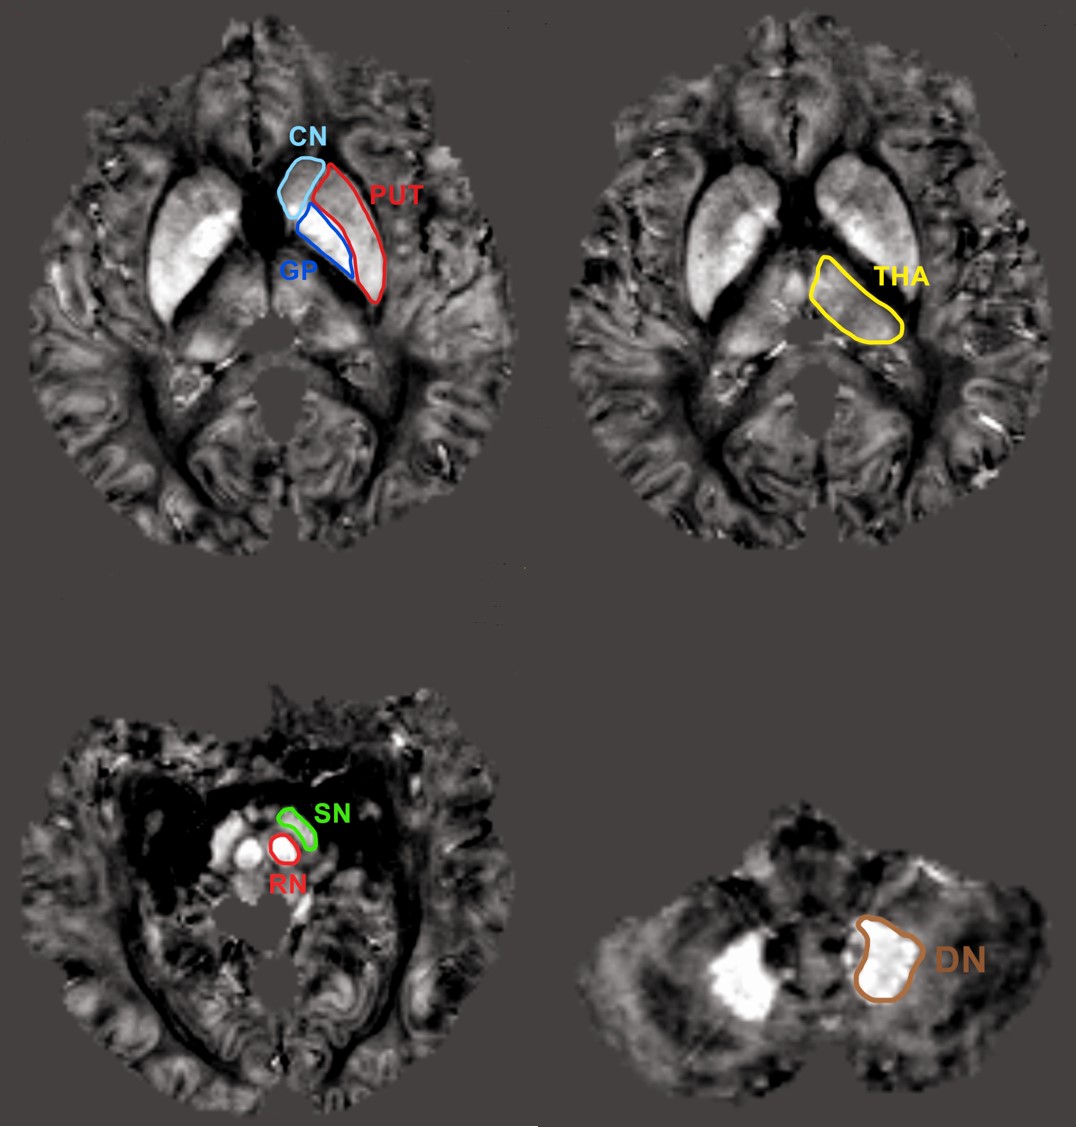
24 HD-RLS patients, 25 HD-nRLS patients and 30 age- and sex- matched healthy controls (HCs) were enrolled. The RLS severity assessment was then performed. The QSM was used to assess susceptibility values of the regions of interest (ROIs), including the caudate nucleus (CN), putamen (PUT), globus pallidus (GP), thalamus (THA), substantia nigra (SN), red nucleus (RN) and dentate nucleus (DN) (Figure 1). Their magnetic susceptibility was also measured. The correlation between RLS rating scores and susceptibility values of the ROIs was analyzed using spearman correlation analysis. ANOVA testing was applied to calculate the difference among three groups.Results
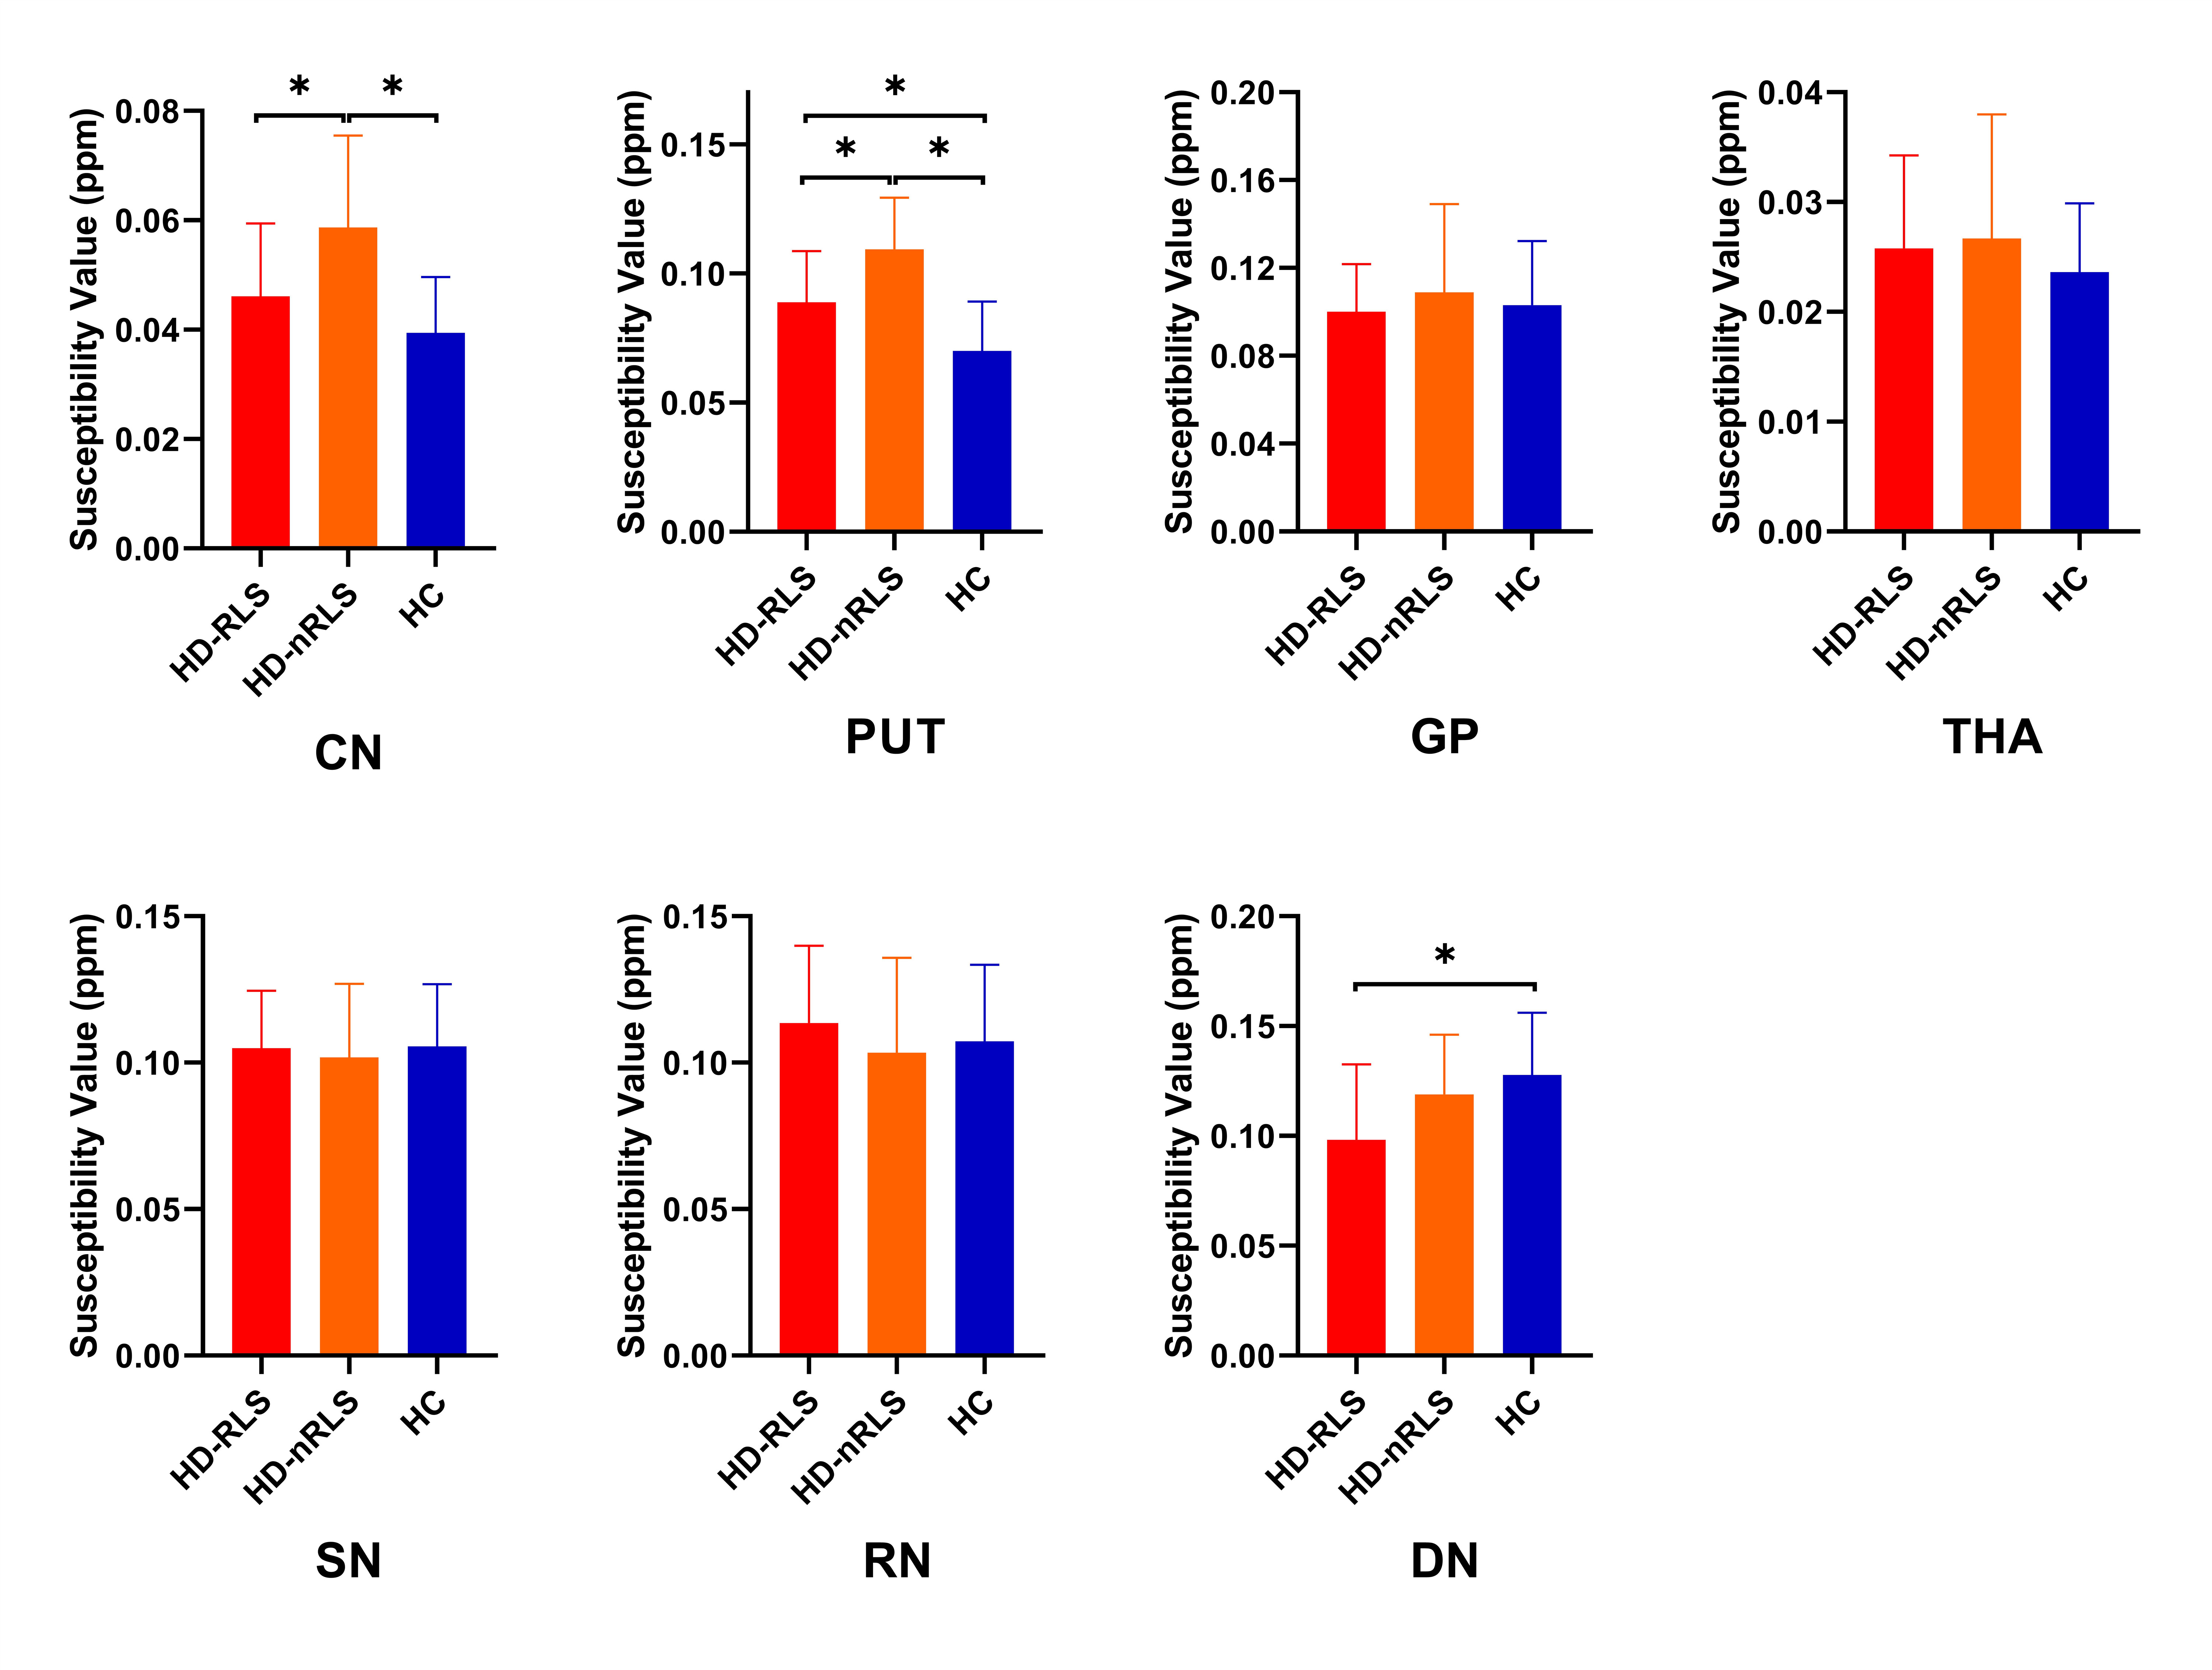
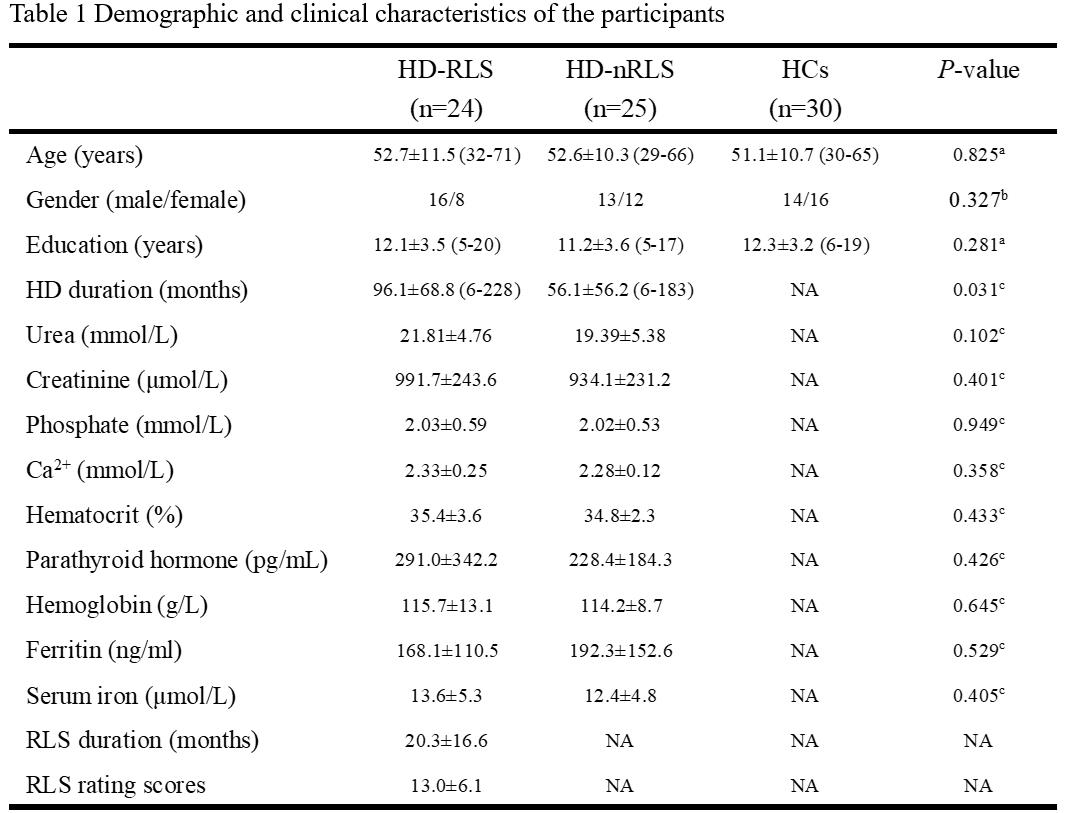
HD duration was significantly longer in HD-RLS patients than in HD-nRLS patients (P < 0.05)(Table 1). The susceptibility of HD-RLS and HD-nRLS patients in PUT was higher than that in HCs (P < 0.05), illustrating elevated iron content in the nucleus. Compared with HD-nRLS patients, HD-RLS patients demonstrated reduced susceptibility in CN and PUT (both P < 0.05). And compared with HCs, HD-RLS patients displayed decreased susceptibility in DN (P < 0.05) (Figure 2). In 7 ROIs, we did not find any significant correlation between susceptibility values and the serum iron level, ferritin level, RLS duration and RLS rating scores in the HD-RLS group.Conclusion
We used QSM to quantitatively explore the alterations in the brain tissue iron levels of HD patients in the CN, PUT, GP, THA, RN, SN and DN. Different patterns of iron deposition between the HD-RLS and HD-nRLS patients in the PUT and DN, which further supports a sensory processing disturbance in RLS, may be involved in the pathogenesis of RLS in patients with HD.Acknowledgements
We are grateful to PhD. Lizhi Xie from GE Healthcare, Beijing, People's Republic of China for valuable and helpful technical support, and Dr. Zhenchang Wang for proofreading the manuscript. The study is supported by National Natural Science Fundation of China (NSFC).References
[1]. Chai C, Yan S, Chu Z, et al. Quantitative measurement of brain iron deposition in patients with haemodialysis using susceptibility mapping. Metab Brain Dis 2015; 30(2): 563-71.
[2]. Du Lei,Zhao Zifang,Cui Ailing et al. Increased Iron Deposition on Brain Quantitative Susceptibility Mapping Correlates with Decreased Cognitive Function in Alzheimer's Disease.[J] .ACS Chem Neurosci, 2018, 9: 1849-1857.
[3]. Li Xu,Allen Richard P,Earley Christopher J et al. Brain iron deficiency in idiopathic restless legs syndrome measured by quantitative magnetic susceptibility at 7 tesla.[J] .Sleep Med., 2016, 22: 75-82.
Figures