1541
Temporal progression patterns of brain atrophy in CBS and PSP determined using Subtype and Stage Inference1Graduate School of Human Health Sciences, Tokyo Metropolitan University, Tokyo, Japan, 2Department of Radiology, Graduate School of Medicine, Juntendo University, Tokyo, Japan, 3Department of Radiology, Toho University Omori Medical Center, Tokyo, Japan
Synopsis
Corticobasal syndrome (CBS) and progressive supranuclear palsy (PSP) are two classic clinical syndromes derived from 4 microtubule-binding domain-repeat tau pathology. However, their clinical diagnosis remains challenging due overlaps in their motor symptoms. While majority of previous studies have assessed brain volumes using cross-sectional data, the present study utilizes Subtype and Stage Inference (SuStaIn) for brain volumes based on cross-sectional brain structural magnetic resonance imaging to identify the differences in temporal brain atrophy progression patterns between CBS and PSP. Our results suggested the utility of SuStaIn for estimating brain atrophy progression patterns in and discriminating between patients with CBS and PSP.
INTRODUCTION:
Corticobasal syndrome (CBS), which is closely associated with corticobasal degeneration (CBD), and progressive supranuclear palsy (PSP) are sporadic atypical parkinsonian disorders associated with the accumulation of insoluble deposits of predominantly 4 microtubule-binding domain-repeat (4R) tau protein in specific central nervous system neurons and glia.1-3 Considering the close overlap between the neurodegenerative conditions in CBS and PSP, particularly those related to the clinical information, pathology, biochemistry, and genetic risk factors, differentiating between CBS and PSP remains challenging.4 Although volumetry using brain magnetic resonance imaging (MRI) has been utilized for diagnosing CBS and PSP, most of the studies involving brain volumes have utilized cross-sectional data.5-8 While uncovering temporal brain atrophy progression patterns may help understand disease mechanisms, accurate patient stratification, and prognostication, collecting massive amounts of data to this end is difficult. Recently, an unsupervised machine-learning technique called Subtype and Stage Inference (SuStaIn) has been proposed to uncover data-driven disease phenotypes with distinct temporal progression patterns from widely available cross-sectional data. Therefore, to clarify the differences in temporal brain atrophy progression patterns between CBS and PSP, the present study utilized SuStaIn for regional brain volumes based on cross-sectional brain structural MRI.METHODS:
Data acquisitionDemographic characteristics of the participants were shown in Table 1. We obtained 3D-T1 data of 46 normal healthy controls from the Neuroimaging Initiative for Parkinson’s Progressing Markers Initiative (PPMI) database (https://www.ppmi-info.org). Moreover, 3D-T1 data of 28 CBS and 37 PSP patients were obtained from the Four Repeat Tauopathy Neuroimaging Initiative (4RTNI) database (http://4rtni-ftldni.ini.usc.edu). More detailed scan parameters of 3D-T1 data are described on PPMI (https://www.ppmi-info.org) and 4RTNI (https://www.ppmi-info.org) website.
Magnetic resonance volumetry
Ten subregions of the grey-matter volume including the frontal, temporal, parietal, and occipital lobes; cingulate gyrus; putamen; superior cerebellar peduncle (SCP); midbrain; pons; and medulla were calculated using FreeSurfer version 6.0.0.9 Each regional volume was converted into a z-score relative to a control population so that the control population had a mean of 0 and standard deviation of 1. Considering a decrease in regional brain volume and z-scores turning negative with disease progression, for the sake of simplicity, z-scores were multiplied by −1 so that they increased as the regional brain volumes decreased.
Subtype and Stage Inference modeling
SuStaIn10 was applied to cross-sectional regional brain volumes to identify both disease subtypes and their trajectories with distinct atrophy patterns. SuStaIn determined the optimal clustering of individuals according to disease subtypes that had distinct patterns of brain atrophy progression using their cross-sectional regional brain volumes (Figure 1). Each progression pattern indicated a sequential transition of individual subregions of grey matter volume from one z-score to another relative to the control population. To assess SuStaIn outcomes, classification accuracy and sensitivities for CBS and PSP were calculated.
RESULTS:
Figure 2 shows the temporal atrophy progression patterns in CBS and PSP using SuStaIn. SuStaIn revealed that CBS atrophy started from the fronto-parietal lobe, followed by the temporo-occipital lobe and putamen, and finally reached the cingulate gyrus and brain stem. On the other hand, PSP atrophy started from the midbrain and SCP, followed by the pons, medulla, putamen, cingulate gyrus, and fronto-parietal lobe, and eventually reached the temporo-occipital lobe. Accordingly, SuStaIn had a classification accuracy of 0.923 and a sensitivity of 0.821 and 1.000 for CBS and PSP, respectively (Figure 3).DISCUSSION:
This study introduced SuStaIn, a powerful tool for data-driven disease phenotype discovery, to determine differences in temporal brain atrophy progression pattern between CBS and PSP. Our results showed that SuStaIn successfully identified distinct brain atrophy progression patterns corresponding to CBS and PSP while also classifying CBS and PSP as individual disease subtypes with high accuracy.Dutt et al. reported that at baseline, patients with CBS exhibited atrophy of the regional volumes in the frontal lobe of the precentral gyrus and supplementary motor cortex and parietal lobe of the postcentral gyrus, which prominently extended to the putamen within 6 months and finally spread over the midbrain and pons within 12 months. Meanwhile, patients with PSP, at baseline, exhibited the most remarkable regional atrophy in the midbrain and pons, which widely extended to the fronto-parietal and occipital lobes, as well as the putamen, within 1 year.11 Accordingly, the brain atrophy progression patterns in CBS and PSP estimated by SuStaIn were almost consistent with the aforementioned results.
Despite the lack of studies on classifying CBS and PSP based on MR volumetry using unsupervised machine-learning techniques, such as SuStaIn, a few related studies are available. For instance, the mathematical model based on MR volumetry proposed by Gröschel et al. to classify CBD and PSP correctly predicted the diagnosis of CBD and PSP in 83% and 76% of the patients, respectivley.12 This suggested that SuStaIn modeling for disease stage heterogeneity allowed for better stratification between CBS and PSP compared with models that predict only disease subtypes.10
CONCLUSION:
SuStaIn was able to estimate brain atrophy progression patterns of CBS and PSP and classify the diseases with high accuracy. It is useful for understanding disease mechanisms and for accurate patient stratification and prognostication.Acknowledgements
No acknowledgement found.References
1. Litvan I, Hauw JJ, Bartko JJ, et al. Validity and reliability of the preliminary NINDS neuropathologic criteria for progressive supranuclear palsy and related disorders. J Neuropathol Exp Neurol. 1996;55(1):97-105.
2. Litvan I, Bhatia KP, Burn DJ, et al. Movement Disorders Society Scientific Issues Committee report: SIC Task Force appraisal of clinical diagnostic criteria for Parkinsonian disorders. Mov Disord. 2003;18(5):467-486.
3. Boeve BF. Parkinson-related dementias. Neurol Clin. 2007;25(3):761-781, vii.
4. Ling H, Macerollo A. Is it useful to classify PSP and CBD as different disorders? Yes. Mov Disord Clin Pract. 2018;5(2):145-148.
5. Lee SE, Rabinovici GD, Mayo MC, et al. Clinicopathological correlations in corticobasal degeneration. Ann Neurol. 2011;70(2):327-340.
6. Smith R, Schöll M, Widner H, et al. In vivo retention of 18F-AV-1451 in corticobasal syndrome. Neurology. 2017;89(8):845-853.
7. Tartaglia MC, Sidhu M, Laluz V, et al. Sporadic corticobasal syndrome due to FTLD-TDP. Acta Neuropathol. 2010;119(3):365-374.
8. Schonhaut DR, McMillan CT, Spina S, et al. 18 F-flortaucipir tau positron emission tomography distinguishes established progressive supranuclear palsy from controls and Parkinson disease: A multicenter study. Ann Neurol. 2017;82(4):622-634.
9. Fischl B. FreeSurfer. Neuroimage. 2012;15;62(2):774-781.
10. Young AL, Marinescu RV, Oxtoby NP, et al. Uncovering the heterogeneity and temporal complexity of neurodegenerative diseases with Subtype and Stage Inference. Nat Commun. 2018;9(1):4273.
11. Dutt S, Binney RJ, Heuer HW, et al. Progression of brain atrophy in PSP and CBS over 6 months and 1 year. Neurology. 2016;87(19):2016-2025.
12. Gröschel K, Hauser TK, Luft A, et al. Magnetic resonance imaging-based volumetry differentiates progressive supranuclear palsy from corticobasal degeneration. Neuroimage. 2004;21(2):714-24.
Figures
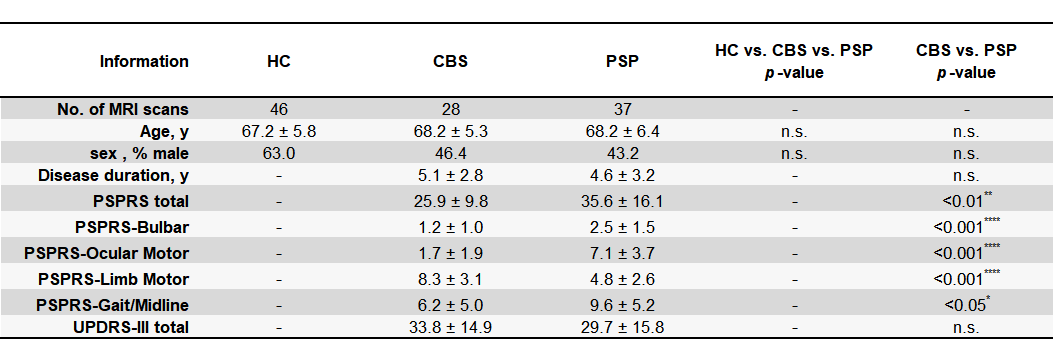
Table 1. Demographic characteristics of the participants
Abbreviations: HC; healthy control, CBS; Corticobasal syndrome, PSP; progressive supranuclear palsy, 4RTNI; the Four Repeat Tauopathy Neuroimaging Initiative, PPMI; the Neuroimaging Initiative for Parkinson’s Progressing Markers Initiative, PSPRS; PSP Rating Scale, range from 0 (best) to 100 (worst), UPDRS-III; Part-III (motor exams) of the Unified Parkinson's Disease Rating Scale, range from 0 (best) to 108 (worst), n.s.; not significant.
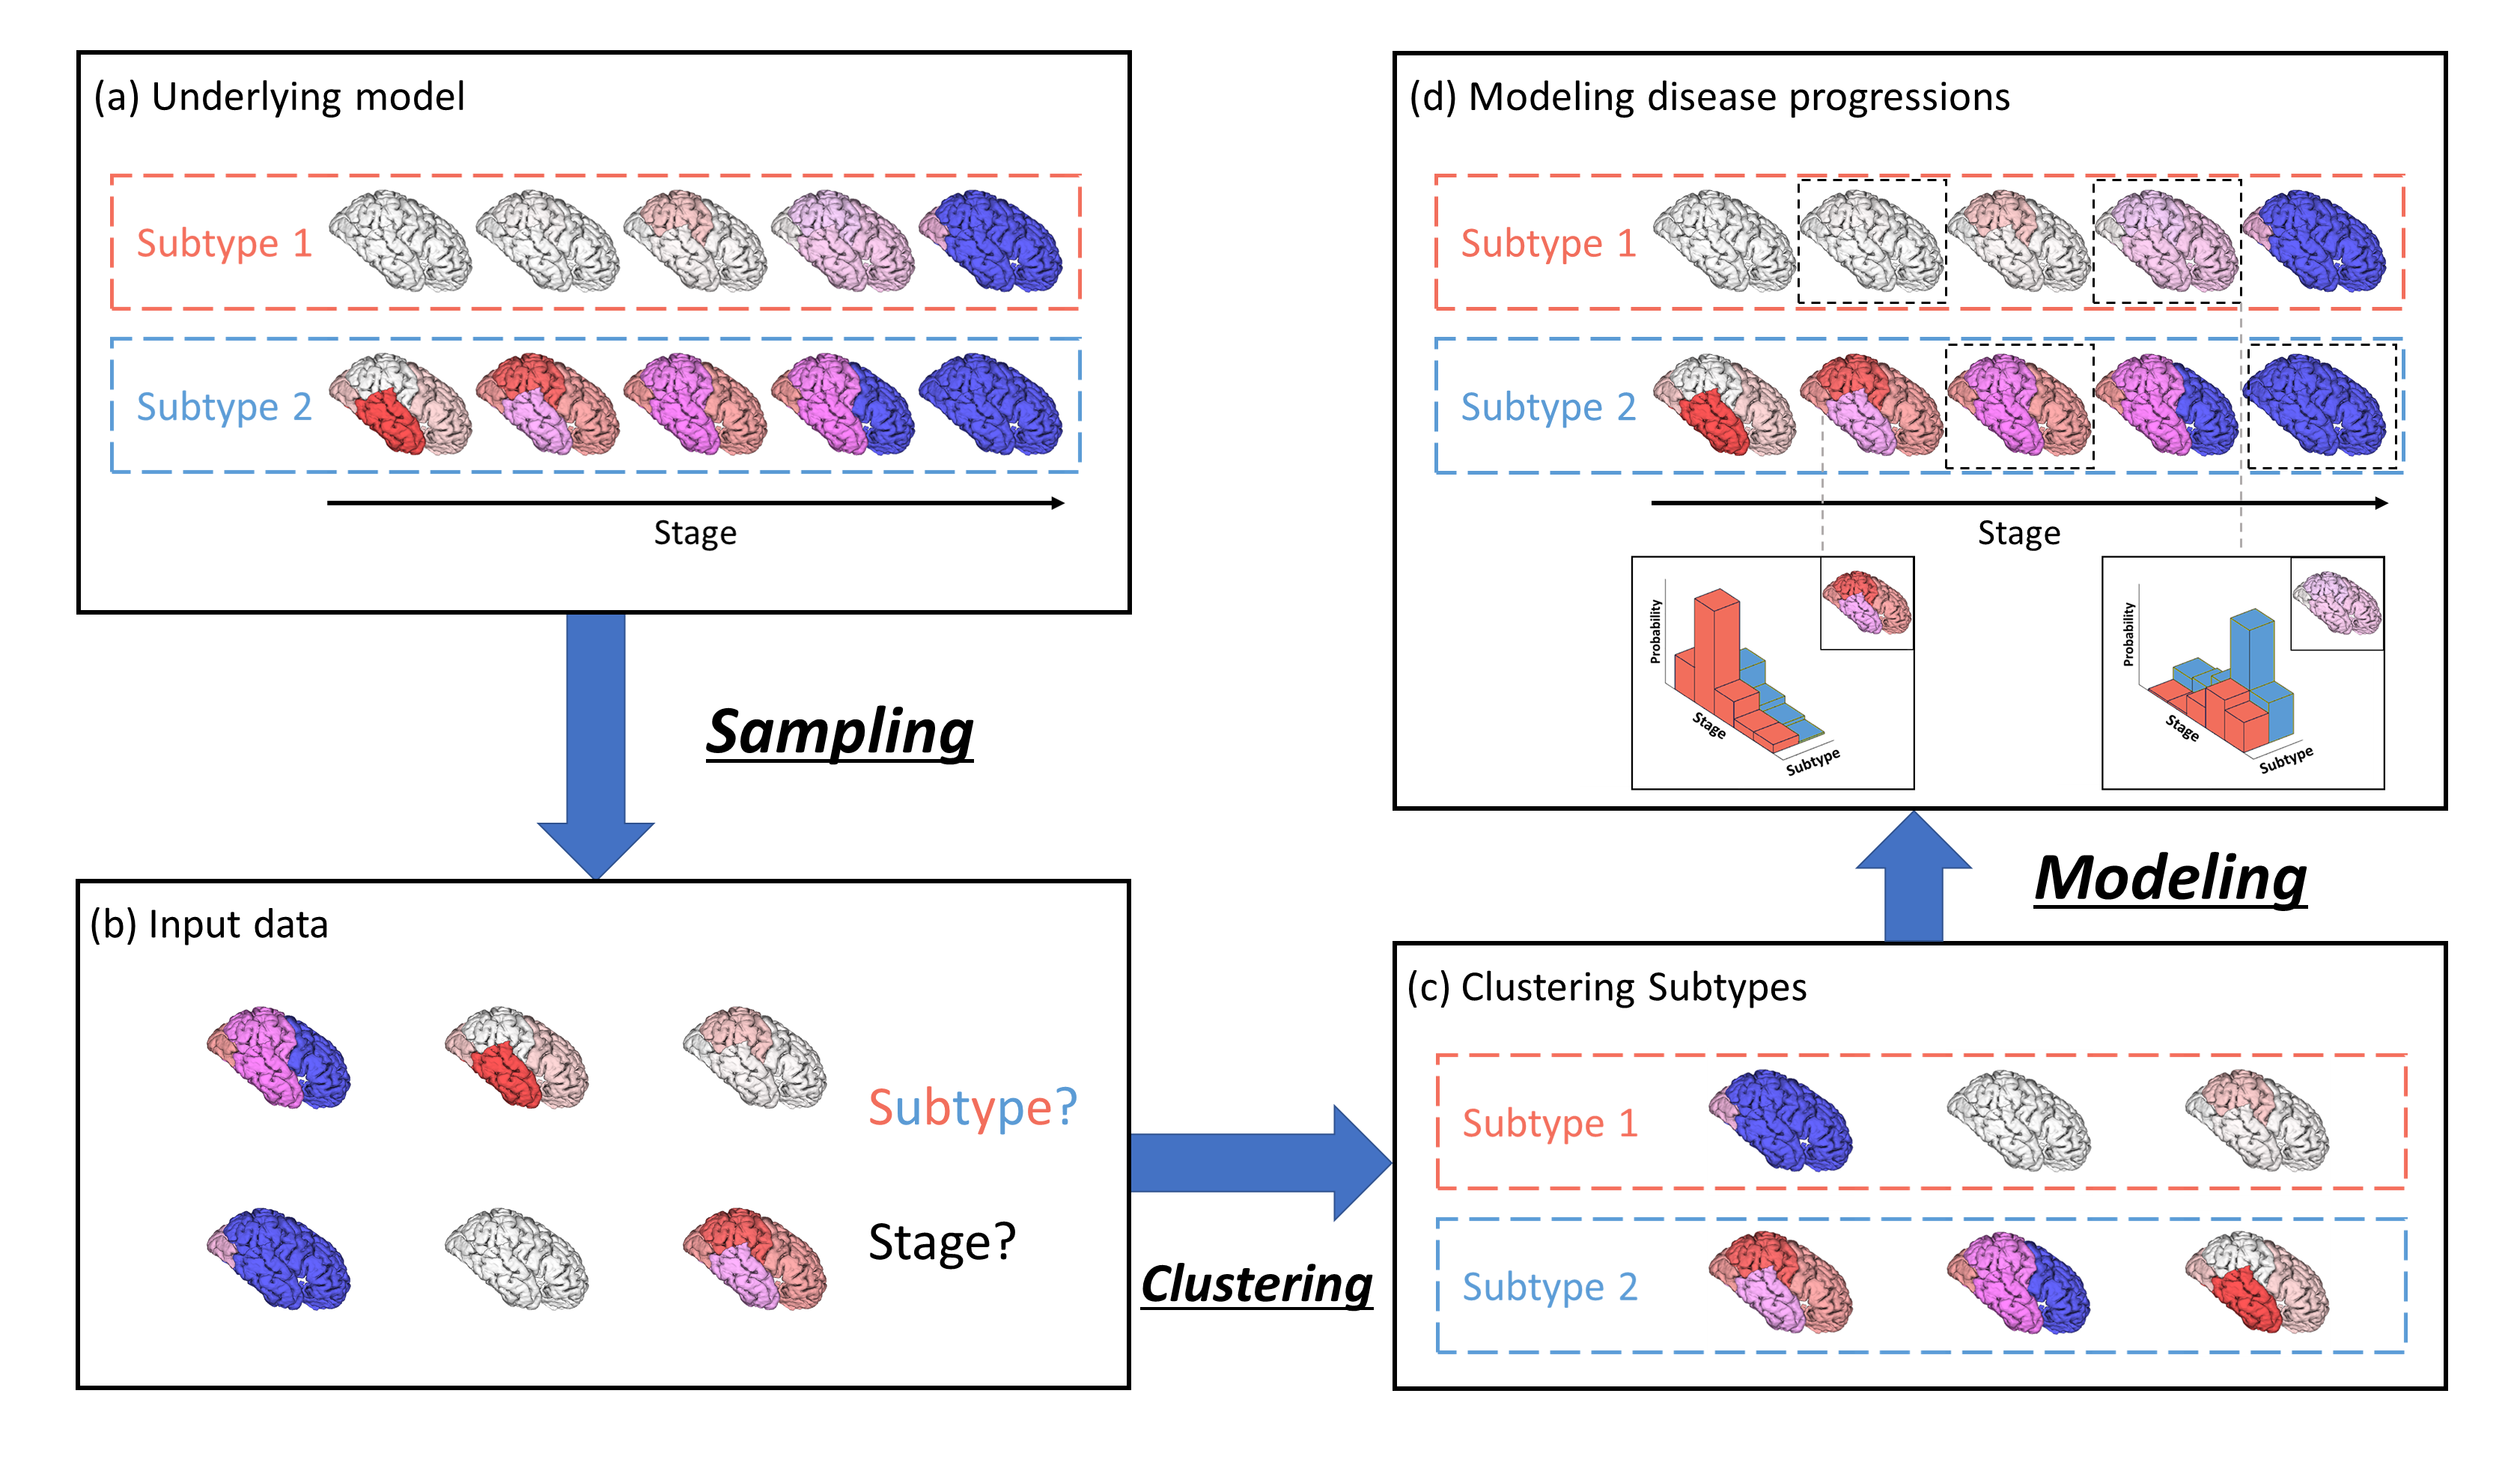
Figure 1. Conceptual overview of SuStaIn modeling
Assuming the underlying model (a), the input cross-sectional data (b) contains biomarker measurements from each subject with unknown subtype and temporal stage. SuStaIn recovers the set of disease subtypes and their temporal progression via simultaneous clustering (c) and disease progression modeling (d) and estimates the probability that the subject belongs to each subtype and stage from the reconstructed snapshot. The color of each region indicates the pathologic severity therein, ranging from white to red to magenta to blue.
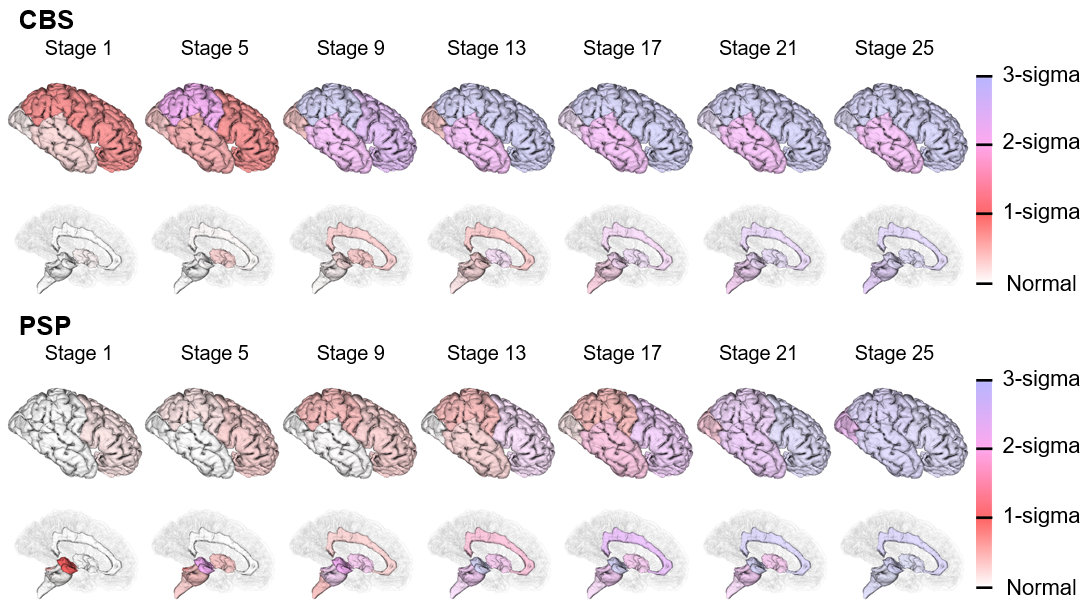
Figure 2. SuStaIn modeling of CBS and PSP using regional brain volumes
The rows show the brain atrophy progression pattern of both subtypes estimated using SuStaIn. Each progression pattern was inferred as a sequential transition of individual subregions of grey matter volume from one z-score to another relative to the control population. The color at each stage and brain region indicates the severity of regional volume atrophy with red being mildly affected (z-score of 1), magenta being moderately affected (z-score of 2), and blue being severely affected (z-score of over 3).
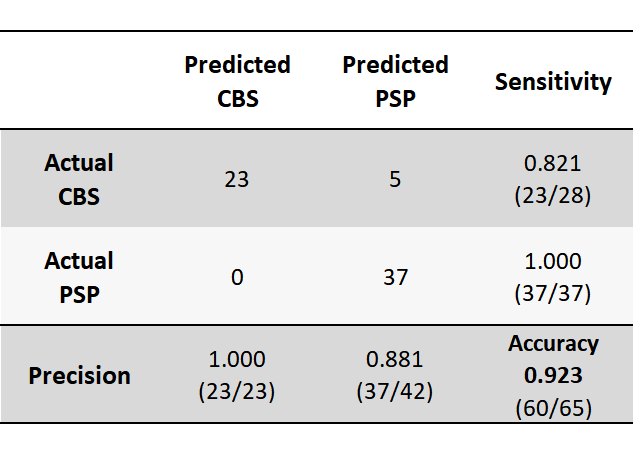
Figure 3. Confusion matrix for classifying CBS and PSP using SuStaIn
SuStaIn had a classification accuracy of 0.923 and a sensitivity of 0.821 and 1.000 for CBS and PSP, respectively. Thus, SuStaIn was able to classify the diseases of CBS and PSP with high accuracy.