1539
Quantitative Assessment of Pathological Brain Changes in HIV using MP2RAGE1Advanced Clinical Imaging Technology, Siemens Healthcare, Lausanne, Switzerland, 2Department of Radiology, Lausanne University Hospital and University of Lausanne, Lausanne, Switzerland, 3LTS5, École Polytechnique Fédérale de Lausanne (EPFL), Lausanne, Switzerland, 4Departement of Neurology, Lausanne University Hospital and University of Lausanne, Lausanne, Switzerland, 5Department of Neuroradiology, Faculty of Medicine, University of Freiburg, Freiburg, Germany, 6Department of Radiology and Medical Informatics, CIBM, Geneva University Hospital, Geneva, Switzerland, 7Cognitive Neurology Unit, Department of Neurology, University Hospitals of Geneva, Geneva, Switzerland, 8Division of Infectious Diseases, University Hospital Geneva, Geneva, Switzerland, 9Department of Infectious Diseases, Lausanne University Hospital and University of Lausanne, Lausanne, Switzerland, 10Neurologic Clinic and Policlinic, Departments of Medicine, Clinical Research and Biomedical Engineering, University Hospital Basel and University of Basel, Basel, Switzerland, 11Translational Imaging in Neurology (ThINk) Basel, Department of Medicine and Biomedical Engineering, University Hospital Basel and University of Basel, Basel, Switzerland
Synopsis
The clinical landscape of HIV has evolved from a fatal disease to a manageable condition, giving rise to secondary complications associated with the chronic infection still present under treatment. HIV penetrates the brain very early after infection. Here, we investigated the mechanism behind structural brain changes observed in 92 aviremic HIV patients compared to 125 seronegative controls using quantitative MRI. Changes in cortical and subcortical structures and T1 relaxation times were observed. We thus speculate that the differential pattern in HIV patients reflects biological mechanisms underlying different stages of brain infection, namely acute inflammation and neuronal loss.
Introduction
Combined anti-retroviral therapy (cART) has changed the landscape of Human Immunodeficiency Virus (HIV) infection from a fatal disease to a chronic condition. It is known that HIV penetrates very early into the central nervous system after infection1,2. In this study, we investigated the microstructural cortical and subcortical damage in HIV patients on cART by using volumetric and quantitative magnetic resonance imaging (MRI), both obtained from a single MP2RAGE acquisition.Methods
Ninety-two aviremic HIV patients on cART (51.9 ± 9.9 years old, 66% male) and 125 age-matched healthy controls (57.5 ± 11.1 years old, 32% male) from two cohorts (Neurocognitive Assessment in the Metabolic and Aging Cohort – NAMACO3; Neuro-HIV, CHUV platform4) were enrolled in this multi-centric study. Magnetization Prepared 2 Rapid Acquisition Gradient Echo (MP2RAGE, TR=5000ms, TE=~2.9ms, TI1=700ms, TI2=2500ms, FA1/FA2=4º/5º, voxel size =1x1x[1.2 or 1] mm3) images were acquired for all subjects. Image acquisition was carried out on different 3T scanners (all Siemens Healthcare, Erlangen, Germany) from two institutions (CHUV, Lausanne; HUG, Genève). MP2RAGE images were processed using an adapted pipeline5 based on FreeSurfer (v6.0) in order to assess the cortical thicknesses (CT) and the volume of subcortical structures. In order to characterize the brain structures affected by HIV and investigate the biological mechanisms behind the volumetric differences, the following evaluations were performed:1. Cortical and subcortical structural differences between HIV patients and healthy controls using linear models with age, gender and group-type as covariates.
2. Relaxometry comparison between HIV patients and healthy controls of the affected structures reported in 1).
3. Association of the relative percentage change of T1 values and CT for HIV with respect to healthy controls for the affected cortical areas reported in 1).
In the cortical analysis, linear models were fitted on each surface vortex. Correction for multiple comparisons was performed by Monte Carlo simulation as described in Hagler et al.6. Results were further Bonferroni-corrected for each hemisphere. In the subcortical analysis, the structures were normalized by the total intracranial volume to account for differences in head size, and robust linear models based on MM-type regression estimators7 were fitted with first-order interactions. Correction for multiple comparisons was performed using false discovery rate8. Confidence intervals were computed by bootstrapping with 10000 replicates. All the statistical analyses were performed using the R-software (v3.4.4).
Results
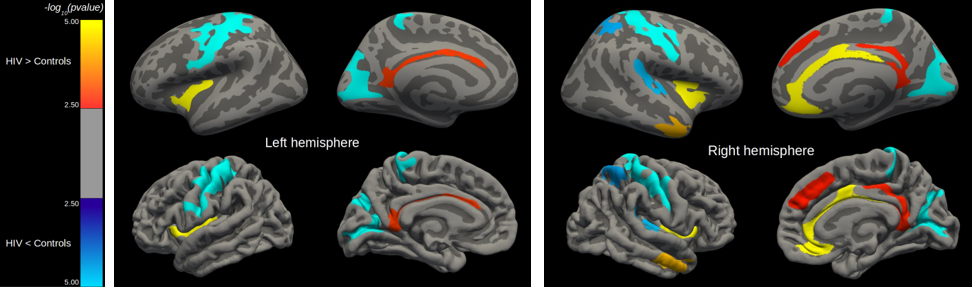
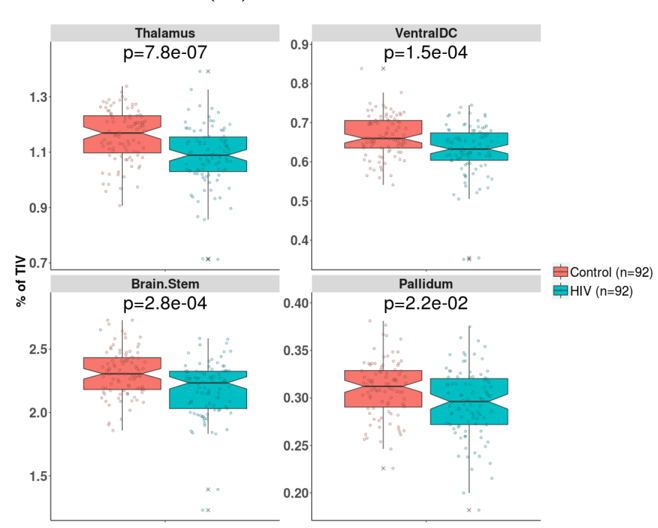
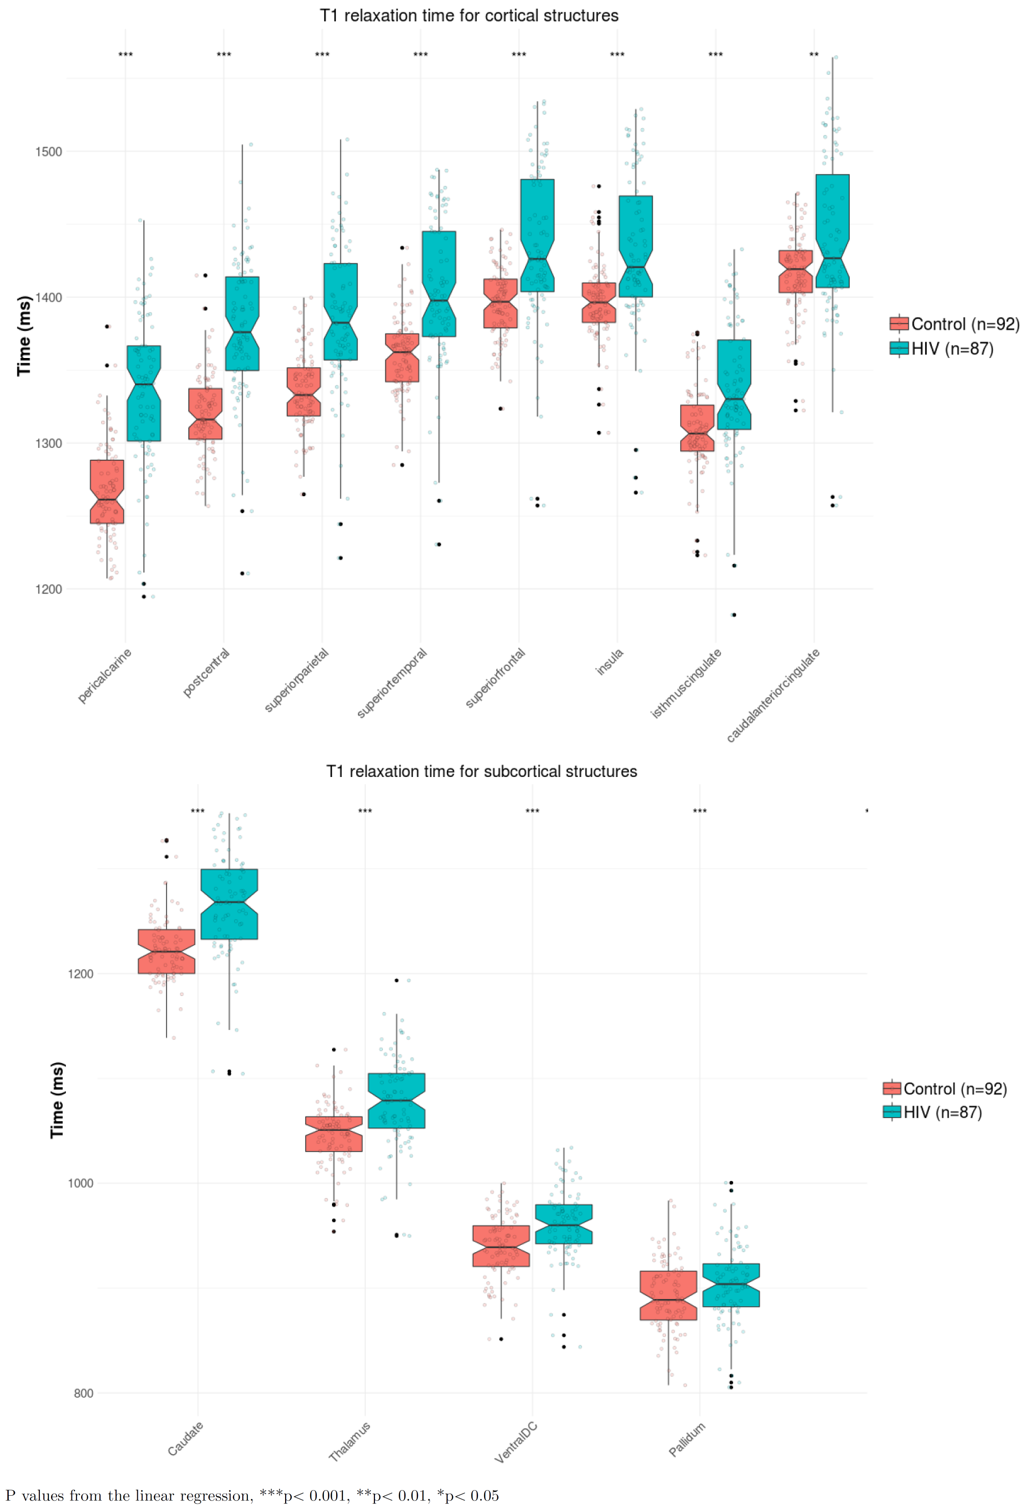
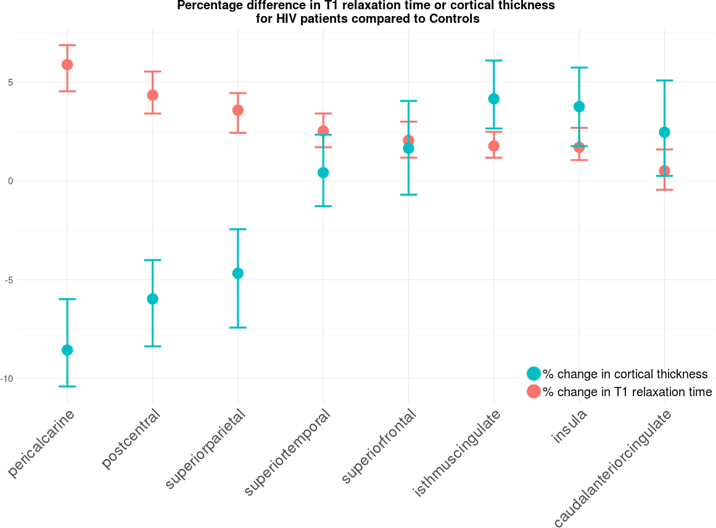
CT in HIV patients significantly decreased in the order of 5 to 10% in the postcentral gyrus (p<0.001) and cuneus/pericalcarine areas (p<0.001). CT in HIV patients increased in the order of 4 to 8% in the insula (p<0.001), cingulate cortex(p<0.01), and superior-frontal cortex (p<0.01, see Figure 1). Figure 2 shows that HIV patients undergo atrophy (3 to 13%) of subcortical structures such as thalamus (p=7.8e-7), ventral diencephalon (p=1.5e-4), brainstem (p=2.8e-4), and pallidum (p=2.2e-2). As shown in Figure 3, the T1 relaxation time is higher (p<0.01) for all the affected cortical and subcortical structures in HIV patients. An increase of T1 relaxation time appeared to be directly related to the decrease in cortical thickness (see Figure 4).Discussion and Conclusions
We showed a decrease of CT in specific brain areas as well as an increase of CT in others, confirming and extending existing literature9. HIV penetrates into the CNS very early after primary infection1,2. An increase of CT may be either due to inflammatory processes related to the local proliferation of HIV (e.g. gliosis and/or inflammatory edema10,11), or to compensatory plasticity12. A decrease of CT may be due to neuronal death and cortical tissue damage following acute inflammation13,14. We observed an increase of T1 relaxation times both for thinner and thicker cortical structures. Structures featuring an increase of cortical thickness were associated with smaller increase of T1 relaxation time when compared to the cortical areas with a decreased cortical thickness. An increase in T1 relaxation time is associated with loss of macromolecular structure (myelin, proteins, lipids) or inflammatory edema15. Moreover, T1 relaxation times are more strongly affected by micro- and macromolecular tissue loss than by increase in extracellular water16. These findings suggest that edema and inflammation are associated with an increase of cortical thickness as observed in the cingulate, insular and superiorfrontal regions, whereas neurodegeneration and tissue loss are associated with a decrease of cortical thickness observed in the pericalcarine and postcentral areas. Our findings related to subcortical structures are in line with other studies that showed atrophy in HIV patients mainly in the thalamus17 and brainstem18. Future work aims at amplifying and characterizing the neuropsychological profile of our HIV cohort in order to check the associations of cortical thickness increase or decrease with the magnitude of the cognitive impairment.*The first two authors contributed equally to this work
Acknowledgements
We thank all the patients participating in the NAMACO study. We thank all the infectious disease physicians and the study nurses working in the centres for their dedicated patient work and contribution to the NAMACO study.References
[1] - Zaina Zayyad and Serena Spudich. Neuropathogenesis of HIV: From Initial Neuroinvasion to HIV-Associated Neurocognitive Disorder (HAND). Current HIV/AIDS Reports, 12(1):16-24, 2015. ISSN 15483576. doi: 10.1007/s11904-014-0255-3.
[2] - Francisco Gonzalez-Scarano and Julio Martin-Garcia. The neuropathogenesis of aids. Nature Reviews Immunology, 5(1): 69-81, 2005.
[3] – Métral, M., Darling, K.E.A., Locatelli, I., Nadin, I., Santos, G., Brugger, P., Kovari, H., Cusini, A., Gutbrod, K., Tarr, P.E. and Calmy, A., 2019. The Neurocognitive Assessment in the Metabolic and Aging Cohort (NAMACO) study: baseline participant profile. HIV medicine.
[4] – K Vallotton, M Metral, O Chocron, R Meuli, D Alves, R Du Pasquier, and M Cavassini. Evaluation de la plateforme neuro-vih d'un hôpital universitaire par les patients et les médecins traitants [evaluation of an outpatient multidisciplinary neuro-hiv clinic by the patients and referring doctors]. Revue medicale suisse, 13(558):782-786, 2017.
[5] – Kyoko Fujimoto, Jonathan R Polimeni, Andre JW Van Der Kouwe, Martin Reuter, Tobias Kober, Thomas Benner, Bruce Fischl, and Lawrence L Wald. Quantitative comparison of cortical surface reconstructions from mp2rage and multi-echo mprage data at 3 and 7 t. Neuroimage, 90:60–73, 2014.
[6] – Donald J Hagler Jr, Ayse Pinar Saygin, and Martin I Sereno. Smoothing and cluster thresholding for cortical surface-based group analysis of fmri data. Neuroimage, 33(4):1093–1103, 2006.
[7] – Victor J Yohai. High breakdown-point and high efficiency robust estimates for regression. The Annals of Statistics, pages 642-656, 1987.
[8] – Yoav Benjamini and Yosef Hochberg. Controlling the false discovery rate: a practical and powerful approach to multiple testing. Journal of the royal statistical society. Series B (Methodological), pages 289-300, 1995.
[9] – Ventura Nina, Linda Douw, Diogo G. Correa, Tania M. Netto, Rafael F. Cabral, Fernanda Cristina Rueda Lopes, and Emerson L. Gasparetto. Increased posterior cingulate cortex efficiency may predict cognitive impairment in asymptomatic HIV patients. The neuroradiology journal 31(4): 372-378, 2018.
[10] – Hoai Ton and Huangui Xiong. Astrocyte dysfunctions and hiv-1 neurotoxicity. Journal of AIDS & clinical research, 4(11):255, 2013.
[11] – SM Stamatovic, OB Dimitrijevic, RF Keep, and AV Andjelkovic. Inflammation and brain edema: new insights into the role of chemokines and their receptors. In Brain Edema XIII, pages 444-450. Springer, 2006.
[12] – Haiwen Chen, Jane Epstein, and Emily Stern. Neural plasticity after acquired brain injury: evidence from functional neuroimaging. PM&R, 2(12):S306-S312, 2010.
[13] – P. M. Thompson, R. A. Dutton, K. M. Hayashi, A. W. Toga, O. L. Lopez, H. J. Aizenstein, and J. T. Becker. Thinning of the cerebral cortex visualized in HIV/AIDS reflects CD4+ T lymphocyte decline. Proceedings of the National Academy of Sciences, 102(43):15647–15652, 2005. ISSN 0027-8424. doi: 10.1073/pnas.0502548102. URL http://www.pnas.org/cgi/doi/10.1073/ pnas.0502548102.
[14] – Ming-Chang Chiang, Rebecca A Dutton, Kiralee M Hayashi, Oscar L Lopez, Howard J Aizenstein, Arthur W Toga, James T Becker, and Paul M Thompson. 3d pattern of brain atrophy in hiv/aids visualized using tensor-based morphometry. Neuroimage, 34 (1):44–60, 2007.
[15] – Guillaume Bonnier, Alexis Roche, David Romascano, Samanta Simioni, Djalel Meskaldji, David Rotzinger, Ying-Chia Lin, Gloria Menegaz, Myriam Schluep, Renaud Du Pasquier, et al. Advanced mri unravels the nature of tissue alterations in early multiple sclerosis. Annals of clinical and translational neurology, 1(6):423–432, 2014.
[16] – Guillaume Bonnier, Alexis Roche, David Romascano, Samanta Simioni, Djalel Eddine Meskaldji, David Rotzinger, Ying-Chia Lin, Gloria Menegaz, Myriam Schluep, Renaud Du Pasquier, et al. Multicontrast mri quantification of focal inflammation and degeneration in multiple sclerosis. BioMed research international, 2015, 2015.
[17] – Ryan Sanford, Lesley K. Fellows, Beau M. Ances, and D. Louis Collins. Association of Brain Structure Changes and Cognitive Function With Combination Antiretroviral Therapy in HIV-Positive Individuals. JAMA Neurology, (January), 2018. ISSN 2168- 6149. doi: 10.1001/jamaneurol.2017.3036. URL http://archneur.jamanetwork.com/article.aspx?doi=10.1001/jamaneurol. 2017.3036.
[18] – Ryan Sanford, Ana Lucia Fernandez Cruz, Susan C Scott, Nancy E Mayo, Lesley K Fellows, Beau M Ances, and D Louis Collins. Regionally specific brain volumetric and cortical thickness changes in hiv-infected patients in the haart era. Journal of acquired immune deficiency syndromes (1999), 74(5):563, 2017.
Figures