1538
Relationship between Free Water and Neuroinflammation/Neurodegeneration Markers in HIV Before and After Combination Antiretroviral Therapy1Department of Neurology, University of Rochester, Rochester, NY, United States, 2Electrical & Computer Engineering, University of Rochester, Rochester, NY, United States, 3Radiology, University of Rochester, Rochester, NY, United States, 4Imaging Sciences, University of Rochester, Rochester, NY, United States, 5Physics, University of Rochester, Rochester, NY, United States, 6Computer Science, University of Sherbrooke, Sherbrooke, QC, Canada, 7Neurology, University of Rochester, Rochester, NY, United States
Synopsis
Free water (FW) index, a measure of extracellular non-flowing water in the brain parenchyma, can be sensitive to neuroinflammation. We examine the relationship between the FW index and putative markers of neuroinflammation in cART-naïve participants before and after 12 weeks of the treatment. We found that FW index correlated with neuroinflammation markers in HIV+ participants for some GM and WM structures at baseline while this correlation diminished after 12 weeks of cART treatment in some WM structures for NfL.
Introduction:
Neuroinflammation plays a crucial role in the pathogenesis of many neurological disorders including HIV [1]. Initiation of combination antiretroviral therapy (cART) reduces the inflammation in HIV infected individuals [1]. Recent studies documented that free water (FW) modeling from diffusion MRI can be sensitive to neuroinflammation [2, 3]. This FW index measures the contribution of water molecule diffusing freely in the extracellular space, as estimated by a bi-tensor model [4]. In this work, we examine the relationship between the FW and putative markers of neuroinflammation in cART-naïve participants before and after 12 weeks of cART.Methods & Materials:
Thirty HIV+ (age=33.2±12.7years, range =20-63years, female=2) and 30 age-matched healthy participants (age=33.2±12.3years, range=18-63 years, female=11) were selected from an ongoing study on cART at the University of Rochester. All participants provided informed consent according to the institutional protocol and underwent clinical, laboratory and brain MRI exams. HIV+ participants were evaluated before and 12-weeks after cART while healthy participants were evaluated only once. Plasma levels of markers associated with neuroinflammation and neurodegeneration (Neurofilament light chain NfL, Tau and Amyloid beta Aβ) were measured by Simoa assay via a commercial lab, QuanterixTM, Lexington, MA, United States. MRI was performed on a 3T Siemens (MAGNETOM Trio) scanner equipped with a 32-channel head coil. The protocol includes a T1w image using MPRAGE sequence [TI=1,100ms, TE/TR=3.44ms/2,530ms, voxel size = 1×1×1 mm3] and a Diffusion weighted imaging (DWI) sequence using spin-echo echo-planar imaging (SE-EPI) sequence [60 diffusion-encoded (b=1000 s/mm2), 10 reference (b=0 s/mm2); TR=3,200ms; TE=57ms; voxel size=2×2×2 mm3]. In order to correct for distortions, a double-echo gradient-echo field map was also acquired. DWI data were preprocessed using FSL. Free water (FW) maps were computed on a voxel-by-voxel basis from the DWI data using the previously described method [3] and all the processing was performed using a Nextflow [5] pipeline with all software dependencies bundled in a Singularity container [6]. High resolution T1w images were coregistered to the MNI space using ANTs and then the same transformations were applied to the corresponding FW maps. The Harvard-Oxford (subcortical) and JHU-ICBM (WM and tracts) atlases were used to calculate region averages in standard space in 35 pre-defined regions-of-interest (ROI) [GP: Globus pallidus; PUT: Putamen; CN: Caudate Nucleus; TH: Thalamus; Hippo: Hippocampus; Amyg: Amygdala; AccN: Accumbens Nucleus; SCC: Splenium of corpus callosum; GCC: Genu of corpus callosum; CST: Corticospinal tract; ATR: Anterior thalamic radiation; PTR: Posterior thalamic radiation; ALIC: Anterior limbic internal capsule; PLIC: Posterior limbic internal capsule; EC: External capsule; SLF: Superior longitudinal fasciculus; FMaj: Forceps Major; FMin: Forceps Minor; Cingulum and Fornix]. FW values were averaged over bilateral ROIs (except some WM tracts) for each participant and then compared between the study groups (i.e., baseline vs. 12 weeks in HIV+ and baseline HIV+ vs. healthy controls) using t-tests. Partial correlations examined the relationship between FW and plasma levels of markers associated with neuroinflammation and neurodegeneration (NfL, Tau, Aβ-40, Aβ-42, Aβ-ratio).Results:
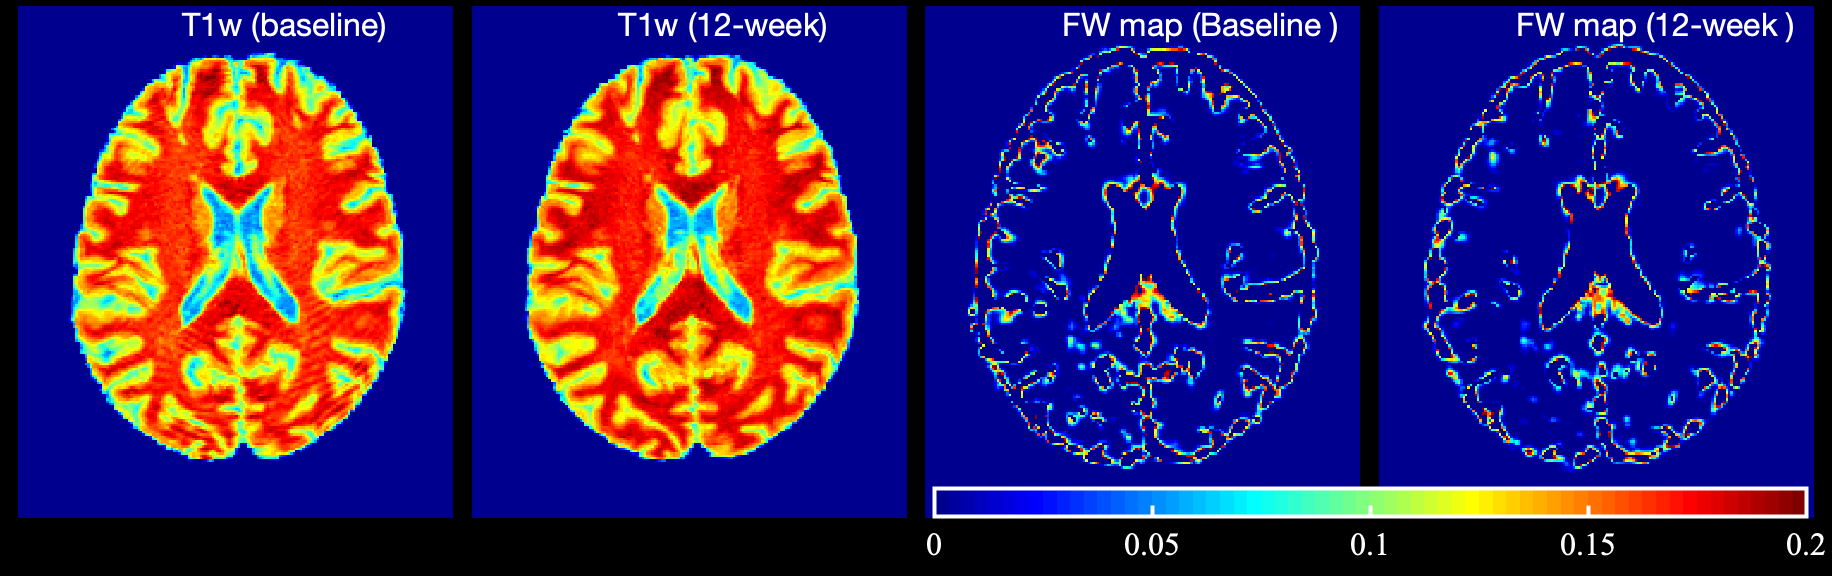
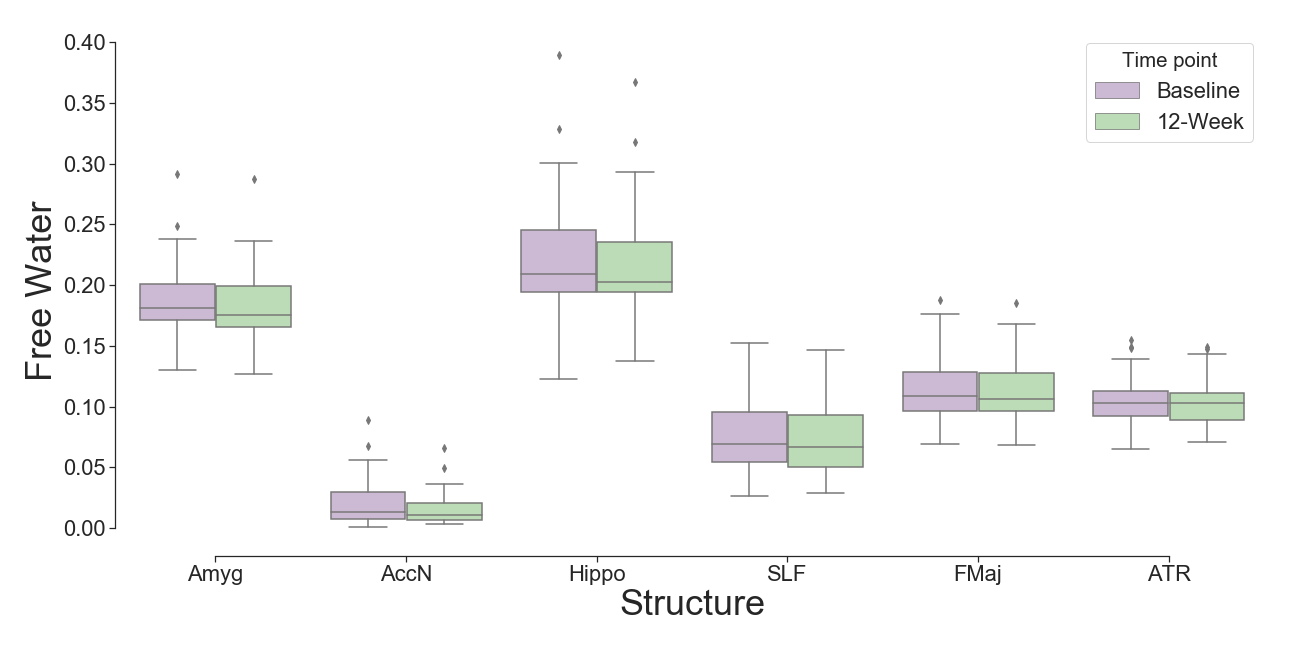
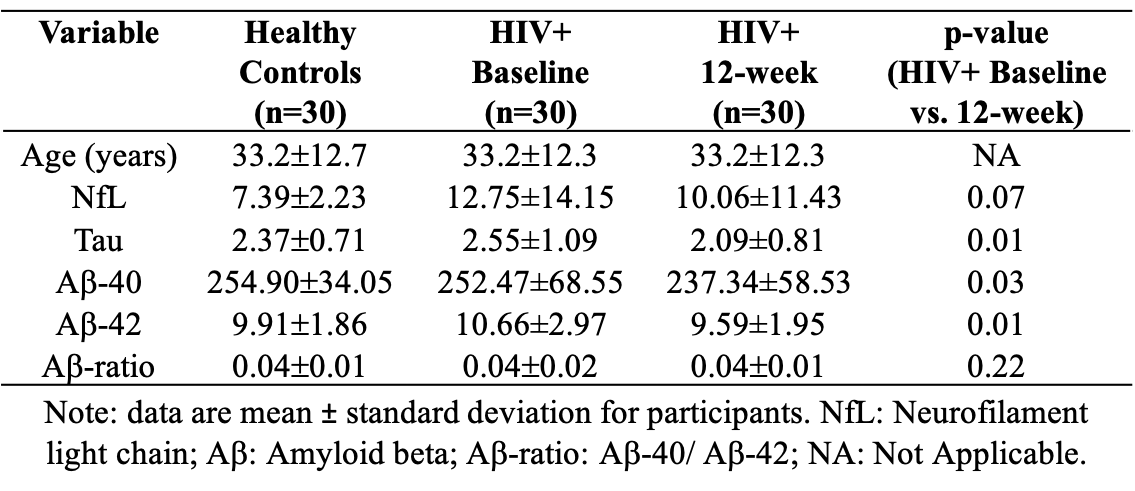
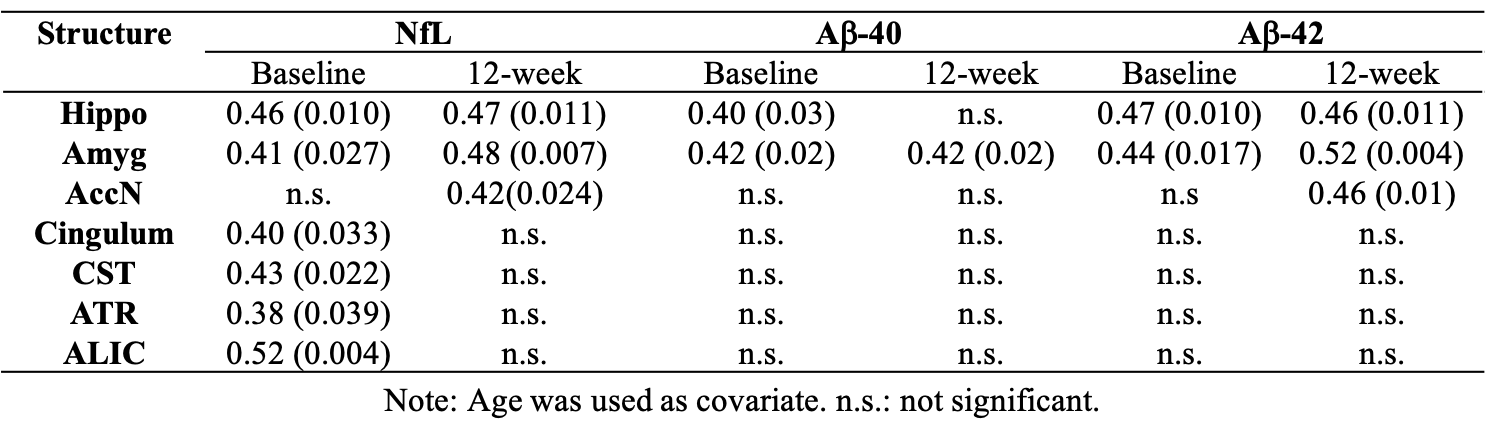
Demographic and clinical data of the participants are presented in Table 1. Figure 1 represents example images (T1w and FW maps) from a 33 years old HIV participant before and after cART treatment. FW values were decreased after 12 weeks of cART initiation. Figure 2 shows the comparison of FW values in different ROIs in WM and subcortical GM at baseline and 12-week after cART treatment. In the HIV+ group FW values were found significantly higher at baseline vs 12 weeks of cART in Hippo (t=2.16, p=0.038, Cohen’s d=0.39), Amyg (t=2.55, p=0.016, d=0.46), AccN (t=2.50, p=0.018, d=0.46), SLF (t=2.49, p=0.017, d=0.45), Cingulum (t=3.15, p=0.003, d=0.57), FMaj(t=2.45, p=0.02, d=0.44), ATR (t=2.02, p=0.05, d=0.37) with medium effect size. However, there was no significant difference in FW between the HIV+ baseline and healthy controls. In HIV+ at baseline, we found a significant positive correlation (r=0.4-0.5, p<0.05) between FW and NfL in AccN, Amyg, HC, Cingulum, ALIC, CST and ATR. This changed after cART treatment, when the correlations in Cingulum, ALIC, CST and ATR were no longer significant. There were significant correlations of Aß (both Aß-40 and Aß-42) with FW for Hippo, Amyg and AccN, and no significant correlations for Tau vs. FW and Aß-ratio vs. FW in either healthy controls or HIV. In addition, no significant correlations were found between FW and neuroinflammatory markers in the healthy cohort.Discussion:
We found that both FW index and putative neuroinflammatory/neurodegenerative markers were decreased after 12 weeks of cART treatment in HIV+ compared to HIV+ baseline and healthy controls. FW correlated with neuroinflammation markers in HIV+ participants for some GM and WM structures at baseline while this correlation diminished after 12 weeks of cART treatment in some WM structures for FW vs. NfL. These findings suggest that neuroinflammation may be associated with glial changes that reduce the extracellular space [7].Conclusion:
This study demonstrates that FW diffusion index can be used to monitor changes in extracellular free-water which is likely to be a marker of neuroinflammation in HIV infection. Moreover, FW might be useful to measure the change of neuroinflammation in HIV+ before and after the cART treatment. Further investigation is warranted to understand the cellular mechanisms of underlying changes in the FW index and the association with neuroinflammation.Acknowledgements
This work is supported by the National Institute of Mental Health (R01 MH099921).References
1. Gawron, N., et al., Effects of age, HIV, and HIV-associated clinical factors on neuropsychological functioning and brain regional volume in HIV+ patients on effective treatment. Journal of neurovirology, 2019. 25(1): p. 9-21.
2. Pasternak, O., et al., The extent of diffusion MRI markers of neuroinflammation and white matter deterioration in chronic schizophrenia. Schizophrenia research, 2015. 161(1): p. 113-118.
3. Dumont, M., et al., Free water in white matter differentiates MCI and AD from control subjects. Front Aging Neurosci. 2019; 11:270.
4. Pasternak, O., et al., Free water elimination and mapping from diffusion MRI. Magnetic Resonance in Medicine, 2009. 62(3): p. 717-730.
5. Di Tommaso, P., et al., Nextflow enables reproducible computational workflows. Nature biotechnology, 2017. 35(4): p. 316.
6. Kurtzer, G.M., et al., Singularity: Scientific containers for mobility of compute. PloS one, 2017. 12(5): p. e0177459.
7. de Paula, H.H.S., et al., Reduction of inflammation and T cell activation after 6 months of cART initiation during acute, but not in early chronic HIV-1 infection. Retrovirology, 2018. 15(1): p. 76.
Figures