1537
Investigation of the Global Volumetry and Relaxometry of the Brain in Parkinson's Disease using Synthetic MRI1Department of Radiology, Beijing Hospital, National Center of Gerontology, Beijing, China, 2Graduate School of Peking Union Medical College, Beijing, China, 3Department of Neurology, Beijing Hospital, National Center of Gerontology, Beijing, China, 4GE Healthcare, MR Research China, Beijing, China
Synopsis
This study revealed both the brain volumetric and relaxometric characteristics from synthetic MRI technique in Parkinson's disease (PD). Significantly differences were found in fraction of gray matter (GM), white matter (WM) and myelin. We also observed significantly differences in WM T1 value, GM and CSF proton density value. Hence Synthetic MRI might be a quantitative tool for clinical diagnosis of PD.
Synopsis
This study revealed both the brain volumetric and relaxometric characteristics from synthetic MRI technique in Parkinson's disease (PD). Significantly differences were found in fraction of gray matter (GM), white matter (WM) and myelin. We also observed significantly differences in WM T1 value, GM and CSF proton density value. Hence Synthetic MRI might be a quantitative tool for clinical diagnosis of PD.Introduction
Parkinson’s disease (PD) with three typical symptoms, including rest tremor, rigidity, and bradykinesia , is the second most common age-related neurodegenerative disease in the world[1]. While previous studies have described distinct diagnostic criteria for PD[2] the diagnostic accuracy still largely depends on the clinical experience of the physician. It is thus of importance to identify an objective and quantitative biomarker to support clinical PD diagnosis.Using the synthetic Magnetic Resonance Imaging (MRI) technique, here we examined both global volumetric and relaxometry of the brain, and validated the feasibility of these characteristics in differentiating PD patients from healthy controls.Methods
Eleven PD patients (age: 60±14 years) and eighteen healthy controls (age: 67±9 years) were enrolled in this study. All data were obtained on a 3T MRI scanner (Signa Pioneer, GE Healthcare). All participants underwent synthetic MRI (MAGnetic resonance Imaging Compilation, MAGiC) acquisition with following parameters: FoV = 240x240 mm, matrix = 320x256, slice thickness/gap = 4/0.5 mm, TR = 4819ms, TE = 21.5/86.1 ms, TI = 170/670/1840/3840 ms. The synthetic MRI raw data were further processed using SyMRI 8.0 software (SyntheticMR, Sweden) to generate relaxation maps and brain segmentation results. Volumetric characteristics including white matter volume (WMV), gray matter volume (GMV), cerebral spinal fluid volume (CSFV), myelin volume (MYV), white matter fraction (WMF = WMV/brain parenchymal volume (BPV)), gray matter fraction (GMF = GM/BPV), myelin fraction (MYF = MYV/BPV) were also acquired. The average relaxometric characteristics including T1, T2 and proton density (PrD) values in WM, GM and CSF were calculated from voxels with partial volume exceeding 95% of the corresponding tissue.Unpaired two-samples Student's t test was used to assess the difference of the age, volumetric and relaxometric characteristics between two groups. Chi-square test was used to assess the gender difference between two groups.Results
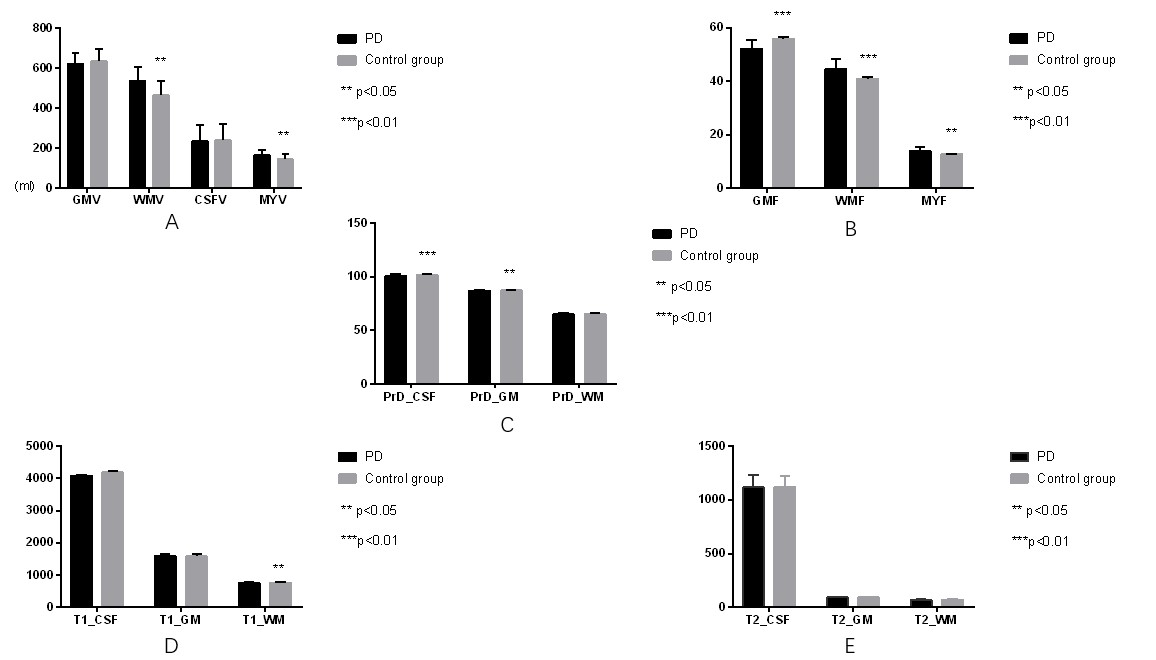
No difference was observed in age (P = 0.188) and gender (P = 0.450) between two groups. For volumetry, we found significant higher WMV (533.0±67.6 vs 466.9±69.9, P = 0.018), MYV (161.3±25.1 vs 146.3±5.5, P = 0.033) (Fig. 1A), WMF (0.447±0.03 vs 0.409±0.023, P = 0.002), MYF (0.139±0.01 vs 0.128±0.01, P = 0.034), and a significant lower GMF (0.521±0.03 vs 0.559±0.02, P = 0.000) (Fig. 1B) in PD patients. No difference was observed in GMV and CSFV. For relaxometry, we found significant lower T1 value of WM (746.4±26.1 vs 764.4±19.5, P = 0.041) (Fig. 1D), PrD value of GM (86.8±0.46 vs 87.2±0.40, P = 0.016), and PrD value of CSF (100.7±1.27 vs 101.8±0.83, P = 0.008) in PD patients (Fig. 1C). No difference was observed in GM T1 value, CSF T1 value, WM PrD value, and all T2 values(Fig.1E).Discussion and Conclusion
Our study found that PD patients have a lower GMF and higher WMF than healthy controls. A previous study has demonstrated that the myelin water fraction of PD were higher than control in frontal and temporal white matter and bilateral thalamus[3]. Our results corroborated with their finding by showing higher whole brain MYV and MYF in PD patients. In agreement with former study[4], we found the T1value of WM, PrD value of GM, and PrD value of CSF were all lower in PD group than in healthy control group. These results may due to the pathological fact that nigral dopamine neurons are greatly diminished and Lewy bodies are present in the remaining neurons[5]. Overall, we show that volumetry and relaxometry simultaneously obtained from synthetic MRI may be used as quantitative biomarkers for clinical diagnosis of PD.Acknowledgements
No acknowledgement found.References
[1]. Sharma, S., et al., Biomarkers in Parkinson's disease (recent update). Neurochemistry international, 2013. 63(3): p. 201-29.
[2]. Bhidayasiri, R. and H. Reichmann, Different diagnostic criteria for Parkinson disease: what are the pitfalls? Journal of neural transmission (Vienna, Austria : 1996), 2013. 120(4): p. 619-25.
[3]. Dean, D.C., et al., Alterations of Myelin Content in Parkinson’s Disease: A Cross-Sectional Neuroimaging Study. PLOS ONE, 2016. 11(10): p. e0163774.
[4]. Nurnberger, L., et al., Longitudinal changes of cortical microstructure in Parkinson's disease assessedwith T1 relaxometry. NeuroImage. Clinical, 2017. 13: p. 405-414.
[5]. Kalia, L.V. and A.E. Lang, Parkinson's disease. Lancet (London, England), 2015. 386(9996): p. 896-912.
Figures